. 2025 Sep 2;85(17):3348-3364.
doi: 10.1158/0008-5472.CAN-24-3904.

NF1 Loss Promotes EGFR Activation and Confers Sensitivity to EGFR Inhibition in NF1-Mutant Melanoma

Affiliations

NF1 Loss Promotes EGFR Activation and Confers Sensitivity to EGFR Inhibition in NF1-Mutant Melanoma

Milad Ibrahim et al. Cancer Res. .

Abstract

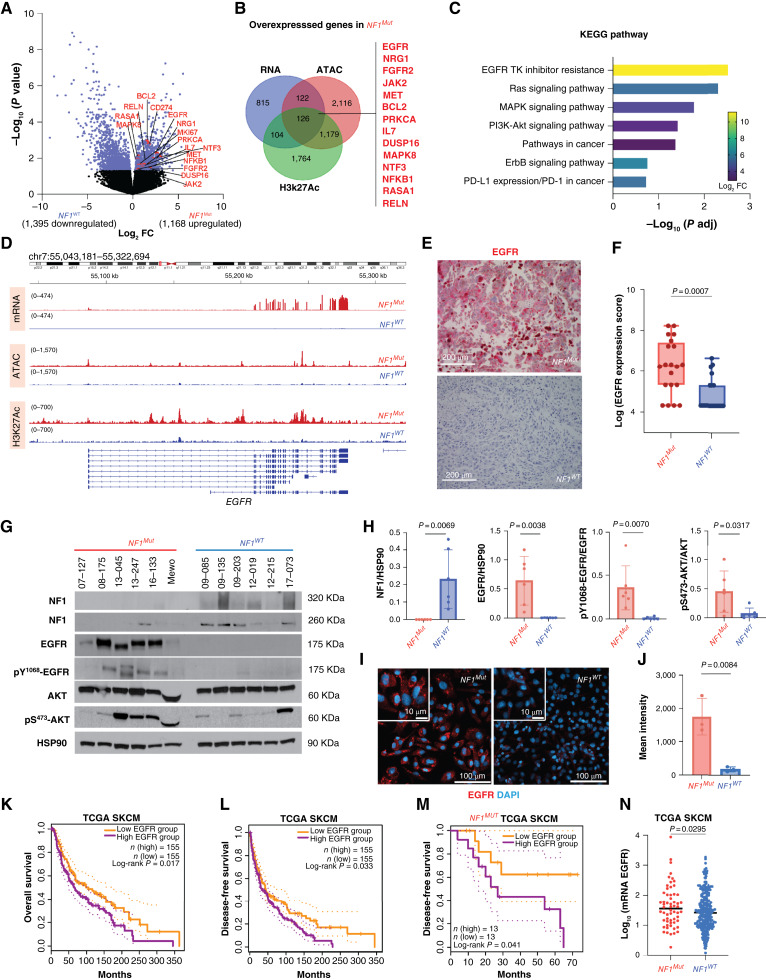
Targeted therapies and immunotherapy have improved treatment outcomes for many patients with melanoma. However, patients whose melanomas harbor driver mutations in the neurofibromin 1 (NF1) tumor suppressor gene often lack effective targeted treatment options when their tumors do not respond to immunotherapy. In this study, we utilized patient-derived short-term cultures and multiomics approaches to identify molecular features that could inform the development of therapies for patients with NF1-mutant (NF1Mut) melanoma. Differential gene expression analysis revealed that EGFR is highly expressed and active in NF1Mut melanoma cells, in which it hyperactivates ERK and AKT, leading to increased tumor cell proliferation, survival, and growth. In contrast, genetic or pharmacologic inhibition of EGFR hindered cell proliferation and survival and suppressed tumor growth in patient-derived NF1Mut melanoma models but not in NF1 wild-type models. These results reveal a connection between NF1 loss and increased EGFR expression that is critical for the survival and growth of NF1Mut melanoma cells in patient-derived culture and xenograft models, irrespective of their BRAF and NRAS mutation status.

Significance: NF1 mutant melanomas rely on EGFR activation and can be effectively treated with the EGFR inhibitors cetuximab or afatinib, supporting further testing in clinical trials.


Conflict of interest statement

No disclosures were reported.

Figures

None
Graphical abstract
Figure 1.
Figure 1.
Study workflow and NF1 mutations characterization. A, Schematic representation of the study workflows, starting from isolating and establishing 32 melanoma STCs, defining their genetic, cistromic, and transcriptomic features, identifying differentially expressed gene sets and druggable targets expressed in NF1Mut STCs, validating them in an independent patient cohort, and testing them in preclinical culture and xenograft mouse models. B, Heatmap representing the COSMIC mutational signature components and bar graphs indicating tumor mutational burden (TMB) in each STC. C, Box plots showing tumor mutational burden in NF1Mut compared with NF1WT STCs. P values were generated by a two-sided nonparametric t test. D, Lollipop plot showing mutated sites in the NF1 gene. Red type indicates C>T transitions. E and F, PCA plots of RNA-seq, ATAC-seq, H3K4Me3, and H3K27Ac studies in melanoma STCs colored based on their genetic driver mutations (E) or transcriptional cell states (F). G, A complex heatmap showing NF1, BRAF, NRAS, CDKN2A, KIT, PTEN, and EGFR mutations along with z-score transformed mRNA expression data as defined by Tsoi and colleagues (49). STCs were clustered based on their expression profiles. NC, neural crest.
Figure 2.
Figure 2.
EGFR expression is significantly elevated in NF1Mut melanoma. A, Volcano plot showing differentially expressed genes between 13 NF1Mut and 19 NF1WT melanoma STCs. Cancer-related genes that had overlapping increased RNA expression (RNA-seq), chromatin accessibility (ATAC-seq), and enhancer activity (H3K27Ac CUT&RUN) are highlighted in red. B, Venn diagram identifies genes upregulated in NF1Mut STCs, based on increased RNA expression (RNA-seq), chromatin accessibility (ATAC-seq), and enhancer activity (H3K27Ac CUT&RUN). C, KEGG pathway analysis of genes with increased expression, accessibility, and enhancer activity suggests increased EGFR, RAS, MAPK, PI3K-Akt, and ERBB signaling pathway activation in NF1Mut melanoma STCs. D, Representative RNA-seq, ATAC-seq, and H3K27Ac CUT&RUN sequencing tracks show increased EGFR expression in representative NF1Mut (red) compared with NF1WT (blue) STCs. E, EGFR staining in NF1Mut and NF1WT melanoma patients’ tissues. F, Box plots and data points showing EGFR expression scores of 20 NF1Mut and 20 NF1WT melanoma tissue sections from human patients. P values indicate a Mann–Whitney test. G, Western blots showing NF1, EGFR, pY1068-EGFR, AKT, and pS473-AKT expression in NF1Mut and NF1WT STCs. HSP90 served as a loading control. H, Bar graphs showing Western blot data normalized to HSP90 in 6 NF1Mut and 6 NF1WT STCs. Bars show mean values ± SD. P values are calculated using a two-sided t test. I, Confocal microscopy images showing EGFR expression (red) and nuclear chromatin (cyan) in NF1Mut and NF1WT STCs. J, Bar graphs show EGFR staining intensity relative to background control in 3 NF1Mut and 3 NF1WT STCs. Bars show mean values ± SD. P values are calculated using a two-sided t test. K–M, Kaplan–Meier curves showing overall (K), disease-free survival of patients with TCGA SKCM with high (n = 155) and low (n = 155) EGFR expression (L), and disease-free survival of NF1Mut patients with high (n = 13) and low (n = 13) EGFR expression (M). P values were calculated using a log-rank test. N, Dot plot showing log-transformed EGFR mRNA levels in metastatic melanoma comparing NF1Mut (n = 60) and NF1WT (n = 242). P values are calculated using a two-sided nonparametric t test.
Figure 3.
Figure 3.
NF1 loss induces EGFR, AKT, and ERK signaling in melanoma cells. A–F, Western blots showing pY1068-EGFR, EGFR, pS473-AKT, AKT, pERK, ERK, and HSP90 changes in NF1Mut and NF1WT STCs starved for 24 hours and then stimulated with 50 ng/mL EGF. HSP90 served as a loading control. G–I, Line graphs showing the relative intensity of pEGFR/EGFR, pAKT/AKT, and pERK/ERK after EGF stimulation in NF1Mut and NF1WT STCs. Data points indicate mean ± SEM (n = 3). P values represent a two-sided, independent t test by comparing the nonlinear fit of line regression. J, Western blots showing pY1068-EGFR, EGFR, pS473-AKT, AKT, pERK, ERK, and HSP90 changes in serum-starved NF1Mut and NF1WT STCs after 0- and 10-minute EGF stimulation. Mutations in BRAF or NRAS are shown in purple and yellow, respectively. K, Bar graphs showing Western blot data of pY1068-EGFR/EGFR, pS473-AKT/AKT, and pERK/ERK in six NF1Mut and six NF1WT STCs. Bars show mean values ± SD. P values were calculated by a two-sided t test.
Figure 4.
Figure 4.
EGFR knockdown inhibits NF1Mut melanoma cell growth and induces apoptosis independent of BRAF or NRAS mutation status. A, Bar graphs showing EGFR RT-PCR data in shSCR (control), shEGFR-1, and shEGFR-2 expressing STCs. Bars, mean ± SD (n = 3). P values were calculated with a two-tailed t test. B, Growth curves of melanoma STCs expressing shSCR (control), shEGFR-1, or shEGFR-2. Data points indicate mean ± SD (n = 9). P values were calculated with a two-tailed t test at the endpoint. C, Volcano plot showing differentially expressed genes in shEGFR compared with shSCR in the NF1Mut STC 07-127. Adjusted P value represents an FDR. FC, fold change. D, KEGG pathway analysis of differentially expressed genes between shEGFR- and shSCR-expressing STC 07-127 cultures. Adjusted P value represents Benjamini–Hochberg correction. E, Western blots showing changes in pY1068-EGFR, EGFR, and BIM in shSCR- and shEGFR-expressing NF1Mut STCs. HSP90 served as a loading control. F, Bar graphs indicating increased apoptosis after EGFR knockdown in NF1Mut STCs measured by ELISA. Bars, mean ± SD (n = 3). P values were calculated with a two-sided t test.
Figure 5.
Figure 5.
NF1 loss induces EGFR expression and sensitizes melanoma cells to EGFR inhibition. A and B, RT-PCR data showing NF1 (A) and EGFR (B) expression changes in shNF1-1 and shNF1-2 compared with shSCR-expressing melanoma cells. Bar graphs indicate mean ± SD (n = 3). P values were calculated using a two-sided t test. C, Growth curves of melanoma STCs expressing shNF1-1 or shNF1-2 compared with shSCR (control). P values were calculated using a two-sided t test at the experimental endpoint. Data points represent mean ± SD (n = 9). D, Western blots show changes in NF1, pY1068-EGFR, EGFR, pS473-AKT, AKT, pERK, and ERK. HSP90 served as a loading control. E, Epistasis experiment shows increased growth rates in shNF1-expressing melanoma cells and reduced growth rates in shNF1- and shEGFR-expressing SKmel28 melanoma cells. shEGFR knockdown was asymptomatic in these NF1WT SKmel28 cells. Data points represent mean ± SD (n = 9). P values were calculated with a two-sided t test at the endpoint. F and G, Dose–response data showing nonlinear fit kill curves and IC50 values for erlotinib-treated (F) and trametinib-treated (G) shSCR-, shNF1-1–, and shNF1-2–expressing SKmel28 cells. Data points represent mean ± SD (n = 3). P values were calculated with a two-sided t test of slopes.
Figure 6.
Figure 6.
Cetuximab inhibits NF1Mut melanoma growth in preclinical models. A, Schematic representation of the experimental approach to test the response of NF1Mut melanoma STCs to cetuximab. B and C, Growth curves of NF1Mut melanoma STC xenograft models treated with 20 mg/kg cetuximab or IgG (control). Data points represent mean ± SD, n = 20 (08-175), n = 19 (13-045). P values were calculated with a two-sided t test of the nonlinear fit of exponential growth. D–G, Representative images (D and E) and tumor mass data (F and G) of resected NF1Mut melanoma xenografts after cetuximab or IgG (control) treatment. Bar graphs indicate mean ± SD. P values were calculated with two-sided t tests. H–K, EGFR-stained (H and I) and pY1068-EGFR–stained (J and K) tissue sections of NF1Mut melanoma xenografts treated with cetuximab or IgG. Violin plots show IHC staining scores. P values were calculated with a two-sided t test. L, The volcano plot shows differentially expressed genes in cetuximab compared with IgG-treated NF1Mut melanoma STC xenografts. M, Gene set enrichment analysis pathway analysis of differentially expressed genes between cetuximab and IgG-treated NF1Mut melanoma xenografts. The adjusted P value represents the Benjamini–Hochberg correction. NES, normalized enrichment score. N, Western blots showing MKI67, pY1068-EGFR, EGFR, pS473-AKT, AKT, pERK, ERK, and cyclin D changes in cetuximab- and IgG-treated tumors resected from NF1Mut melanoma xenograft models. HSP90 served as the loading control. O, Bar graphs showing Western blot data of MKI67, pY1068-EGFR, EGFR, pS473-AKT, AKT, pERK, ERK, and cyclin D normalized to HSP90 in 10 IgG- and 10 cetuximab-treated NF1Mut xenografts. Bars show mean values ± SD. P values are calculated using a two-sided t test.
Figure 7.
Figure 7.
Second-generation EGFR inhibitor afatinib inhibits NF1Mut melanoma growth and induces apoptosis in preclinical models. A, Growth curves of NF1Mut melanoma STCs treated with 0.1, 0.5, 1, 5, or 10 μmol/L afatinib. Data points represent mean ± SD (n = 9). P values were calculated with a two-sided t test at the endpoint. B, Western blots show changes after NF1Mut melanoma STCs treatment with afatinib in pY1068-EGFR, EGFR, pS473-AKT, AKT, pERK, ERK, and cleaved PARP. HSP90 served as a loading control. C–E, Growth curves of NF1Mut melanoma STC xenograft models treated with 20 mg/kg afatinib or corn oil vehicle (control). Data points represent mean ± SD, n = 16 (STC 08-175), n = 17 (STC 13-045), n = 16 (MeWo). P values were calculated with a two-sided t test of the nonlinear fit of exponential growth. FK, Representative images (F, H, and J) and tumor mass data (G, I, and K) of resected NF1Mut melanoma xenografts after afatinib or vehicle (control) treatment. Bar graphs indicate mean ± SD. P values were calculated with two-sided t tests.

References

    1. Curti BD, Faries MB. Recent advances in the treatment of melanoma. N Engl J Med 2021;384:2229–40. - PubMed
    1. Akbani R, Akdemir K, Aksoy B, Albert M, Ally A, Amin S, et al. Genomic classification of cutaneous melanoma. Cell 2015;161:1681–96. - PMC - PubMed
    1. Luke JJ, Flaherty KT, Ribas A, Long GV. Targeted agents and immunotherapies: optimizing outcomes in melanoma. Nat Rev Clin Oncol 2017;14:463–82. - PubMed
    1. Jour G, Illa-Bochaca I, Ibrahim M, Donnelly D, Zhu K, Miera EV, et al. Genomic and transcriptomic analyses of NF1-mutant melanoma identify potential targeted approach for treatment. J Invest Dermatol 2023;143:444–55.e8. - PubMed
    1. Dummer R, Ascierto PA, Gogas HJ, Arance A, Mandala M, Liszkay G, et al. Encorafenib plus binimetinib versus vemurafenib or encorafenib in patients with BRAF-mutant melanoma (COLUMBUS): a multicentre, open-label, randomised phase 3 trial. Lancet Oncol 2018;19:603–15. - PubMed