. 2025 Jun 10;16(1):4798.
doi: 10.1038/s41467-025-59497-5.

Retinoic acid breakdown is required for proximodistal positional identity during axolotl limb regeneration

Affiliations

Retinoic acid breakdown is required for proximodistal positional identity during axolotl limb regeneration

Timothy J Duerr et al. Nat Commun. .

Abstract

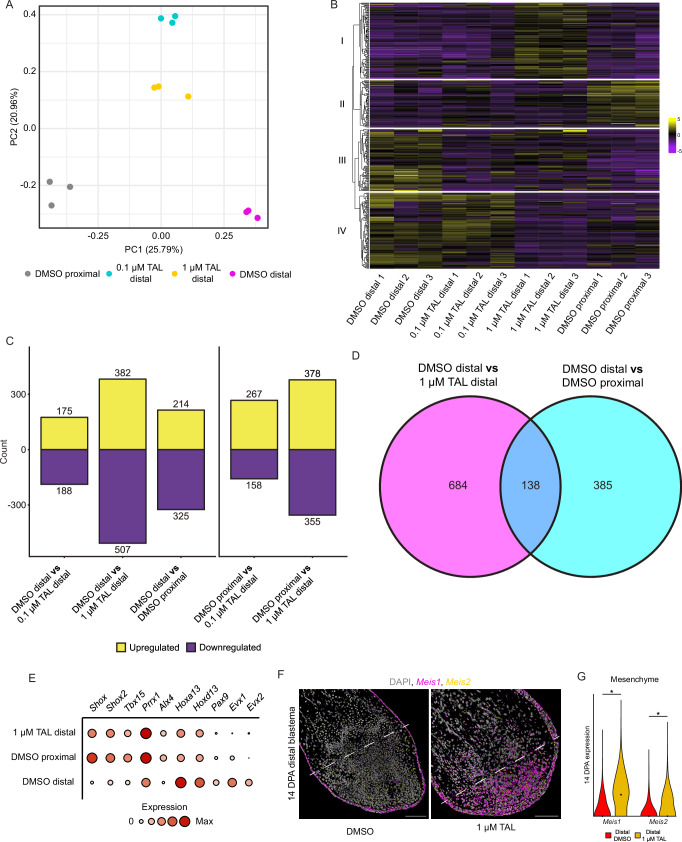
Regenerating limbs retain their proximodistal (PD) positional identity following amputation. This positional identity is genetically encoded by PD patterning genes that instruct blastema cells to regenerate the appropriate PD limb segment. Retinoic acid (RA) is known to specify proximal limb identity, but how RA signaling levels are established in the blastema is unknown. Here, we show that RA breakdown via CYP26B1 is essential for determining RA signaling levels within blastemas. CYP26B1 inhibition molecularly reprograms distal blastemas into a more proximal identity, phenocopying the effects of administering excess RA. We identify Shox as an RA-responsive gene that is differentially expressed between proximally and distally amputated limbs. Ablation of Shox results in shortened limbs with proximal skeletal elements that fail to initiate endochondral ossification. These results suggest that PD positional identity is determined by RA degradation and RA-responsive genes that regulate PD skeletal element formation during limb regeneration.


Conflict of interest statement

Competing interests: The authors declare no competing interests.

Figures

Fig. 1
Fig. 1. PD patterning genes are dynamically expressed during limb regeneration.
A Schematic of PD amputation plane qRT-PCR experiment. B, C qRT-PCR of Meis1 (B) and Meis2 (C) at different PD amputation locations (3.5 cm (HT) animals aged 2.5 months, 10 DPA). Expression normalized to Ef1a and analyzed by one-way ANOVA with Tukey-Kramer multiple comparisons. Boxplot top and bottom represent the 75th and 25th percentiles, the red line indicates median, and whisker ends show minima and maxima. R2 and p values from linear regression analysis are shown. * = p < 0.05. D HCR-FISH for Meis1 and Meis2 in PBs and DBs at 10 and 14 DPA. Dashed lines indicate amputation plane. Scale bars = 200 µm. E Quantification of mesenchymal Meis1 and Meis2 in PBs and DBs at 10 and 14 DPA (3.5 cm (HT) animals aged 2.5 months). Differences analyzed by two-tailed pairwise clustered Wilcoxon rank-sum tests. * = p < 0.05. F PD intensity plots for mesenchymal Meis1 and Meis2 in PBs and DBs at 10 and 14 DPA (3.5 cm (HT) animals aged 2.5 months). Shaded region represents 99% confidence interval. GI qRT-PCR of Hoxa9 (G), Hoxa11 (H), and Hoxa13 (I) at different PD amputation locations (3.5 cm (HT) animals aged 2.5 months, 10 DPA). Boxplot and analyses as in (B, C). * = p < 0.05, *** = p < 0.001. J HCR-FISH for Hoxa9, Hoxa11, and Hoxa13 in PBs and DBs at 10 and 14 DPA. Dashed lines indicate amputation plane. Scale bars = 200 µm. K Quantification for mesenchymal Hoxa9, Hoxa11, and Hoxa13 in PBs and DBs at 10 and 14 DPA (3.5 cm (HT) animals aged 2.5 months). Axes and analyses as in Fig. 1E. * = p < 0.05. L PD intensity plots for mesenchymal Hoxa9, Hoxa11, and Hoxa13 in PBs and DBs at 10 and 14 DPA (3.5 cm (HT) animals aged 2.5 months). Axes and analyses as in (F). Sample size and exact p-values are located within the source data file. Source data are provided as a source data file.
Fig. 2
Fig. 2. Cyp26b1 is differentially expressed in PBs and DBs and is related to Meis1, Hoxa11, and Hoxa13 expression.
A, B qRT-PCR of Cyp26a1 (A) and Cyp26b1 (B) at different PD amputation locations (3.5 cm (HT) animals aged 2.5 months, 10 DPA). Boxplot and analyses as in Fig. 1B, C. * = p < 0.05, *** = p < 0.001. C HCR-FISH for Cyp26a1 and Cyp26b1 in PBs and DBs at 10 and 14 DPA. Dashed lines indicate amputation plane. Scale bars = 200 µm. D Quantification for mesenchymal Cyp26a1 and Cyp26b1 in PBs and DBs at 10 and 14 DPA (3.5 cm (HT) animals aged 2.5 months). Axes and analyses as in Fig. 1E. * = p < 0.05. E PD intensity plots for mesenchymal Cyp26b1, Meis1, Hoxa11, and Hoxa13 in PBs and DBs at 10 and 14 DPA. Shaded region represents 99% confidence interval. Axes and analyses as in Fig. 1F. Sample size and exact p-values are located within the source data file. Source data are provided as a source data file.
Fig. 3
Fig. 3. CYP26 inhibition phenocopies exogenous RA during limb regeneration.
A Timeline of TAL experiments and tissue collection timepoints. B Brightfield images of regenerates and skeletal structures of PBs and DBs treated with DMSO or 0.1, 1, or 5 µM TAL. Dashed lines indicate amputation plane. Scale bar = 2 mm. C 10 DPA DBs from RA reporter animals treated with DMSO or 1 µM TAL (3 cm (HT) animals aged 2 months). Dashed lines indicate amputation plane. Scale bar = 500 µm. D qRT-PCR of Gfp in tissue from RA reporter animals. (3.5 cm (HT) animals aged 2.5 months, 10 DPA). Boxplot and analyses as in Fig. 1B, C. *** = p < 0.001. E HCR-FISH for Cyp26a1 and Cyp26b1 in DBs administered 1 µM TAL at 14 DPA (3.5 cm (HT) animals aged 2.5 months). Dashed line indicates amputation plane. AF = autofluorescence. Scale bar = 200 µm or 20 µm (inset). F Dot quantification for mesenchymal and epithelial Cyp26a1 and Cyp26b1 in DBs treated with DMSO or 1 µM TAL at 14 DPA (3.5 cm (HT) animals aged 2.5 months). Axes and analyses as in Fig. 1E. * = p < 0.05. G 14 DPA DBs from Hoxa13:mCHERRY reporter animals treated with DMSO or 1 µM TAL (7.5 cm (HT) animals aged 6 months). Dashed lines indicate amputation plane. Scale bar = 500 µm. Sample size and exact p-values are located within the source data file. Source data are provided as a source data file.
Fig. 4
Fig. 4. CYP26 inhibition reprograms DBs into a more PB-like identity.
A PCA of bulk transcriptomes from DBs treated with DMSO, 0.1, or 1 µM TAL and PBs treated with DMSO. B Heatmap of the top 371 (padj <0.01, FC = 1.5) genes expressed in each sample type. Cluster numbers are next to the dendrogram. C Bar graphs of significantly upregulated and downregulated genes (padj <0.1) within each comparison. D Venn diagram of overlapping DEGs (padj <0.1) from DMSO treated DBs vs DMSO treated PBs and DMSO treated DBs vs 1 µM TAL treated DBs. Full gene lists are located in the source data file. E Selected shared DEGs from (D). F HCR-FISH for Meis1 and Meis2 in DBs administered DMSO or 1 µM TAL at 14 DPA. Dashed line indicates amputation plane. Scale bars = 200 µm. G Dot quantification for mesenchymal Meis1 and Meis2 in DBs treated with DMSO or 1 µM TAL at 14 DPA (3.5 cm (HT) animals aged 2.5 months). Axes and analyses as in Fig. 1E. * = p < 0.05. Sample size and exact p-values are located within the source data file. Source data are provided as a source data file.
Fig. 5
Fig. 5. Shox and Shox2 mark proximal and posterior positional identity.
A Whole mount HCR-FISH for Shox, Shox2, and Hoxa13 in stage 44-47 developing limb buds. The images represent a single, 2D z-plane within a 3D image stack. Scale bars = 50 µm. B, C qRT-PCR of Shox and Shox2 in DMSO or 1 µM TAL treated DBs (3.5 cm (HT) animals aged 2.5 months, 10 DPA). Each gene was normalized to Ef1a and the groups were analyzed using a two-tailed t-test. Boxplot as in Fig. 1B, C. * = p < 0.05. D, E qRT-PCR of Shox (D) and Shox2 (E) at different PD amputation locations (3.5 cm (HT) animals aged 2.5 months, 10 DPA). Boxplot and analyses as in Fig. 1B, C. * = p < 0.05, *** = p < 0.001. F HCR-FISH for Shox and Shox2 in PBs and DBs at 10 and 14 DPA. Dashed lines indicate amputation plane. Scale bars = 200 µm. G Dot quantification for mesenchymal Shox and Shox2 in PBs and DBs at 10 and 14 DPA (3.5 cm (HT) animals aged 2.5 months). Axes and analyses as in Fig. 1E. * = p < 0.05, ** = p < 0.01. H PD intensity plots for mesenchymal Shox, Shox2, Meis1, and Hoxa13 in PBs and DBs at 10 and 14 DPA. Shaded region represents 99% confidence interval. Axes and analyses as in Fig. 1F. I, J HCR-FISH for Meis1, Shox2, and Shox (I) or Shox, Shox2, and Hoxa13 (J) in a PB at 14 DPA. Dashed line indicates amputation plane. Scale bars = 200 µm. K UMAP of Shox+ and Hoxa13+ cells in blastemas at 7, 14, and 22 DPA from reanalyzed scRNA-seq dataset. Sample size and exact p-values are located within the source data file. Source data are provided as a source data file.
Fig. 6
Fig. 6. Shox crispants show defects in endochondral ossification of proximal limb skeletal elements.
A Schematic of the Shox genomic landscape. Introns reduced 50X for visibility. Scale bar = 100 bp. B Brightfield images of control and Shox crispant limbs (3.5 cm (HT) animals aged 2.5 months). Scale bar = 1 mm. C Skeletal element quantification in control and Shox crispant limbs (7.5 cm (HT) animals aged 6 months). Differences between control and Shox crispants were analyzed using a two-tailed t-test. Boxplot as in Fig. 1B, C. n.s. = no statistical difference, ** = p < 0.01, *** = p < 0.001. D Alcian blue and alizarin red stain of adult control and Shox crispant limbs (12 cm (HT) animals aged 10 months). Scale bar = 2 mm. E H&E&A of whole stylopods, proximal epiphyses, and digits from controls and Shox crispants (8 cm (HT) animals aged 7 months). RZ = resting zone, PZ = proliferative zone. Stylopod scale bar = 1 mm. Digit scale bar = 0.5 mm. F HCR-FISH for Shox and Sox9 in a whole mount stage 46 developing limb. Scale bar = 50 µm. Sample size and exact p-values are located within the source data file. Source data are provided as a source data file.
Fig. 7
Fig. 7. Shox is dispensable for limb regeneration but required for PD patterning.
A Regeneration time course of PBs and DBs in Shox crispants. Scale bar = 1 mm. B UMAP of Shox+ and Sox9+ cells in blastemas at 7, 14, and 22 DPA from reanalyzed scRNA-seq dataset. C HCR-FISH for Shox and Sox9 in a control PB and DB at 21 DPA. Dashed line indicates amputation plane. Scale bars = 200 µm. D HCR-FISH for Meis1, Shox2, and Hoxa13 in control and Shox−/− PBs and DBs at 14 DPA. Dashed lines indicate amputation plane. Scale bars = 200 µm. EH qRT-PCR of Meis1 (E), Hoxa13 (F), Shox2 (G), and Cyp26b1 (H) in control and Shox−/− PBs and DBs (2.5 cm or 3.2 cm (HT, Shox−/− and controls, respectively) animals aged 2.5 months, 14 DPA). Boxplots and analyses as in Fig. 1B, C. * = p < 0.05, ** = p < 0.01, *** = p < 0.001. I Brightfield images of regenerates and skeletal structures of control or Shox crispant limbs treated with 1 µm TAL. Dashed lines indicate amputation plane. Scale bar = 2 mm. Sample size and exact p-values are located within the source data file. Source data are provided as a source data file.
Fig. 8
Fig. 8. Model for PD patterning during limb regeneration.
Proposed model for how PD patterning occurs during axolotl limb regeneration.

Update of

References

    1. Currie, J. D. et al. Live imaging of axolotl digit regeneration reveals spatiotemporal choreography of diverse connective tissue progenitor pools. Dev. Cell39, 411–423 (2016). - PMC - PubMed
    1. Gerber, T. et al. Single-cell analysis uncovers convergence of cell identities during axolotl limb regeneration. Science362, eaaq0681 (2018). - PMC - PubMed
    1. Kragl, M. et al. Cells keep a memory of their tissue origin during axolotl limb regeneration. Nature460, 60–65 (2009). - PubMed
    1. Nacu, E. et al. Connective tissue cells, but not muscle cells, are involved in establishing the proximo-distal outcome of limb regeneration in the axolotl. Development140, 513 (2013). - PubMed
    1. Wolpert, L. Positional information and the spatial pattern of cellular differentiation. J. Theor. Biol.25, 1–47 (1969). - PubMed

MeSH terms

LinkOut - more resources