. 2025 Aug;17(8):2011-2039.
doi: 10.1038/s44321-025-00261-z. Epub 2025 Jun 10.

Ki-67 promotes inflammatory signaling governing neutrophil recruitment during respiratory infections

Affiliations

Ki-67 promotes inflammatory signaling governing neutrophil recruitment during respiratory infections

Min Yee et al. EMBO Mol Med. 2025 Aug.

Abstract

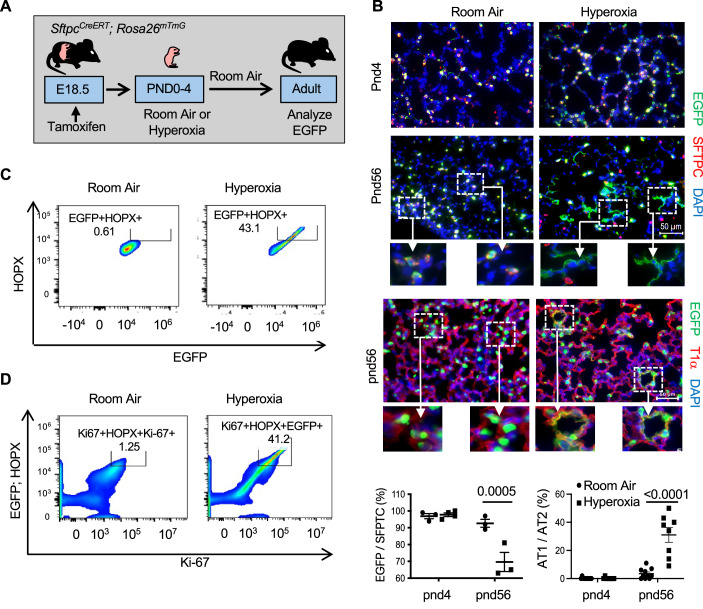
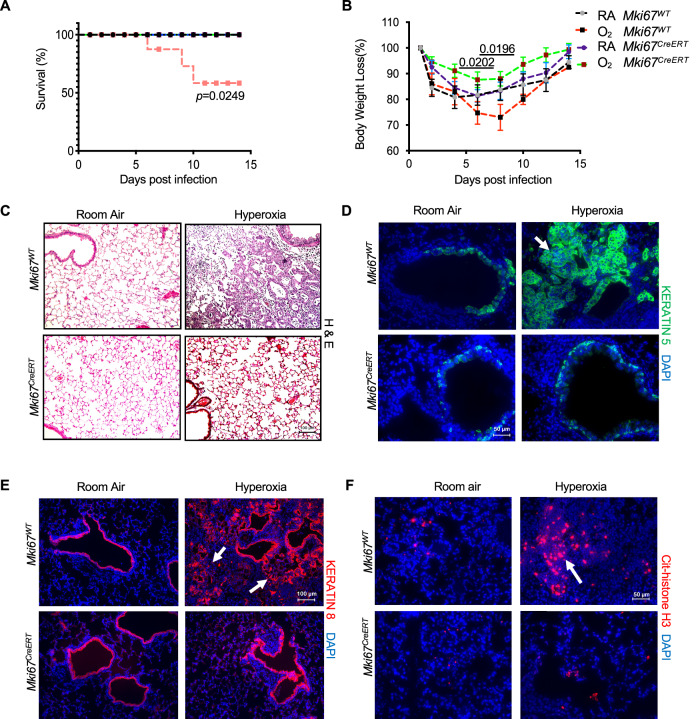
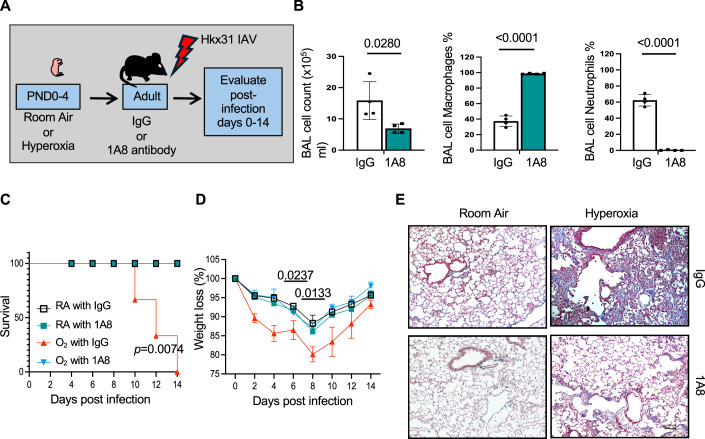
Neutrophils defend against respiratory infections but cause acute lung injury (ALI) when excessively recruited to the lung. Early life environmental factors can shape lung development, but how they impact neutrophil recruitment is not known. We show that exposing newborn mice to hyperoxia increases the number of adult alveolar type 1 (AT1) epithelial cells expressing the proliferation marker Ki-67. Although these cells were not proliferating, they expressed high levels of chemokines that stimulated neutrophil recruitment and ALI when mice were infected with influenza A virus or exposed to lipopolysaccharide (LPS). Neutrophil recruitment and chemokine production were attenuated in Ki-67 hypomorph mice infected with virus or exposed to LPS and enhanced by genetically overexpressing Ki-67 in their lungs. Silencing Ki-67 in a mouse AT1-like cell line reduced basal and IL-1β stimulation of RelA/p65 and NF-κB-dependent transcription of the chemokines Cxcl1 and Cxcl5. Our findings reveal a novel role for Ki-67 to modulate the intensity of epithelial pro-inflammatory signaling, controlling neutrophil recruitment. The severity of respiratory infections may be influenced by mitogens and environmental factors that increase the expression of Ki-67.

Keywords: Acute Lung Injury; Alveolar Epithelial Cells; Influenza A Virus; Mice; Susceptibility.


Conflict of interest statement

Disclosure and competing interests statement. The authors declare no competing interests.

Figures

Figure 1
Figure 1. Neonatal hyperoxia increases expression of Ki-67 in adult AT1 cells.
(A) Cartoon of the experimental model. (B) Lungs of adult mice exposed to room air or hyperoxia as neonates were immunostained for Ki-67 (red), T1α (green), and counterstained with DAPI (blue). Arrows point to Ki-67+ cells. The proportion of Ki-67+ cells to DAPI+ nuclei were quantified and graphed. n = 10 mice per group. (Room air vs Hyperoxia: P < 0.0001). (C) Flow cytometric plots of Ki-67+ cells detected in disassociated lungs of adult mice exposed to room air or hyperoxia compared to FMO control. The proportion of Ki-67+ cells in 10,000 cells was quantified and graphed. n = 3 mice per group. (Room air vs Hyperoxia: P = 0.00135). (D) Flow cytometric plots of Ki-67+ and HOPX+ cells detected in lungs of adult mice exposed to room air or hyperoxia as neonates. The percentage of double-positive cells in 10,000 cells is shown in the embedded box. (E) Lungs of adult Aqp5Cre; Rosa26mTmG mice exposed to room air or hyperoxia as neonates were immunostained for EGFP (green) and T1α (red) or EGFP (green) and Ki-67 (red) with DAPI (blue) counterstaining. FACS plots of Ki-67+ and EGFP+ cells from Aqp5Cre; Rosa26mTmG exposed to room air or hyperoxia as neonates. (F) Lungs of adult mice exposed to room air or hyperoxia as neonates were immunostained for Ki-67 (red), BrdU (green), and counterstained with DAPI. Arrows point to BrdU+ cells. The proportion of BrdU+ cells to DAPI+ nuclei was graphed. n = 9 mice per group. NS not significant. Data in (B, C, F) are graphed as mean ± standard deviation with individual values shown as circles or squares. Scale bar in (B) = 30 μm and (E, F) = 50 μm. Data reflect biological replicates analyzed by Student’s t test in (B, C, F). Source data are available online for this figure.
Figure 2
Figure 2. Neonatal hyperoxia stimulates differentiation of AT2 to AT1 cells that express Ki-67.
(A) Cartoon showing the experimental model of exposing mice to hyperoxia and returning to room air. (B) Lungs of PND4 and adult SftpcCreERT; Rosa26mTmG mice exposed to room air or hyperoxia as neonates were immunostained for EGFP (green), SFTPC (red) or T1α (red), and counterstained with DAPI (blue). Hatched inset boxes are enlarged below individual images. The proportion of EGFP+ and SFTPC+ cells was quantified and graphed. n = 3 (RA PND4), 5 (O2 PND4), 3 (RA PND56), and 3 (O2 PND56). (Room Air vs Hyperoxia at PND56: P = 0.0005). The proportion of squamous EGFP+ to cuboidal EGFP+ staining was quantified and graphed. n = 10 (RA PND4), 10 (O2 PND4), 8 (RA PND56), and 8 (O2 PND56). (Room air vs Hyperoxia at PND56: P < 0.0001). (C) FACs analysis of EGFP+ and HOPX+ cells isolated from lungs of adult SftpcCreERT; Rosa26mTmG mice exposed to room air or hyperoxia as neonates. (D) FACS analysis of Ki-67+ cells that also express EGFP and HOPX. Data in (B) are graphed as mean ± standard deviation with individual samples shown as circles and squares. Scale bar in (B) = 50 μm and in (C) = 200 μm. Data reflect biological replicates analyzed by one-way ANOVA using Tukey-Kramer HSD in (B). Source data are available online for this figure.
Figure 3
Figure 3. Mki67CreERT mice are Ki-67 hypomorphs in the lung.
(A) Cartoon showing the experimental plan of exposing Mki67CreERT; Rosa26mTmG to room air or hyperoxia as neonates, followed by tamoxifen as adults. (B) Lungs, trachea, and intestine from adult Mki67CreERT; Rosa26mTmG administered tamoxifen were stained for EGFP (green), Ki-67 (red), and DAPI (blue). (C) Lungs of adult Mki67WT, Mki67WT/CreERT, or Mki67CreERT mice exposed to room air or hyperoxia as neonates were stained for Ki-67 (red) and DAPI (blue). The proportion of Ki-67+ cells were quantified and graphed. n = 10 mice per group. (Mki67WT: Room air vs Hyperoxia: P < 0.0001; Mki67WT/CreERT: Room air vs Hyperoxia: P = 0.0010; Mki67CreERT: Room air vs Hyperoxia: NS=not significant). (D) FACS plot of Ki-67+ cells detected in lungs of adult Mki67WT exposed to room air or hyperoxia for comparison against Mki67CreERT exposed to hyperoxia and FMO control after normalizing to NODE. (E) Expression of Ki-67 mRNA was determined in lungs of adult Mki67WT and Mki67CreERT mice exposed to room air or hyperoxia as neonates, normalized to 18S RNA, and graphed relative to Mki67WT in room air. n = 4 mice per group. (Mki67WT Room air vs Mki67WT Hyperoxia: P = 0.0034; Mki67WT Hyperoxia vs Mki67CreERT Room air: P < 0.0001; Mki67WT Hyperoxia vs Mki67CreERT Hyperoxia: P < 0.0001). Data in (C, E) are graphed as mean ± standard deviation with individual samples shown as triangles, circles, or squares. Scale bar in (B) = 50 μm. Data reflect biological replicates analyzed by one-way ANOVA using Tukey-Kramer HSD in (C, E). Source data are available online for this figure.
Figure 4
Figure 4. Neonatal hyperoxia increases the severity of IAV infections in Mki67WT but not Mki67CreERT hypomorph mice.
Adult Mki67WT and Mki67CreERT exposed to room air or hyperoxia as neonates were infected with Hkx31 strain of IAV. (A) Neonatal hyperoxia significantly reduced the survival of infected Mki67WT mice but not Mki67CreERT mice. n = 10 per group. (B) Neonatal hyperoxia significantly increased weight loss of infected Mki67WT mice but not Mki67CreERT hypomorph mice. n = 10 mice per group. (Day 6: O2 Mki67CreERT vs RA Mki67WT: P = 0.0202; Day 8: O2 Mki67CreERT vs RA Mki67WT: P = 0.0.0196). (CF) Lungs harvested on post-infection day 14 were stained with (C) Hematoxylin and Eosin to visualize pathology, (D) keratin 5 used to detect basal cells, (E) keratin 8 used to detect alveolar epithelial transitional cells, and (F) citrullinated histone H3 used to identify NETotic neutrophils. Arrows in (DF) point respectively to keratin 5+ pods, keratin 8+ transitional cells, and citrullinated H3+ neutrophils. Data in (B) is graphed as mean weight loss after infection ± standard error of the mean. Scale bar in (C, E) = 50 μm and in (D, F) = 100 μm. Data reflects biological replicates analyzed by Log-Rank (Mantel–Cox) test in (A) and Student’s t test comparing individual post-infection days (B). Source data are available online for this figure.
Figure 5
Figure 5. Neonatal hyperoxia enhances the recruitment of neutrophils in the lungs of infected Mki67WT but not Mki67CreERT hypomorph mice.
Bronchoalveolar lavage washes were performed on adult Mki67WT and Mki67CreERT exposed to room air or hyperoxia before and after infection with Hkx31 IAV. (A) The total number of leukocytes, (B) the proportion of macrophages, (C) the proportion of neutrophils, and (D) the proportion of lymphocytes were quantified and graphed n = 5 mice per group. (A: D1: RA Mki67WT vs O2 Mki67WT: P = 0.0252; O2 Mki67WT vs Mki67CreERT: P = 0.0453; D3: RA Mki67WT vs O2 Mki67WT: P = 0.0001; O2 Mki67WT vs Mki67CreERT: P < 0.0001; d7: RA Mki67WT vs O2 Mki67WT: P = 0.0211; O2 Mki67WT vs Mki67CreERT: P = 0.0197). (B: D1: RA Mki67WT vs O2 Mki67WT: P < 0.0001; O2 Mki67WT vs Mki67CreERT: P < 0.0001; D3: RA Mki67WT vs O2 Mki67WT: P = 0.024; O2 Mki67WT vs Mki67CreERT: P = 0.0001; d5: RA Mki67WT vs O2 Mki67WT: P < 0.0001; O2 Mki67WT vs Mki67CreERT: P < 0.0001). (C: D1: RA Mki67WT vs O2 Mki67WT: P < 0.0001; O2 Mki67WT vs Mki67CreERT: P < 0.0001; D3: RA Mki67WT vs O2 Mki67WT: P < 0.0001, O2 Mki67WT vs Mki67CreERT: P < 0.0001; d5: RA Mki67WT vs O2 Mki67WT: P = 0.0100; O2 Mki67WT vs Mki67CreERT: P = 0.0013; D7: O2 Mki67WT vs Mki67CreERT: P = 0.0015). (E) Representative images of cytospins collected from mice on post-infection day 1. Arrows point to neutrophils in lavage collected from infected Mki67WT mice exposed to hyperoxia Data in (AD) is graphed as mean ± standard deviation with individual mice shown in circles or squares. Scale bar in (E) = 50 μm. Data reflect biological replicates analyzed by one-way ANOVA using Tukey-Kramer HSD in (AD). Source data are available online for this figure.
Figure 6
Figure 6. Neonatal hyperoxia increase expression of CXCL chemokines in infected Mki67WT but not Mki67CreERT hypomorph mice.
Adult Mki67WT and Mki67CreERT exposed to room air or hyperoxia as neonates were infected with Hkx31 IAV. (AF) The expression of Cxcl1, Cxlc2, Cxcl4, Cxcl5, TNF-α, and IL-1β in lungs one day after infection was measured by qRT-PCR and graphed. n = 3 mice per group (Cxcl1: RA Mki67WT vs O2 Mki67WT: P = 0.0341; O2 Mki67WT vs RA Mki67CreERT: P = 0.0341; O2 Mki67WT vs O2 Mki67CreERT: P = 0.0399). (Cxcl2: RA Mki67WT vs O2 Mki67WT: P = 0.0170; O2 Mki67WT vs RA Mki67CreERT: P = 0.0250; O2 Mki67WT vs O2 Mki67CreERT: P = 0.0280). (Cxcl5: RA Mki67WT vs O2 Mki67WT: P = 0.0045; O2 Mki67WT vs RA Mki67CreERT: P = 0.0055; O2 Mki67WT vs O2 Mki67CreERT: P = 0.0052). (TNF-α: RA Mki67WT vs O2 Mki67WT: P = 0.0028; O2 Mki67WT vs RA Mki67CreERT: P = 0.0024; O2 Mki67WT vs O2 Mki67CreERT: P = 0.0025). (IL-1β: RA Mki67WT vs O2 Mki67WT: P = 0.0187; O2 Mki67WT vs RA Mki67CreERT: P = 0.0168; O2 Mki67WT vs O2 Mki67CreERT: P = 0.0184). (G) Lungs of infected Mki67WT mice exposed to room air or hyperoxia were immunostained for CXCL5 (red), T1α (green) and counterstained with DAPI (blue). Data in (AF) is graphed as mean ± standard deviation with individual mice shown as circles or squares. Scale bar in (G) = 50 μm. Data reflect biological replicates analyzed by one-way ANOVA using Tukey-Kramer HSD (AF). Source data are available online for this figure.
Figure 7
Figure 7. Gene delivery of Ki-67 cDNA enhances neutrophil recruitment in Mki67WT and Mki67CreERT mice infected with Hkx31 IAV.
(A) Cartoon showing the experimental plan for delivering pcDNA or pcDNA-Ki-67 expression plasmid using electroporation to lungs of adult Mki67WT and Mki67CreERT mice via electroporation. (B) Lungs were collected 48 h after gene delivery and immunostained for Ki-67 (red) and counterstained with DAPI (blue). (C) Bronchoalveolar lavages were performed 24 h after gene-delivered Mki67WT and Mki67CreERT mice were infected with Hkx31. The total number of leukocytes, the proportion of macrophages, the proportion of neutrophils, and the proportion of lymphocytes were quantified and graphed. n = 5 Mki67WT with pcDNA or pcDNA-Ki-67, 7 Mki67CreERT with pcDNA, and 6 Mki67CreERT with pcDNA-Ki-67. (BAL Cells: Mki67WT with pcDNA vs Mki67CreERT with pcDNA-Ki-67: P = 0.0005; Mki67WT with pcDNA-Ki-67 vs Mki67CreERT with pcDNA: P = 0.0288; Mki67CreERT with pcDNA vs Mki67CreERT with pcDNA-Ki-67: P < 0.0001). (BAL macrophages: Mki67WT with pcDNA vs Mki67WT with pcDNA-Ki-67: P < 0.0001; Mki67WT with pcDNA vs Mki67CreERT with pcDNA: P < 0.0001; Mki67WT with pcDNA vs Mki67CreERT with pcDNA-Ki-67: P < 0.0001; Mki67CreERT with pcDNA vs Mki67CreERT with pcDNA-Ki-67: P < 0.0001). (BAL neutrophils: Mki67WT with pcDNA vs Mki67WT with pcDNA-Ki-67: P < 0.0001; Mki67WT with pcDNA vs Mki67CreERT with pcDNA: P < 0.0001; Mki67WT with pcDNA vs Mki67CreERT with pcDNA-Ki-67: P < 0.0001; Mki67CreERT with pcDNA vs Mki67CreERT with pcDNA-Ki-67: P < 0.0001). (BAL lymphocytes: NS = not significant). (D) Representative cytospin images. (E) qRT-PCR was used to assess expression of Cxcl1, Cxlc2, Cxcl4, Cxcl5, TNF-α, and IL-1β in lungs one day gene-delivered Mki67WT and Mki67CreERT mice were infected with Hkx31. mRNA expression was graphed as fold change relative to infected Mki67WT mice transduced with control pcDNA plasmid. n = 4 mice per group. (Cxcl1, Cxcl2, Cxcl5, TNF-α, IL-1β: Mki67WT with pcDNA vs Mki67WT with pcDNA-Ki-67: P < 0.0001; Mki67CreERT with pcDNA vs Mki67CreERT with pcDNA-Ki-67: P < 0.0001; Cxcl5: NS = not significant). Data in (C, E) are graphed as mean ± standard deviation with individual mice shown as circles or squares. Scale bar in (B) = 100 μm and (D) = 50 μm. Data reflect biological replicates analyzed by one-way ANOVA using Tukey-Kramer HSD (C, E). Source data are available online for this figure.
Figure 8
Figure 8. Depleting neutrophils prevents acute lung injury in infected mice exposed to neonatal hyperoxia.
(A) Cartoon showing the experimental plan for administering IgG or 1A8 antibody to adult mice exposed to room air or hyperoxia as neonates followed by infection with Hkx31 IAV. Bronchoalveolar lavage washes were performed on adult mice administered IgG or 1A8 and infected with IAV for one day. (B) The total number of leukocytes, the proportion of macrophages, and the proportion of neutrophils were quantified in room air mice on post-infection day 3 and graphed. n = 4 mice per group. (BAL cells: IgG vs 1A8: P = 0.0280; BAL macrophages: IgG vs 1A8: P < 0.0001; BAL neutrophils: IgG vs 1A8: P < 0.0001). (C) 1A8 antibody significantly improved the survival of infected mice exposed to hyperoxia as neonates. n = 8 mice per group. (O2 with IgG vs RA with IgG, RA with IA8, or O2 with IA8; P = 0.0074). (D) 1A8 antibody significantly reduced weight loss in infected mice exposed to neonatal hyperoxia. n = 8 mice per group. Average weight loss ± standard error of the mean relative to uninfected mice. (Day 6: O2 IgG vs O2 1A8: p = 0.0237; Day 8: O2 IgG vs O2 1A8: P = 0.0133). (E) Trichrome staining of post-infected day 14 lungs obtained from mice administered IgG or 1A8. Data in (B) graphed as mean ± standard deviation with individual mice shown as circles or squares. Scale bar in (E) = 100 μm. Data reflects biological replicates analyzed by one-way ANOVA using Tukey-Kramer HSD (B), Log-Rank (Mantel–Cox) test in (C), and Student’s t test comparing individual post-infection days (D). Source data are available online for this figure.
Figure 9
Figure 9. Mki67CreERT hypomorphs are tolerant to pathogenic PR8 IAV infections.
(A) Cartoon model showing the experimental plan for infecting Mki67WT, Mki67WT/CreERT, and Mki67CreERT with a lethal dose of PR8 IAV. (B) Survival of Mki67WT, Mki67WT/CreERT, and Mki67CreERT mice infected with IAV. n = 8 mice per group. (Mki67CreERT vs Mki67WT/CreERT vs Mki67WT: P = 0.0283). (C) Weight loss in Mki67WT, Mki67WT/CreERT, and Mki67CreERT mice infected with IAV. n = 8 mice per group. (Day 6: Mki67CreERT vs Mki67WT: P = 0.0047; Day 8: Mki67CreERT vs Mki67WT: P = 0.0106). (D) Inflammatory cell number and the percentage of macrophages and neutrophils were determined in BAL washes from Mki67WT, Mki67WT/CreERT, and Mki67CreERT mice on post-infection day 3. n = 5 mice per group. (BAL cells: Mki67WT vs Mki67WT/CreERT: P = 0.0209; Mki67WT vs Mki67CreERT: P = 0.0401; Mki67WT/CreERT vs Mki67CreERT: P = 0.0004). (BAL macrophages: Mki67WT vs Mki67WT/CreERT: P = 0.0012; Mki67WT vs Mki67CreERT: P = 0.0006). (BAL neutrophil: Mki67WT vs Mki67WT/CreERT: P = 0.0015; Mki67WT vs Mki67CreERT: P < 0.0001). (E) Representative cytospin images of BAL leukocytes collected from Mki67WT, Mki67WT/CreERT, and Mki67CreERT mice on post-infection day 3. (F) Lung pathology of Mki67WT, Mki67WT/CreERT, and Mki67CreERT mice on post-infection day on post-infection day 14. (G) Keratin 5 and keratin 8 staining in lungs of Mki67WT, Mki67WT/CreERT, and Mki67CreERT mice on post-infection day 14. Data in (C) graphed a mean ± standard error of the mean and data in (D) graphed as mean ± standard deviation. Scale bar in (EG) = 100 μm. Data reflect biological replicates analyzed by Log-Rank (Mantel–Cox) test in (B), Student’s t test comparing individual post-infection days (C), and one-way ANOVA using Tukey-Kramer HSD in (D). Source data are available online for this figure.
Figure 10
Figure 10. Ki-67 enhances RelA-dependent transcription of Cxcl genes in mouse AT1.1 epithelial cells.
(A) AT1.1 cells transfected with Ki-67 siRNA for 48 h were fixed and stained for Ki-67 (magenta) and counterstained with DAPI (blue). Scale bar = 50 μm. (B) AT1.1 cells were transfected with Ki-67 siRNA or control oligonucleotides. The equal number of cells were plated on day 0 and counted 24 and 48 h later. Data is graphed as a mean number of cells ± standard deviation. n = 3 cultures per group. (C) AT1.1 cells were transfected with Ki-67 or a scrambled control for 48 h. The cells were then transfected with NF-κB-luciferase reporter and cultured for an additional 24 h in control media or media containing 0.5 ng/ml IL-1β. Luciferase activity was then graphed as mean fold change ± standard deviation relative to control cells cultured in the absence of IL-1β. n = 6 cultures per group. (IL-1β vs control: P = 0.0003; IL-1β vs IL-1β and siKi67: P < 0.0001). (D) AT1.1 cells were transfected with Ki-67 siRNA or scrambled controls for 48 h and then cultured for 24 h in 0.5 ng/ml IL-1β or control media. QRT-PCR was used to detect expression of Ki-67, RelA, Cxcl1, Cxcl5, and IL-6. Data are graphed as mean fold change  ± standard deviation compared to control cells. n = 6 for assessing siKi67 on Ki-67, RelA, Cxcl1, and Cxlc5 expression and n = 4 for all other measurements. (Ki-67, RelA, Cxcl1, Cxcl5, and IL-6: Control vs siKi67 cells: P < 0.0001; SiKi67 vs IL-1β cells: P < 0.0001; IL-1β vs IL-1β and siKi67 cells: P < 0.0001). (RelA: Control vs siRelA cells: P < 0.002; Control vs IL-1β cells: P = 0.0003; siRelA vs Il-1β cells: P < 0.0001; Il-1β vs siRelA and IL-1β: P < 0.0001). (Cxcl1: Control vs siRelA cells: P < 0.0052; Control vs IL-1β cells: P = 0.0127; siRelA vs Il-1β cells: P < 0.0001; Il-1β vs siRelA and IL-1β: P < 0.0001). (Cxcl5: Control vs IL-1β cells: P = 0.0072; siRelA vs Il-1β cells: P = 0.0020; Il-1β vs siRelA and IL-1β: P = 0.0051). (IL-6: Control vs siRelA cells: P = 0.0290; Control vs IL-1β cells: P < 0.0001; siRelA vs Il-1β cells: P < 0.0001; Il-1β vs siRelA and IL-1β: P < 0.0001). Data in (BD) graphed as mean ± standard deviation. Data reflect biological replicates analyzed by one-way ANOVA using Tukey-Kramer HSD (BD). Source data are available online for this figure.
Figure EV1
Figure EV1. Identification of alveolar cells expressing Ki-67.
(A) Lungs of adult mice exposed to room air or hyperoxia as neonates were disassociated and stained for Ki-67 and VE-cadherin (CD144), PECAM (CD31) or CD45. (A) FACS plots show hyperoxia does not increase Ki-67 in CD144+ or CD31+ endothelial cells. n = 5 mice per plot. (B) FACS plots showing Ki-67 was not detected in CD45+ leukocytes. n = 5 mice per plot. (C) Lungs of adult SftpcEGFP mice exposed to room air or hyperoxia as neonates were immunostained for Ki-67 (red), EGFP (green), and counterstained with DAPI (blue). Arrow points to rare EGFP+ AT2 cell expressing Ki-67. The proportion of EGFP+ AT2 cells that also express Ki-67 were quantified and graphs as mean ± standard deviation. n = 10 mice per group. (Room air vs Hyperoxia: Not significant (NS)). (D) Lungs of adult SftpcEGFP mice exposed to room air or hyperoxia were stained for phospho-histone H3 (Ser10) (red), EGFP (green), and counterstained with DAPI (blue). Arrow points to a phospho-histone H3 (Ser10)+ cell that was rarely detected in mice exposed to room air or hyperoxia. Note that the phospho-histone H3 (Ser10) staining could not be done on the same tissues stained for Ki-67 because both antibodies were made in the same species. The proportion of pHH3+ to EGFP+ cells were quantified and graphed as mean ± standard deviation. n = 4 mice per group. (Room air vs Hyperoxia: NS= not significant). Scale bar in (C, D) = 50 μm. Data reflects biological replicates analyzed by Student’s t test (C, D).
Figure EV2
Figure EV2. Ki-67 is not required for neonatal hyperoxia to disrupt alveolar development.
(A) H&E stains of lungs from adult Mki67WT and Mki67CreERT hypomorph mice exposed to room air or hyperoxia. (B) Mean linear intercept of alveolar size in μm was measured in lungs of adult Mki67WT and Mki67CreERT hypomorph mice exposed to room air or hyperoxia and graphed as mean ± standard deviation. n = 10 mice per group. (RA-Mki76WT vs O2 Mki67WT: P = 0.0005; RA Mki67CreERT vs O2-Mki67CreERT; P < 0.0001). (C) Lungs from adult Mki67WT and Mki67CreERT hypomorph mice exposed to room air or hyperoxia were stained for SFTPC (red) and counterstained with DAPI (blue). (D) The proportion of SP-C+ to DAPI+ alveolar cells were quantified and graphed as mean ± standard deviation. n = 9 mice per group or 8 for Mki67WT mice exposed to room air.(RA Mki67WT vs O2 Mki67WT: P < 0.0001; RA Mki67CreERT vs O2-Mki67CreERT; P = 0.0007). Data in (B, D) are graphed as mean ± SD with individual samples shown as circles or squares. Scale bar in (A, C) = 50 μm. Data reflect biological replicates analyzed by one-way ANOVA using Tukey-Kramer HSD (B, D).
Figure EV3
Figure EV3. Neonatal hyperoxia enhances AT1 apoptosis and NETosis in lungs of infected Mki67WT but not Mki67CreERT hypomorphs.
Adult Mki67WT and Mki67CreERT mice exposed to room air or hyperoxia were infected with Hkx31 IAV. (A) Lung sections collected on post-infection day 5 were stained with a TUNEL assay (green) used to detect DNA strand breaks and counterstained with DAPI (blue). (B) Adult Mki67WT exposed to room air or hyperoxia were infected with Hkx31 IAV. Lung sections collected on post-infection day 5 were stained for TUNEL (red), antibody to T1α (green) used to detect AT1 cells, and counterstained with DAPI. Arrows point to patches of TUNEL+ cells with pseudo-yellow color in (B) reflecting TUNEL and T1α double-positive cells indicative of AT1 cell death. Images are representative of 10 mice per group with similar pathology. Scale bar in (A) = 100 μm, and (B) = 50 μm.
Figure EV4
Figure EV4. Lung neutrophil recruitment and injury is attenuated in Mki67CreERT hypomorphs exposed to LPS.
(A) Bronchoalveolar lavages were performed 3 days after LPS (5 mg/kg) or PBS was instilled intratracheally into lungs of adult Mki67WT and Mki67CreERT hypomorph mice. (B) The total number of leukocytes, the proportion of macrophages, the proportion of neutrophils, and total protein were quantified in BAL fluid, and graphed as mean ± standard deviation with individual mice shown in circles or squares. n = 5 mice for all groups except 7 Mki67CreERT exposed to LPS. (Total Cell Counts: PBS-Mki67WT vs LPS-Mki67WT: P < 0.0001; PBS-Mki67CreERT vs LPS-Mki67WT: P < 0.0001; LPS-Mki67WT vs LPS-Mki67CreERT: P < 0.0001). (Percent macrophages: PBS-Mki67WT vs LPS-Mki67WT: P < 0.0001; PBS-Mki67CreERT vs LPS-Mki67WT: P < 0.0001; LPS-Mki67WT vs LPS-Mki67CreERT: P < 0.0001). (Percent neutrophils: PBS-Mki67WT vs LPS-Mki67WT: P < 0.0001; PBS-Mki67CreERT vs LPS-Mki67WT: P < 0.0001; LPS-Mki67WT vs LPS-Mki67CreERT: P < 0.0001). (Total Protein: PBS-Mki67WT vs LPS-Mki67WT: P = 0.0086; PBS-Mki67CreERT vs LPS-Mki67WT: P = 0.0006; LPS-Mki67WT vs LPS-Mki67CreERT: P = 0.0036). (C) Representative images of BAL cytospins obtained from the mice. Data in (B) graphed as mean ± standard deviation. Scale bar in (C) = 50 μm. Data reflects biological replicates analyzed by one-way ANOVA using Tukey-Kramer HSD (B).
Figure EV5
Figure EV5. Creation and characterization of mouse AT1.1 cell line.
(A) Cartoon model showing how mouse AT1.1 cells were created from EGFP + AT2 cells isolated from Immortomice. (B) Images showing loss of green fluorescence as EGFP+ AT2 cells from Immortomice were cultured. (C) PCR was used to detect Aqp5, T1α, Sftpa, Sftpb, Sftpc, Nkx2.1 and β-actin in AT1.1, AT2.1, MLE15 and adult lungs. The amplified products were then visualized by gel electrophoresis. (D) QRT-PCR was used to detect AT1 and AT2-specific genes in AT1.1 cells, MLE15 cells, and postnatal day 7 (PND7) mouse lungs. Data for genes expressed by AT2 cells is graphed as fold change relative to MLE15 cells ± standard deviation. n = 3 per condition. (Sftpa1: MLE15 vs PND7: P = 0.0005; Sftpb: MLE15 vs PND7: P = 0.0005; Sftpc: MLE15 vs PND7: P < 0.0001; Sftpd: MLE15 vs PND7: P = 0.0011). Data for genes expressed by AT1 cells is graphed as fold change relative to AT1.1 cells ± standard deviation. (T1α: AT1.1 vs PND7: P = 0.3259; Aqp5: AT1.1 vs PND7: P = 0.0913; Hopx: AT1.1 vs MLE15: P = 0.0022; AT1.1 vs PND7: P = 0.1148; MLE15 vs PND7: P = 0.0245; Ifgbp2: AT1.1 vs MLE15: P = 0.0004; AT1.1 vs PND7: P = 0.2554; MLE15 vs PND7: P = 0.0016; Gramd2: At1.1 vs PND7: P = 0.1933). Data reflect biological replicates analyzed by one-way ANOVA using Tukey-Kramer HSD (D).

References

    1. Amulic B, Knackstedt SL, Abu Abed U, Deigendesch N, Harbort CJ, Caffrey BE, Brinkmann V, Heppner FL, Hinds PW, Zychlinsky A (2017) Cell-cycle proteins control production of neutrophil extracellular traps. Dev Cell 43:449–462.e445 - PubMed
    1. Andres-Sanchez N, Fisher D, Krasinska L (2022) Physiological functions and roles in cancer of the proliferation marker Ki-67. J Cell Sci 135:jcs258932 - PubMed
    1. Barkauskas CE, Cronce MJ, Rackley CR, Bowie EJ, Keene DR, Stripp BR, Randell SH, Noble PW, Hogan BL (2013) Type 2 alveolar cells are stem cells in adult lung. J Clin Invest 123:3025–3036 - PMC - PubMed
    1. Bijli KM, Fazal F, Rahman A (2012) Regulation of Rela/p65 and endothelial cell inflammation by proline-rich tyrosine kinase 2. Am J Respir Cell Mol Biol 47:660–668 - PMC - PubMed
    1. Booth DG, Takagi M, Sanchez-Pulido L, Petfalski E, Vargiu G, Samejima K, Imamoto N, Ponting CP, Tollervey D, Earnshaw WC, Vagnarelli P (2014) Ki-67 is a PP1-interacting protein that organises the mitotic chromosome periphery. eLife 3:e01641 - PMC - PubMed

MeSH terms

LinkOut - more resources