. 2025 Jun 10;5(1):221.
doi: 10.1038/s43856-025-00946-z.

Deep learning-based ranking method for subgroup and predictive biomarker identification in patients

Affiliations

Deep learning-based ranking method for subgroup and predictive biomarker identification in patients

Zihuan Liu et al. Commun Med (Lond). .

Abstract

Background: The task of identifying patient subgroups with enhanced treatment responses is important for clinical drug development. However, existing deep learning-based approaches often struggle to provide clear biological insights. This study aims to develop a deep learning method that not only captures treatment effect differences among individuals but also helps uncover meaningful biological markers associated with those differences.

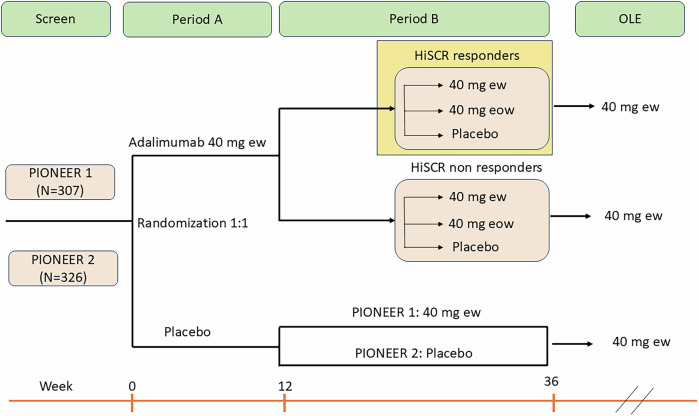
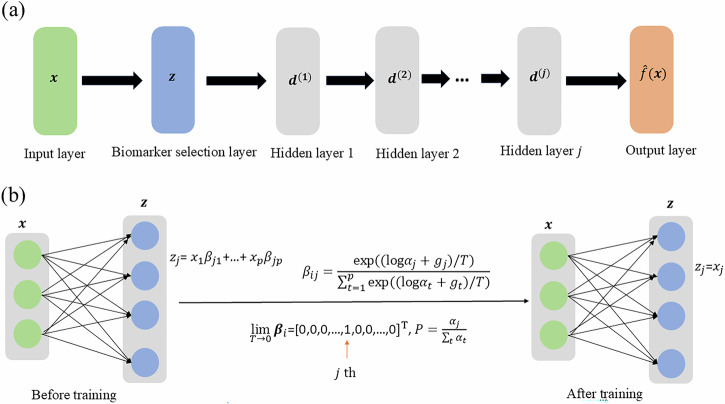
Methods: We introduce DeepRAB, a deep learning-based framework designed for exploring treatment effect heterogeneity by constructing individualized treatment rule (ITR). In addition, DeepRAB enables model interpretability by facilitating predictive biomarker identification. We evaluate its performance using simulated datasets that vary in complexity, treatment effect strength, and sample size. We also apply the method to the adalimumab (Humira, AbbVie) hidradenitis suppurativa (HS) clinical trial data, analyzing patient characteristics and treatment outcomes.

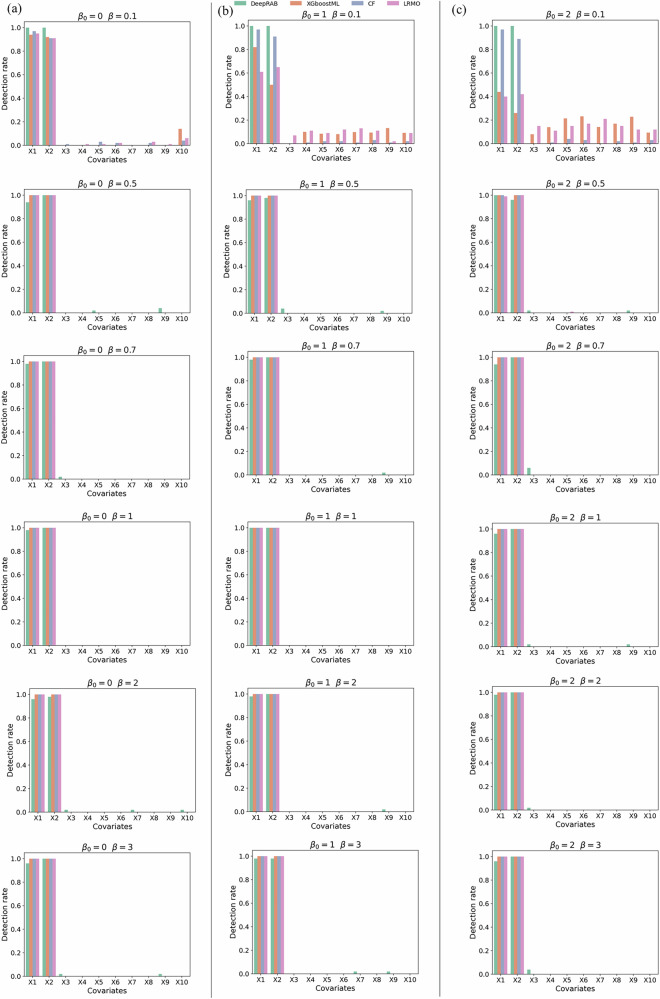
Results: In analyses of simulated data under various scenarios, our findings show the effective performance of DeepRAB for subgroup exploration, and its capability to uncover predictive biomarkers when compared to existing approaches. When applied to the real clinical trial data, DeepRAB demonstrates its practical usage in identifying important predictive biomarkers and boosting model prediction performance.

Conclusions: Our research provides a promising approach for subgroup identification and predictive biomarker discovery by leveraging deep learning. This approach may support more targeted treatment strategies in clinical research and enhance decision-making in personalized medicine.

Plain language summary

In order to improve healthcare, matching patients to effective treatment plans is needed. This study aims to find better ways to identify groups of patients who respond well to certain treatments. We develop a new method called DeepRAB, which uses artificial intelligence to find these patient groups and identify important biomarkers that can predict treatment response. We test DeepRAB using simulated data and real patient data from a clinical trial studying a skin condition called hidradenitis suppurativa. The results show that DeepRAB is successful in identifying meaningful patient groupings and performs better than existing methods. This new approach has the potential to help doctors choose the best treatment options for individual patients, making healthcare more personalized and effective.


Conflict of interest statement

Competing interests: The authors declare no competing interests.

Figures

Fig. 1
Fig. 1. Study design for the hidradenitis suppurativa clinical trial and its role in modeling.
In Period A, patients received induction dosing: 160 mg at Week 0, 80 mg at Week 2, and 40 mg starting at Week 4. Week-12 HiSCR responders entered Period B and continued treatment through Week 36 or until loss of response (defined as a 50% decrease in AN count gained between baseline and Week 12). Non-responders at Week 12 continued through at least Week 26, and up to Week 36. Re-randomization in Period B for patients initially treated with adalimumab was stratified by Week-12 HiSCR status and baseline Hurley Stage (II vs. III). Stratification in PIONEER I and II also considered concomitant antibiotic use. Patients could enter a multi-center, 60-week open-label extension (OLE) study following Period B. The design informs the modeling analysis by providing a framework for identifying treatment benefit subgroups based on response trajectories and baseline clinical features. HiSCR: Hidradenitis Suppurativa Clinical Response; AN: abscesses and inflammatory nodules; OLE: open-label extension; HS: hidradenitis suppurativa; LOR: loss of response. ew: every week; eow: every other week.
Fig. 2
Fig. 2. Overview of the DeepRAB framework and biomarker selection process.
a A schematic illustration of the DeepRAB architecture, which includes an input layer, a biomarker selection layer implemented via a CAE, multiple hidden layers, and an output layer corresponding to ITR predictions. This structure enables both subgroup identification and predictive biomarker discovery. b A mathematical overview of the biomarker selection layer. The selection process is driven by the CAE, enabling end-to-end learning of the most informative biomarkers for treatment response. The equations shown reflect how features are selected during model training. ITR: individualized treatment rule; CAE: Concrete Autoencoder.
Fig. 3
Fig. 3. Cross-validation procedure and model evaluation workflow for DeepRAB.
This schematic outlines the model evaluation framework for DeepRAB using 10-fold cross-validation. The dataset is randomly divided into 10 equal parts; in each iteration, DeepRAB is trained on 9 folds while the remaining fold is used for validation. This process is repeated for all folds across a grid of tuning parameter combinations. The average validation error is computed for each parameter setting, and the optimal set of parameters is selected based on the lowest average validation error.
Fig. 4
Fig. 4. DeepRAB identifies subgroups and predictive biomarkers.
a Overview of DeepRAB’s input features and output predictions, including interpretation of model components for subgroup identification and biomarker selection; b The observed data contains information about patient biomarkers Xi, factual treatment Ai and factual outcome Yi. The ground truth causal effect of the treatment is defined as the difference between receiving the treatment Yi(1) and placebo Yi(1); c The observed data for patients that have received treatment (orange) and patients that have not received the treatment (green) can be used to learn response surfaces for each treatment option and thus estimate the causal effect of the treatment Z(X). d Implementation of A-learning loss function in output layer to estimate the optimal ITR; e Biomarker selection layer identifying predictive biomarkers and ranking their importance; f Treatment recommendation for the new patient based on sign {f^X}.
Fig. 5
Fig. 5. Subgroup identification performance in Simulation I for continuous outcomes. Boxplots show the AUC across methods with a sample size of N = 1000.
a Prognostic effect β0=0; predictive effects β={0.1, 0.5, 0.7, 1, 2, 3}. b Prognostic effect β0=1; predictive effects β={0.1, 0.5, 0.7, 1, 2, 3}. c Prognostic effect β0=2; predictive effects β={0.1, 0.5, 0.7, 1, 2, 3}. CF: causal forest. XGboostML: XGboost with modified loss function. LRMO: linear regression with modified outcome.
Fig. 6
Fig. 6. Detection rate of individual biomarkers in Simulation I for continuous outcomes with a sample size of N = 1000.
a Prognostic effect β0=0; predictive effects β={0.1, 0.5, 0.7, 1, 2, 3}. b Prognostic effect β0=1; predictive effects β={0.1, 0.5, 0.7, 1, 2, 3}. c Prognostic effect β0=2; predictive effects β={0.1, 0.5, 0.7, 1, 2, 3}. CF: causal forest. XGboostML: XGboost with modified loss function. LRMO: linear regression with modified outcome.
Fig. 7
Fig. 7. Subgroup identification performance in Simulation III for binary outcomes. Boxplots show the AUC across methods with a sample size of N = 1000.
a Prognostic effect β0=0; predictive effects β={0.1, 0.5, 0.7, 1, 2, 3}. b Prognostic effect β0=1; predictive effects β={0.1, 0.5, 0.7, 1, 2, 3}. c Prognostic effect β0=2; predictive effects β={0.1, 0.5, 0.7, 1, 2, 3}. CF: causal forest. XGboostML: XGboost with modified loss function. LRMC: linear regression with modified covariates.
Fig. 8
Fig. 8. Detection rate of individual biomarkers in Simulation III for binary outcomes with a sample size of N = 1000.
a Prognostic effect β0=0; predictive effects β={0.1, 0.5, 0.7, 1, 2, 3}. b Prognostic effect β0=1; predictive effects β={0.1, 0.5, 0.7, 1, 2, 3}. c Prognostic effect β0=2; predictive effects β={0.1, 0.5, 0.7, 1, 2, 3}. CF: causal forest. XGboostML: XGboost with modified loss function. LRMC: linear regression with modified covariates.
Fig. 9
Fig. 9. The importance of derived predictive biomarkers with each method for Humira HS studies.
a DeepRAB. b XGboostML. c CF. d LRMC. XGboostML: XGboost with modified loss function; CF: causal forest; LRMC: linear regression with modified covariates; CHG_AN: % reduction in AN count at week 12; AN12: AN count at week 12; AN0: AN count at week 0; DFT_OBS_0: draining fistula count at week 0; DFT_OBS_12: draining fistula count at week 12; CHG_DFT_OBS: reduction in draining fistula count at week 12; ABT_OBS_0: abscess count at week 0; ABT_OBS_12: abscess count at week 12; CHG_ABT_OBS: reduction in abscess count at week 12; SMOKER: smoking status; STHUSTN: Hurley stage at week 0; ITT2RFN: initial responder status at week 12; HISCR0: HiSCR at week 0; STANHSN: concomitant use of antibiotics.
Fig. 10
Fig. 10. Proportion of patients achieving HiSCR by visit.
a Proportion of patients in the PRR population achieving HiSCR at each study visit. b Proportion of patients in the NonPRR population achieving HiSCR at each study visit. PRR (Partial Responders and HiSCR Responders) are defined as patients with at least a 25% reduction in abscess and inflammatory nodule (AN) count after the initial 12 weeks of treatment; NonPRR includes all other patients.

Similar articles

References

    1. Revuz, J. Hidradenitis suppurativa. J. Eur. Acad. Dermatol. Venereol.23, 985–998 (2009). - PubMed
    1. Jemec, G. B. Hidradenitis suppurativa. N. Engl. J. Med.366, 158–164 (2012). - PubMed
    1. Shlyankevich, J., Chen, A. J., Kim, G. E. & Kimball, A. B. Hidradenitis suppurativa is a systemic disease with substantial comorbidity burden: a chart-verified case-control analysis. J. Am. Acad. Dermatol.71, 1144–1150 (2014). - PubMed
    1. Kimball, A. B. et al. Two phase 3 trials of adalimumab for hidradenitis suppurativa. N. Engl. J. Med.375, 422–434 (2016). - PubMed
    1. Kimball, A. et al. HiSCR (Hidradenitis Suppurativa Clinical Response): a novel clinical endpoint to evaluate therapeutic outcomes in patients with hidradenitis suppurativa from the placebo‐controlled portion of a phase 2 adalimumab study. J. Eur. Acad. Dermatol. Venereol.30, 989–994 (2016). - PMC - PubMed

LinkOut - more resources