. 2025 Jun;5(6):1046-1062.
doi: 10.1038/s43587-025-00882-6. Epub 2025 Jun 10.

Recurrent somatic mutation and progerin expression in early vascular aging of chronic kidney disease

Affiliations

Recurrent somatic mutation and progerin expression in early vascular aging of chronic kidney disease

Gwladys Revêchon et al. Nat Aging. 2025 Jun.

Abstract

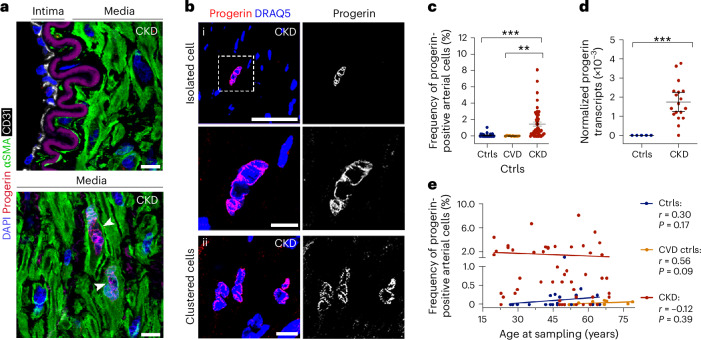
Early vascular aging plays a central role in chronic kidney disease (CKD), but its molecular causes remain unclear. Somatic mutations accumulate in various cells with age, yet their functional contribution to aging tissues is not well understood. Here we found progerin, the protein responsible for the premature aging disease Hutchinson-Gilford progeria syndrome, steadily recurring in vascular smooth muscle cells of patients with CKD. Notably, the most common progeria-causing mutation, LMNA c.1824C>T, was identified as a somatic mutation in CKD arteries. Clusters of proliferative progerin-expressing cells in CKD arteries and in vivo lineage-tracing in mice revealed clonal expansion capacity of mutant cells. Mosaic progerin expression contributed to genomic damage, endoplasmic reticulum stress and senescence in CKD arteries and resulted in vascular aging phenotypes in vivo. These findings suggest that certain somatic mutations may be clonally expanded in the arterial wall, contributing to the disease-related functional decline of the tissue.


Conflict of interest statement

Competing interests: The authors declare no competing interests.

Figures

Fig. 1
Fig. 1. Progerin is recurrently expressed in up to 8.1% of the VSMCs in CKD arteries.
a, Colocalization staining of progerin (red), CD31 (white) and αSMA (green) in CKD arteries. White arrowheads indicate progerin-positive cells. This staining was performed on five independent CKD arteries. b, Immunostaining on CKD arteries showing both isolated (a) and clustered (b) progerin-positive cells (red). c, Quantification of progerin-expressing cells in controls (n = 23), CVD controls (n = 10) and patients with CKD (n = 50) (CKD versus Ctrls: P = 3 × 106; CKD versus CVD Ctrls: P = 0.0012). d, Graph showing the copy number of progerin transcripts normalized to GAPDH, in controls (n = 5) and CKD (n = 18) arteries (P = 0.0003). e, Graph showing that the frequency of progerin-positive cells did not correlate with age at sampling. Scale bars, 20 μm (a), 50 μm (b(i)), 10 μm (b(ii)). Statistics were Kruskal–Wallis test with Dunn’s correction for multiple comparisons (c), Mann–Whitney test with a two-tailed 95% confidence interval (d), Spearman correlation coefficients with a two-tailed 95% confidence interval for the Ctrls (n = 23) and CVD Ctrls (n = 10) groups, and Pearson correlation coefficients with a two-tailed 95% confidence interval for the CKD group (n = 50) (e). Data are presented as mean values ± s.e.m. (c,d). **P < 0.01; ***P < 0.001. Source data
Fig. 2
Fig. 2. The common HGPS mutation, LMNA c.1824C>T, is a recurring somatic mutation in arteries of patients with CKD.
a, Telomere length did not correlate with the frequency of progerin-positive cells in CKD arteries (n = 14). b, Schematic view of a region of the LMNA exon 11 containing the c.1824C>T mutation, which was shown to increase the usage of exon 11 cryptic splice site, resulting in the progerin splicing associated with HGPS. c, Example of a ddPCR two-dimensional plot showing the presence of the c.1824C>T mutation in a CKD artery with an allele frequency of 13.1% for the 1824T allele. This section had shown 6.7% progerin-positive arterial cells in immunofluorescence. IF, immunofluorescence. d, Graph showing the FA of the mutation in controls (n = 23), CVD controls (n = 9) and CKD arteries (n = 46) (CKD versus Ctrls, P = 3.6 × 10−5; CKD versus CVD Ctrls, P = 0.0035). e, Graph showing the FA of the mutation in young controls (n = 7), old controls (n = 19) and CKD (n = 26) PBMCs (young Ctrls versus old Ctrls, P = 0.0169; young Ctrls versus CKD, P = 0.0045). Young controls’ age range, 21–38 years; old controls’ age range, 44–81 years; patients with CKD age range, 20–38 years. f, Graphs showing the FA of five single nucleotide variants causing genetic diseases in Ctrls versus CKD PBMCs. These non-progeria genetic diseases include cystic fibrosis (CFTR), Duchenne muscular dystrophy (DMD), non-small cell lung cancer (EGFR) and congenital muscular dystrophy (LAMA2). Number of Ctrls and CKD individuals included, respectively: EGFR c.2369C>T: 10, 9; DMD c.8689C>T, CFTR c.1898+1G>A, DMD c.9771+1G>A, LAMA2 c.3973+2T>C: 10, 10. Statistics were Spearman correlation coefficients with a two-tailed 95% confidence interval (a) and Kruskal–Wallis test with Dunn’s correction for multiple comparisons (d,e). Data are presented as mean values ± s.e.m. (df). *P < 0.05; **P < 0.01; ***P < 0.001. Source data
Fig. 3
Fig. 3. Progerin-expressing cells form VSMC clusters in CKD arteries.
a, Immunofluorescent image showing the distribution of progerin-positive cells (green/highlighted in pink) in a CKD artery. Cell clusters are defined by yellow-/blue-dashed circles. Clusters were visualized in 21 of 32 independent CKD arteries. Scale bar, 100 μm. b, Spatial reconstruction based on serial artery sections showed progerin-positive cells (red) in the medial layer of a CKD artery. c, Graph showing the frequency of progerin-positive cells that form clusters for each CKD artery (n = 26). d, Graph showing the frequency of clusters that are formed by 2, 3, 4 or ≥5 progerin-positive cells per CKD artery (n = 21). e,f, Graphs showing the positive correlation between the frequency of progerin-expressing cells and the total number of clusters/sample (n = 26 CKD) (e) or the number of larger clusters/sample (n = 26 CKD) (f). g, Graph representing the positive correlation between the FA of the LMNA c.1824C>T mutation and the frequency of clusters containing ≥5 cells (n = 25 CKD). Statistics were Spearman correlation coefficients with a two-tailed 95% confidence interval (e,f). Data are presented as mean values ± s.e.m. (c,d). Source data
Fig. 4
Fig. 4. Progerin-expressing cells are positive for markers of proliferation in CKD arteries.
a, Analysis of proliferating cells in CKD (n = 15) and control (n = 4) arteries, as detected by staining for Ki67 (red) (P = 0.0279). b, Immunostaining against progerin (red), PCNA (white) and αSMA (green) showing a cluster of proliferative progerin-positive VSMCs in a CKD artery. White arrows point to that cluster. This staining was performed on three independent CKD arteries. c, Immunostaining against progerin (red) and PCNA (white) showing a cluster of progerin-expressing cells in CKD and control arteries. d, Graph representing the fold change of PCNA-positive cells in control (n = 9) versus CKD (n = 20) arteries (P = 0.0006). e, Circle plot showing the distribution of progerin-positive cells among the PCNA+53BP1 cells in the media layer of CKD arteries (s.d. ±12). f, Graph showing the correlation between the frequency of PCNA-positive cells and the frequency of progerin-positive cells. g, Graph representing the frequency of PCNA-positive cells present in progerin-negative and progerin-positive cells in CKD arteries (n = 12). h, Graph showing the frequency of PCNA only positive cells in progerin clusters (n = 9 CKD). Scale bars, 10 μm (a), 25 μm (b) and 50 μm (c). Statistics used were a nonparametric Mann–Whitney U-test with a two-tailed 95% confidence interval (a,d,g) and Spearman correlation coefficients with a two-tailed 95% confidence interval (f). Data are presented as mean ± s.e.m. (a,d,g,h). *P < 0.05; ***P < 0.001. Source data
Fig. 5
Fig. 5. Progerin-expressing cells proliferate in the postnatal arterial wall and form clusters in vivo.
a, Graph showing the frequency of Ki67-positive VSMCs in mice aortas (n = 3–5) at five different ages: P3, P5, P8, P14 and P21. b, Myh11:Confetti:Lmna1827T and Myh11:Confetti mice were used to induce progerin and confetti reporter expression in a fraction of VSMCs. Mice underwent three consecutive tamoxifen injections starting from P3. Aortas were collected 3 and 16 days after the last dose of tamoxifen. Cartoon partly created using BioRender. c, Immunostaining against progerin (red) and αSMA (green) showing progerin-positive VSMCs in mosaic setting. Pink arrows point to those cells. No progerin-positive cells were detected at P8 in agreement with that progerin needs time to accumulate to be detected by the antibody. This experiment was carried out in 14 and 17 Myh11:Confetti:Lmna1827T at P8 and P21, respectively. d, Immunostaining for Ki67 (red) and αSMA (green) at P8 and P21. e, Graph representing the frequency of Ki67-positive cells in Myh11:Confetti:Lmna1827T and Myh11:Confetti (P < 1 × 1015 for Myh11:Confetti P8 versus P21 and for Myh11:Confetti:Lmna1827T P8 versus P21). f, Confocal pictures of confetti in mice aortas at P8 and P21. The four colors represent different confetti fluorophores: CFP (blue), GFP (green), YFP (yellow), RFP (red). g, Graph showing the frequency of confetti-positive VSMCs in Myh11:Confetti:Lmna1827T and Myh11:Confetti mice (P8 versus P21 Myh11:Confetti, P = 3.4 × 105; P8 versus P21 Myh11:Confetti:Lmna1827T, P = 0.008). h, Pictures of four-cell and six-cell clusters. i, Graph showing the frequency of cell forming clusters in Myh11:Confetti and Myh11:Confetti:Lmna1827T mice (Myh11:Confetti:Lmna1827T P8 versus P21: P = 0.0055). j, Graph showing the frequency of clusters formed by 4, 5, 6, 7 or ≥8 single-color-positive cells per mice (four-cell cluster, P8 Myh11:Confetti versus Myh11:Confetti:Lmna1827T: P = 0.0045). k, Graph representing the frequency of mice with specific cluster sizes. Scale bars, 25 μm (c,d,f). Statistics were conducted using two-way ANOVA with Tukey’s correction for multiple comparisons (e,g,i) and an unpaired t-test with Holm–Sidak’s correction for multiple comparisons (j). Number of mice: Myh11:Confetti P8 = 13, P21 = 8; Myh11:Confetti:Lmna1827T P8 = 14, P21 = 17 (e,g,i,j). Data are presented as mean ± s.e.m. (a,e,g,i,j). **P < 0.01; ***P < 0.001. Source data
Fig. 6
Fig. 6. Progerin-expressing cells show molecular changes indicative of ER stress and DNA damage in CKD arteries.
a, Colocalization staining of BiP (green) and progerin (red) in CKD arteries. b, Graph displaying the frequency of BiP-positive cells in the media of Ctrls (n = 9) versus patients with CKD (n = 12, P = 0.0073) c, Circle plot illustrating the distribution of progerin-expressing cells among the BiP-positive cells in the media of CKD arteries (s.d. ±11). d, Graph showing the correlation between the frequency of BiP-positive cells and the frequency of progerin-positive cells (n = 9 Ctrls and 12 CKD). e, Graph representing the frequency of BiP-positive cells present in progerin-negative and progerin-positive cells of CKD arteries (n = 12, P = 0.0002). f, Colocalization staining of 53BP1 (green) and progerin (red) in CKD arteries. This staining was conducted on 16 independent CKD arteries. g, Circle plots illustrating the distribution of 53BP1-positive cells in the medial layer of CKD arteries (s.d. ±1.7), as well as the overall fraction of progerin and 53BP1-positive cells. h, Graph showing the correlation between the frequency of 53BP1-positive cells and the frequency of progerin-positive cells (n = 16 CKD). i, Graph representing the frequency of 53BP1-positive cells present in progerin-negative and progerin-positive cells of CKD arteries (n = 14, P = 1.8 × 105). Scale bars, 25 μm (a,f). Statistics were nonparametric Mann–Whitney U-test with a two-tailed 95% confidence interval (b,e,i) and Spearman correlation coefficients with a two-tailed 95% confidence interval (d,h). Data are presented as mean ± s.e.m. (b,e,i). **P < 0.01; ***P < 0.001. Source data
Fig. 7
Fig. 7. Progerin-expressing cells show molecular changes indicative of senescence in CKD arteries.
a, Colocalization staining of P21 (green) and progerin (red) in arteries from patients with CKD. b, Graph displaying the frequency of P21-positive cells in the arteries of Ctrls (n = 9) versus patients with CKD (n = 13) (P = 4.8 × 105). c, Circle plot illustrating the distribution of progerin-expressing cells among the P21-positive cells in the media layer of CKD arteries (s.d. ±17). d, Graph showing the correlation between the frequency of P21-positive cells and the frequency of progerin-positive cells (n = 9 Ctrls and 13 CKD). e, Graph representing the frequency of P21-positive cells present in progerin-negative and progerin-positive cells of CKD arteries (n = 13) (P = 1.9 × 107). f, Colocalization staining of P16 (green) and progerin (red) in arteries from patients with CKD. g, Graph displaying the frequency of P16-positive cells in the arteries of Ctrls (n = 10) versus patients with CKD (n = 16) (P = 0.0035). h, Circle plot illustrating the distribution of progerin-expressing cells among the P16-positive cells in the media layer of CKD arteries (s.d. ±7.5). i, Graph showing the correlation between the frequency of P16-positive cells and the frequency of progerin-positive cells (n = 10 Ctrls and 16 CKD). j, Graph representing the frequency of P16-positive cells present in progerin-negative and progerin-positive cells of CKD arteries (n = 16) (P = 0.0194). Scale bars, 25 μm (a,f). Statistics were nonparametric Mann–Whitney U-test with a two-tailed 95% confidence interval (b,e,g,j) and Spearman correlation coefficients with a two-tailed 95% confidence interval (d,i). Data are presented as mean ± s.e.m. (b,e,g,j). *P < 0.05; **P < 0.01; ***P < 0.001. Source data
Fig. 8
Fig. 8. Mosaic expression of the Lmna 1827C>T mutation results in early vascular aging phenotypes.
a, Adult Myh11:Confetti and Myh11:Confetti:Lmna1287T mice were injected with tamoxifen over five consecutive days to induce mosaic progerin and confetti expression in VSMCs. Aortas were collected and analyzed about 10 weeks after the last tamoxifen injection. Cartoon partly created using BioRender. b, Confocal picture of confetti in the aortas of Myh11:Confetti and Myh11:Confetti:Lmna1287T mice. c, Graph illustrating the frequency of confetti-positive cells in Myh11:Confetti and Myh11:Confetti:Lmna1287T mice 2 and 10 weeks post-induction of recombination (n = 7 Myh11:Confetti:Lmna1827T 2 weeks post-induction, n = 4 Myh11:Confetti and n = 9 Myh11:Confetti:Lmna1827T 10 weeks post-induction; P = 0.0262). d, Colocalization staining of BiP (green) and progerin (red) in Myh11:Confetti and Myh11:Confetti:Lmna1287T arteries. e, Quantification graph of BiP-positive medial cells in Myh11:Confetti (n = 6) versus Myh11:Confetti:Lmna1287T (n = 9) mice (P = 2.1 × 105). f, Confocal picture showing reduced VSMC density. VSMC density was quantified by co-staining with αSMA (not shown) and 4,6-diamidino-2-phenylindole (DAPI) (white); a, adventitia; m, media; i, intima. g, Graph showing reduced vascular smooth muscle cell density in Myh11:Confetti/wild-type (n = 6) versus Myh11:Confetti:Lmna1287T (n = 9) mice (P = 0.0025). h, Picture of Myh11:Confetti versus Myh11:Confetti:Lmna1287T arteries stained with Masson’s trichrome. i, Graph showing arbitrary assessment of medial fibrosis in Myh11:Confetti/wild-type (n = 4) versus Myh11:Confetti:Lmna1287T (n = 4) arteries (P = 0.0094). j, Gene expression profiling of osteogenic markers using ddPCR in Myh11:Confetti (n = 6) versus Myh11:Confetti:Lmna1287T (n = 7) aortas: Runx2 (left, P = 0.0281); Spp1 (middle, P = 0.0175) and Bmp2 (right). Values are normalized to β-actin gene expression. Scale bars, 10 μm (b,d,f) and 50 μm (h). Statistics were conducted by one-way ANOVA with Tukey’s correction for multiple comparisons (c) and an unpaired t-test with a two-tailed 95% confidence interval (e,g,i,j). Data are presented as mean ± s.e.m. (c,e,g,i,j). *P < 0.05; **P < 0.01; ***P < 0.001. Source data
Extended Data Fig. 1
Extended Data Fig. 1. Detection of progerin, not prelamin A, in arteries from CKD patients.
(A) Western blot on protein extracts from skin of HGPS and wild-type mice. The mouse model used is a transgenic model with a human LMNA minigene including the G608G mutation. The lamin A/C antibody detected lamin A, progerin and lamin C (left), while the progerin antibody only detected progerin (right). (B) Representative picture of a negative control for an immunostaining against progerin in a CKD artery, which shows autofluorescence from the internal and external elastic lamina. (C) Immunofluorescence pictures of progerin (red) in CKD, Ctrl and CVD Ctrl arteries. White arrowheads point to progerin-positive cells. (D) Immunohistochemistry on CKD arteries using an antibody against prelamin A did not show positive cells, while prelamin A was detected in the skin of a HGPS mouse model. This staining was performed on 14 CKD and 1 Ctrl artery. (E) Colocalization staining using progerin and prelamin A antibodies did not indicate the presence of prelamin A in progerin-positive cells. (F) Graph representing the frequency of progerin-positive arterial cells based on the etiology of CKD (n = 8 ADPKD, 14 CGN, 9 DN, 7 NUD, 12 Other); data presented as mean values ± SEM. Scale bars: B = 100μm; C-D = 50μm; E = 10μm. Source data
Extended Data Fig. 2
Extended Data Fig. 2. Very low PFA-induced mutations at the LMNA c.1824C locus.
(A) Mosaic cell cultures composed of HGPS patient cells (carrying the LMNA c.1824C>T mutation) and control cells were treated with 4% PFA for 30 min. Analysis of the LMNA c.1824C and c.1824T alleles by ddPCR did not show allelic bias in PFA-treated vs. untreated cultures. (B) Uracil-DNA glycosylase treatment has previously been shown to reduce artefactual C > T transitions. DNA extracted from >15-year-old, FFPE heart and aorta tissues of a mouse model with the wild-type human LMNA minigene were therefore treated with the enzyme (n = 3 Heart, n = 3 Aorta). ddPCR analysis revealed only very low, non-biological C > T transitions at position 1824 in heart (P = 0.0273), but not in aorta. (C) Graphs showing no significant correlation between age at sampling and the fractional abundance of the LMNA c.1824C>T mutation in CKD patients (left, n = 46), control individuals (middle, n = 23) and CVD controls (right, n = 9). (D) Graph representing the allele fraction of the LMNA c.1824C>T variant based on the etiology of CKD (n = 7 ADPKD, 13 CGN, 7 DN, 7 NUD, 12 Other). (E-F) Correlation graphs between the fractional abundance of the LMNA c.1824C > T in CKD PBMC and the age at sampling (E) or the number of years since CKD diagnosis (F)(n = 26). Statistics: B: Unpaired t-test with a two-tailed 95% confidence interval; C (CKD graph): Pearson correlation coefficients with a two-tailed 95% confidence interval; C (Ctrls and CVD Ctrls graph), E, F: Spearman correlation coefficients with a two-tailed 95% confidence interval. A, B, D: Data presented as mean values ± SEM. *, P < 0.05. Source data
Extended Data Fig. 3
Extended Data Fig. 3. Progerin expression correlates with media calcification and the number of years with diagnosed CKD.
(A) Von Kossa staining on CKD arteries. (B) Pathological vascular calcification assessment showed similar grouping as with semi-automated calcification scoring (n = 38 CKD, P = 1e-8). (C) Graph showing the circulating levels of osteoprotegerin (OPG) in CKD patients with non-calcified and calcified arteries (n = 39 CKD, P = 0.0356). (D) Arterial calcification was seen with increased age (n = 50 CKD, P = 0.0005). (E) Graph representing the frequency of patients with CVD based on arterial calcification. (F) Pictures showing the cell density in non-calcified and calcified arteries from CKD patients (left; a=adventitia, m=media, i=intima). Graph showing the media cell density based on arterial calcification (right, n = 32 CKD). (G-H) Graphs showing the intima (G) and adventitia (H) cell density based on arterial calcification (n = 29 CKD). (I) Pictures of the TUNEL assay (red) in a Ctrl and CKD artery (left). Graph showing the fold change in TUNEL-positive media cells in Ctrl (n = 8) and CKD (n = 12) arteries (P = 0.0002). (J) Immunohistochemical picture of cleaved-caspase 3 (cC3) in a CKD artery. This staining was done on n = 8 CKD patients. (K-M) Expression levels of CDKN2A (K), IL-6 (L) and TNFa (M) non-calcified and calcified CKD arteries (Number of non-calcified and calcified arteries, respectively: CDKN2A: n = 5, 18; IL-6: n = 4, 12; TNFa: n = 4, 12); RQ=relative quantification, A.U.=arbitrary units. (N-O) Expression levels of circulating IL-6 (N), and TNFa (O) in CKD patients with non-calcified and calcified arteries (Number of samples for non-calcified and calcified arteries, respectively: IL-6: n = 10, 34; TNFa: n = 10, 33). (P) Graph representing the frequency of progerin-positive cells in non-calcified (n = 11) and calcified (n = 39) arteries (P = 0.0357). (Q) The frequency of progerin-positive cells in CKD arteries correlated with the number of years for which the patients were diagnosed with the disease. Scale bars: A = 100μm; F, I, J = 50μm.Statistics: B-D, I, K-P: Nonparametric Mann–Whitney test with a two-tailed 95% confidence interval; F, Q (All and Cal.): Pearson correlation coefficients with a two-tailed 95% confidence interval; G-H, Q (Non-cal.): Spearman correlation coefficients with a two-tailed 95% confidence interval. B-D, F-I, K-P: Data presented as mean values ± SEM. *, P < 0.05; ***, P < 0.001. Source data
Extended Data Fig. 4
Extended Data Fig. 4. Progerin-expressing viSMCs in a mosaic setting are indistinguishable from control cells under uremic stress.
(A-B) Persistent DNA damage in VSMCs is evident in vitro as observed by an increased number of foci in the cells, as measured with ATR (A) and gH2AX (B) four days post-treatment with uremic or control serum. (C) Schematic overview representing the experimental workflow. (D) Progerin (red) and αSMA (green) co-labeling showing progerin-positive viSMCs in an in vitro mosaic setting. (E) Graph representing the frequency of progerin-positive viSMCs 6 days after plating, following the different treatment conditions. (F) Graph showing the average cell growth of the mosaic cultures grown in normal conditions or treated with control/uremic serum. Cell growth was calculated as number of harvested cells/number of plated cells. (G-I) Immunofluorescence against progerin (red) and BiP (green) on the mosaic cultures showed an increase in ER stress after two days of treatment with 10% uremic serum (H, P = 0.0390). ER stress was increased in progerin-expressing cells vs. control cells in normal growth condition (P = 0.0092) but did not differ after uremic treatment. ER stress increased upon uremic serum in progerin-negative cells (P = 0.0396)(I). (J-L) Immunofluorescence against progerin (red) and PCNA (green) on the mosaic cultures showed no significant difference in proliferation after two days of treatment with 10% uremic serum (K). The frequency of proliferative cells did not differ between control cells and progerin-expressing cells (L). Scale bars: A-B = 10μm, D, G, J = 50μm. Statistics: Number of replicates/treatment group: A, B: n = 3, E: n = 6, F: n = 4, H-L: n = 3. E, H, K: One-way ANOVA with Tukey’s correction for multiple comparisons. I, L: One-way ANOVA with Tukey’s correction for multiple comparisons. E, F, H, I, K, L: Data presented as mean values ± SEM. *, P < 0.05; **, P < 0.01. Source data
Extended Data Fig. 5
Extended Data Fig. 5. Progerin-positive cells mostly form small clusters in CKD arteries.
(A) Graph showing the frequency of 2, 3, 4 or ≥5-cell clusters per CKD artery analyzed, and the corresponding frequency of progerin-positive cells, years of disease (YOD) and etiology. (B) Graph showing correlations between the frequency of progerin-positive cells and the number of 2, 3 or 4-cell clusters (n = 26 CKD). (C) Graph showing the positive correlation between the fractional abundance of the mutation and the frequency of clusters with 2 to 4 cells (n = 25 CKD). (D) Graph showing the arterial layer distribution of PCNA-positive cells in control (n = 9) and CKD (n = 20) arteries (P = 0.0035). (E) Colocalization staining of progerin (red), 53BP1 (green) and PCNA (white) in a CKD artery. Scale bar: E = 25μm. Statistics: B, C: Spearman correlation coefficients with a two-tailed 95% confidence interval. D: Multiple Mann–Whitney tests with Holm-Sidak’s correction for multiple comparisons. D: Data presented as mean values ± SEM. ***, P < 0.001. Source data
Extended Data Fig. 6
Extended Data Fig. 6. Accumulation of progerin does not interfere with the clonal propagation capacity of progerin-expressing cells.
(A) Colocalization pictures of Ki67 (red) and αSMA (green) in aortas of wild-type mice at P3, P8, P14 and P21. (B) Colocalization pictures of Progerin (red) and αSMA (green) in aortas of a 5-week-old uninjected Myh11:Confetti:Lmna1827T mouse. (C) Graph comparing the frequency of Ki67-positive cells in the media of Myh11:Confetti:Lmna1827T/+ and Myh11:Confetti:Lmna1827T/1827T mice at P8 and P21. (D) Graph showing the frequency of confetti-positive cells in the media of Myh11:Confetti:Lmna1827T/+ and Myh11:Confetti:Lmna1827T/1827T mice at P8 and P21. (E) Graph showing the frequency of confetti cells forming clusters in the media of Myh11:Confetti:Lmna1827T/+ and Myh11:Confetti:Lmna1827T/1827T mice at P8 and P21. Scale bars: A, B = 25μm. Statistics: C-E: Number of mice: Myh11:Confetti:Lmna1827T/+ P8: n = 5, P21: n = 7; Myh11:Confetti:Lmna1827T/1827T P8: n = 9, P21: n = 10. Two-way ANOVA with Tukey’s correction for multiple comparisons. Data presented as mean values ± SEM. Source data
Extended Data Fig. 7
Extended Data Fig. 7. Molecular defects associate with progerin expression in CKD arteries.
(A) Immunohistochemical staining for ATR in a CKD artery. (B) Graph showing the correlation between ATR accumulation and the frequency of progerin-positive cells in CKD (n = 18). (C) Graph representing the number of 53BP1 foci (no foci: P = 0.0035; ≥5 foci: P = 0.0139) present in progerin-negative and progerin-positive cells of CKD arteries (n = 7). (D) Colocalization staining of pP53 (green) and progerin (red) in arteries from CKD patients. (E) Graph displaying the frequency of pP53-positive cells in the media of Ctrls (n = 9) vs. CKD patients (n = 12) (P = 0.1285). (F) Circle plot illustrating the distribution of progerin-expressing cells among the pP53-positive cells in the media layer of CKD arteries (SD = ±12.4). (G) Graph showing the correlation between the frequency of pP53-positive cells and the frequency of progerin-positive cells (n = 9 Ctrls and 12 CKD). (H) Graph representing the frequency of pP53-positive cells present in progerin-negative and progerin-positive cells of CKD arteries (n = 12, P = 3e-6). Scale bars: A = 50μm; D = 25μm. Statistics: B, G: Spearman correlation coefficients with a two-tailed 95% confidence interval; C: Multiple Mann–Whitney test with Holm-Sidak’s correction for multiple comparisons; E, H: Nonparametric Mann–Whitney test with a two-tailed 95% confidence interval. C, E, H: Data presented as mean values ± SEM. *, P < 0.05; **, P < 0.01; ***, P < 0.001. Source data
Extended Data Fig. 8
Extended Data Fig. 8. Increased Ki67 and fiber linearization upon mosaic progerin expression in mice VSMCs.
(A) Graph showing the frequency of confetti-positive cells engaged in cluster formation in Myh11:Confetti (n = 4) and Myh11:Confetti:Lmna1827T (n = 9) aortas. (B) Graph showing the cluster distribution per 100 confetti-positive cells in Myh11:Confetti (n = 4) and Myh11:Confetti:Lmna1827T (n = 9) mice. (C) Co-labeling pictures of progerin (red) and Ki67 (green) in Myh11:Confetti and Myh11:Confetti:Lmna1827T arteries. (D) Graph showing the frequency of Ki67-positive media cells in Myh11:Confetti/WT (n = 8) and Myh11:Confetti:Lmna1827T (n = 9) mice (P = 0.0022). (E) Transmitted detection images of elastin fiber linearization and breaks. (F-G) Elastin fiber analyses showing the number of breaks per section (F) and the number of coils per section (G) in Myh11:Confetti/WT (n = 8) and Myh11:Confetti:Lmna1827T (n = 9) mice. Scale bars: C = 10μm; E = 50μm. Statistics: A, D, F, G: Unpaired t-test with a two-tailed 95% confidence interval; B: Multiple unpaired t-test with Holm-Sidak’s correction for multiple comparisons. A, B, D, F, G: Data presented as mean values ± SEM. **, P < 0.01. Source data

References

    1. Benditt, E. P. & Benditt, J. M. Evidence for a monoclonal origin of human atherosclerotic plaques. Proc. Natl Acad. Sci. USA70, 1753–1756 (1973). - PMC - PubMed
    1. Andreassi, M. G. Coronary atherosclerosis and somatic mutations: an overview of the contributive factors for oxidative DNA damage. Mutat. Res.543, 67–86 (2003). - PubMed
    1. Zhang, L. & Vijg, J. Somatic mutagenesis in mammals and its implications for human disease and aging. Annu. Rev. Genet. 52, 397–419 (2018). - PMC - PubMed
    1. Martincorena, I. Somatic mutation and clonal expansions in human tissues. Genome Med.11, 35 (2019). - PMC - PubMed
    1. Zhu, M. et al. Somatic mutations increase hepatic clonal fitness and regeneration in chronic liver disease. Cell177, 608–621.e12 (2019). - PMC - PubMed

MeSH terms