. 2025 Oct;37(39):e2501565.
doi: 10.1002/adma.202501565. Epub 2025 Jun 11.

Engineering CRISPR System-Based Bacterial Outer Membrane Vesicle Potentiates T Cell Immunity for Enhanced Cancer Immunotherapy

Affiliations

Engineering CRISPR System-Based Bacterial Outer Membrane Vesicle Potentiates T Cell Immunity for Enhanced Cancer Immunotherapy

Hongjin Wang et al. Adv Mater. 2025 Oct.

Abstract

Immune checkpoint blockade (ICB) therapy has revolutionized cancer treatment but only benefits a subset of patients because of insufficient infiltration and inactivation of effector T cells. Bacterial outer membrane vesicles (OMVs) can activate immunity and deliver therapeutic agents for immunotherapy. However, efficiently targeting and packaging therapeutic molecules into OMVs remains challenging. Here, the engineered E. coli BL21-derived OMVs enable the packaging of multiple genes, resulting in a 7-fold increase in DNA enrichment efficiency and gene silencing in vitro. Moreover, the engineered OMVs carrying genes encoding CXCL9 and IL12 (OMV-C9I12) reprogram tumor cells to secrete these factors, significantly enhancing T-cell chemotaxis and activation. More importantly, this system markedly inhibits tumors, extends survival, and synergizes with anti-PD-1/PD-L1 therapy in murine MB49 and B16F10 tumor models. Single-cell RNA sequencing (scRNA-seq) further reveals significant upregulation of T-cell chemotaxis and activation-related pathways following OMV-C9I12 treatment. Finally, OMV-C9I12 potentiates T cell-mediated immunotherapy and suppresses the growth of bladder and breast cancer tumors in humanized mouse models. These findings highlight the potential of this engineered OMV platform for cancer gene therapy and provide novel strategies to overcome resistance to immunotherapy.

Keywords: CRISPR system; T cell immunity; cancer immunotherapy; gene therapy; outer membrane vesicles; self assembly.


Conflict of interest statement

The authors declare no conflict of interest.

Figures

Figure 1
Figure 1
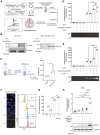
Characterization of diverse wild‐type OMVs and their effects on promoting antitumor immunity in a subcutaneous MB49 tumor model. A) Schematic illustration of the development of a CRISPR‐based engineered OMV system to recruit and activate T cells for enhanced cancer immunotherapy. The CXCL9 and IL12 coexpression plasmids were packaged into OMVs via the dCas9‐ClyA‐sgRNA complex via a self‐assembly process termed OMV‐C9I12. Following intratumoral injection or intravesical instillation, OMV‐C9I12 is taken up by tumor cells and drives the coexpression of CXCL9 and IL12 in tumor cells, promoting the infiltration and activation of effector T cells within the tumor microenvironment and thereby inducing enhanced tumor cell killing and T‐cell immune responses. B) Representative transmission electron micrograph (TEM) of OMVs generated from E. coli K‐12 MG1655, E. coli Nissle 1917, and E. coli BL21. Scale bar, 50 nm. C) Schematic illustration of the treatment of a mouse model of MB49 bladder cancer. D) Tumor growth curves of MB49 bladder cancer‐bearing mice treated with diverse OMVs or the PBS control and E) their tumor weights on day 16 (n = 6). F) Percentages of CD8+ T cells, G) IFNγ+ cells among CD8+ T cells, H) Foxp3+CD25+ Treg cells among CD4+ T cells, and I) the ratio of CD8+ T cells to Treg cells in tumor tissues from the indicated groups. J) Heatmap of differential gene cluster analysis of MB49 tumors detected by qPCR after above treatment. The data are expressed as the means ± SDs. Statistical significance was assessed using one‐way ANOVA or two‐way ANOVA. *P <0.05, **P < 0.01, ***P < 0.001; ns, nonsignificant.
Figure 2
Figure 2
Design and characterization of CRISPR‐based engineered OMVs and validation of their delivery efficacy in vitro. A) Schematic illustration of the design and purification of a CRISPR‐based engineered OMV plasmid packaging system that effectively packages and delivers genes of interest (GOIs). B) Western blot of the His‐dCas9‐ClyA fusion protein in engineered BL21 cells and their OMVs. C) Schematic diagram of the ELISA procedure for detecting His‐dCas9‐ClyA fusion protein in engineered OMVs and the concentrations of His‐dCas9‐ClyA fusion protein by ELISA (n = 3 in the OMV group and n = 5 in the OMV lysis group). D) Relative fold enrichment of the EGFP gene extracted from OMVs under the different conditions indicated via the pcDNA3.1(+)‐CMV‐EGFP plasmid, control sgRNA without targeting the EGFP plasmid vector, and E) sgRNA1 targeting the EGFP plasmid vector, as determined by qPCR. The corresponding images of DNA agarose gel electrophoresis following the PCR assay. F) Fluorescence images of MB49 cells after incubation with PKH67‐labeled engineered OMVs (green) at different time points and the corresponding flow cytometry images. F‐actin and nuclei were labeled with phalloidin‐TRITC (red) and 4′,6‐diamidino‐2‐phenylindole (DAPI, blue). Scale bar, 10 µm. G) Flow cytometry analysis of FITC‐positive MB49 cells incubated with PKH67‐labeled engineered OMVs at different time points. H) EGFP mRNA and protein expression levels in MB49 cells were detected by qPCR and western blotting after transfection for 48 h with the different indicated OMVs. The data are expressed as the means ± SDs. Statistical significance was assessed using two‐tailed Student's t test or one‐way ANOVA. *P <0.05, **P < 0.01, ***P < 0.001; ns, nonsignificant.
Figure 3
Figure 3
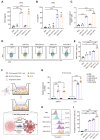
Engineered OMVs deliver CXCL9 and IL12 to increase chemotaxis and T‐cell activation in vitro. Concentrations of the A) CXCL9 and B) IL12 proteins in the supernatants of MB49 cells treated with the indicated engineered or control OMVs determined via ELISA. OMV‐C9I12 represents the combination of CXCL9 and IL12. C) Chemotactic index of mouse CD8+ T cells extracted from spleens recruited into the lower chambers of transwell plates following incubation for 6 h with culture supernatants from MB49 cells pretreated with the indicated OMVs for 48 h. D) Flow cytometry analysis and E) percentages of Ki67 expression in CD8+ T cells following incubation for 24 h with the culture supernatants of MB49 cells pretreated with the indicated OMVs for 48 h. F) Schematic illustration of the transwell chemotaxis and cytotoxicity assay for detecting the synergistic effects of OMV‐C9I12 on the recruitment and activation of T cells to kill B16‐F10 cells. G) Relative expression of CXCL9 or IL12 mRNA in B16‐F10‐OVA cells transfected for 48 h with the indicated engineered or control OMVs. H) Flow cytometric histograms and I) statistics of the percentages of PI‐positive (dead) B16‐F10‐OVA cells. The data are expressed as the means ± SDs. Statistical significance was assessed using one‐way ANOVA. *P <0.05, **P < 0.01, ***P < 0.001.
Figure 4
Figure 4
Engineered OMV‐C9I12 enhances the effect of anti‐PD‐1/PD‐L1 immunotherapy in various tumor models. A) Schematic diagram of the treatment procedures used in the subcutaneous mouse model of MB49 and B16F10 cells. B) Tumor volume after different treatments (n = 5) in the MB49 tumor model, including PBS + IgG, anti‐PD‐1, OMV‐Ctrl, OMV‐C9I12, and OMV‐C9I12 + anti‐PD‐1. C) Tumor weights from mice subjected to different treatments on day 21 in the MB49 tumor model (n = 5). D) Kaplan‒Meier survival curves of the different treatment groups in the MB49 tumor model (n = 5). E) Tumor volume after different treatments in the B16F10 tumor model (n = 6), including PBS + IgG, anti‐PD‐L1, OMV‐Ctrl, OMV‐C9I12, and OMV‐C9I12 + anti‐PD‐L1. F) Tumor weights of B16F10 tumor model mice subjected to different treatments on day 18 (n = 6). G) Kaplan‒Meier survival curves of the different treatment groups in the B16F10 tumor model (n = 6). H) Schematic diagram of the treatment procedures used in the humanized MDA‐MB‐231‐TNBC mouse model. I) Tumor volume after different treatments in a humanized breast cancer mouse model (n = 5), including PBS + IgG, anti‐PD‐1, OMV‐Ctrl, OMV‐C9I12, and OMV‐C9I12 + anti‐PD‐1. J) Tumor weights of humanized breast cancer model mice subjected to different treatments on day 33 (n = 5). The data in (B,E,I) are expressed as the mean ± SEM and are expressed as the means ± SDs for the remaining figures. Statistical significance was assessed using one‐way ANOVA, two‐way ANOVA or the log‐rank (Mantel–Cox) test. *P <0.05, **P < 0.01, ***P < 0.001; ns, nonsignificant.
Figure 5
Figure 5
OMV‐C9I12 effectively enhances the recruitment and activation of T cells to synergize with immunotherapy in various tumor models. The expression of A) CXCL9, B) IL‐12, and C) IFNγ in MB49 tumor tissues was measured via ELISA (n = 5). Percentages of D) CD45+ cells, E) CD3+ T cells, F) CD8+ T cells, G) IFNγ+CD8+ T cells, and H) Granzyme B+CD8+ T cells in MB49 tumor tissues from different groups (n = 5). Percentages of I) CD3+ T cells, J) CD8+ T cells, K) Foxp3+CD25+CD4+ T cells, and L) IFNγ+CD8+ T cells in B16F10 tumor tissues from different groups (n = 5). M) Immunofluorescence staining of CD3 (red) and Granzyme B (green) in B16F10 tumor tissues from different groups (n = 5). Scale bar, 100 µm. Percentages of N) CD3+ T cells, O) CD8+ T cells, P) CD69+CD3+ T cells, and Q) CD69+CD8+ T cells in MDA‐MB‐231 tumor tissues from different groups (n = 5). The data are expressed as the means ± SDs. Statistical significance was assessed using one‐way ANOVA. *P <0.05, **P < 0.01, ***P < 0.001; ns, nonsignificant.
Figure 6
Figure 6
OMV‐C9I12 promotes the chemotaxis and activation of T cells and antitumor immune responses in MB49 bladder cancer. A) Uniform Manifold Approximation and Projection (UMAP) of CD45+ cell clusters in scRNA‐seq. B) Heatmap of markers used for CD45+ cell clustering. C) Gene Ontology (GO) analysis and D) Kyoto Encyclopedia of Genes and Genomes (KEGG) analysis of significantly altered genes after OMV‐C9I12 treatment compared with the PBS control in T cells. E) Pathway analysis of upregulated genes associated with T‐cell chemotaxis, activation, and the immune response. Gene set enrichment analysis (GSEA) of the F) T‐cell migration signaling pathway, G) regulation of the T‐cell activation signaling pathway, and the H) JAK‐STAT signaling pathway in T cells between the OMV‐C9I12‐treated group and the PBS control group. I) Heatmap of increased gene expression in T cells associated with immune activation and the cytokine response after OMV‐C9I12 treatment. Mean expression of the Cxcr3, Il12rb1, and Il12rb2 genes in J) different cell types and in K) different T‐cell subpopulations after OMV‐C9I12 treatment.
Figure 7
Figure 7
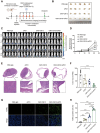
Therapeutic efficacy of intravesical instillation of engineered OMV‐C9I12 in a humanized orthotopic bladder cancer mouse model. A) Schematic diagram of treatment procedures in the humanized mouse model of T24 tumor cells. B) Photographs of excised bladders from mice subjected to different treatments, including PBS + IgG, anti‐PD‐1, OMV‐C9I12, and OMV‐C9I12 + anti‐PD‐1, on day 21 (n = 5). C) In vivo bioluminescence images and D) quantitative bioluminescence intensity of orthotopic bladder cancer model mice subjected to different treatments at 0, 7, 14, and 21 days after instillation. E) Representative H&E staining images of whole‐bladder tissue sections from mice subjected to different treatments on day 21. Scale bar, 1 mm (upper panel); 100 µm (lower panel). F) Quantification of tumor sizes on the basis of whole‐bladder tissue sections (n = 5). G) Representative TUNEL staining images of bladder tumor sections after different treatments on day 21. Scale bar, 50 µm. H) Percentages of TUNEL‐positive cells in tumor tissues after different treatments (n = 5). The data are expressed as the means ± SDs. Statistical significance was assessed using one‐way ANOVA or two‐way ANOVA. *P <0.05, **P < 0.01, ***P < 0.001; ns, nonsignificant.

References

    1. Zhang Y., Zhang Z., Cell Mol. Immunol. 2020, 17, 807. - PMC - PubMed
    1. a) Sharma P., Allison J. P., Science 2015, 348, 56; - PubMed
    2. b) Waldman A. D., Fritz J. M., Lenardo M. J., Nat. Rev. Immunol. 2020, 20, 651. - PMC - PubMed
    1. a) Haslam A., Prasad V., JAMA Netw. Open 2019, 2, 192535; - PMC - PubMed
    2. b) Jiang Y., Zhao X., Fu J., Wang H., Front. Immunol. 2020, 11, 339. - PMC - PubMed
    1. a) Galon J., Bruni D., Nat. Rev. Drug Discovery 2019, 18, 197; - PubMed
    2. b) Vesely M. D., Zhang T., Chen L., Annu. Rev. Immunol. 2022, 40, 45; - PubMed
    3. c) Zhang J., Huang D., Saw P. E., Song E., Trends Immunol. 2022, 43, 523. - PubMed
    1. a) O'Donnell J. S., Teng M. W. L., Smyth M. J., Nat. Rev. Clin. Oncol. 2019, 16, 151; - PubMed
    2. b) Jansen C. S., Prokhnevska N., Master V. A., Sanda M. G., Carlisle J. W., Bilen M. A., Cardenas M., Wilkinson S., Lake R., Sowalsky A. G., Valanparambil R. M., Hudson W. H., McGuire D., Melnick K., Khan A. I., Kim K., Chang Y. M., Kim A., Filson C. P., Alemozaffar M., Osunkoya A. O., Mullane P., Ellis C., Akondy R., Im S. J., Kamphorst A. O., Reyes A., Liu Y., Kissick H., Nature 2019, 576, 465. - PMC - PubMed

LinkOut - more resources