. 2025 Jun;292(2048):20241885.
doi: 10.1098/rspb.2024.1885. Epub 2025 Jun 11.

Local human impacts interact with geography to drive benthic community depth zonation on contemporary coral reefs

Affiliations

Local human impacts interact with geography to drive benthic community depth zonation on contemporary coral reefs

Rebecca J Turner et al. Proc Biol Sci. 2025 Jun.

Abstract

Changes in biophysical conditions and energetic resource supply across depths are predicted to promote or limit the abundance of different coral reef benthic groups. However, the degree to which regional differences in biophysical processes govern and local human activities might alter naturally occurring depth zonation patterns remains unclear. Here, we used 2239 reef surveys conducted between 0 and 30 m depth around 33 islands (18 unpopulated and 15 populated) across the Pacific Ocean to quantify the percentage cover change of seven broad benthic groups. We tested whether natural depth zonation patterns differed across geographies (using six ecoregions) and whether and how local human impacts might disrupt these natural zonation patterns. We found benthic community depth zonation did not always occur. At the three ecoregions where depth zonation existed, there was no universal 'natural' zonation pattern and the benthic groups most responsible for driving patterns of depth zonation differed across geographies. We also found evidence of human-disrupted changes to benthic community depth zonation; patterns were inversed across depths and less distinct at populated compared to unpopulated islands within two ecoregions. We show coral reef communities are naturally highly variable and that human activities can disrupt natural patterns of ecological organization in contemporary ecosystems.

Keywords: Pacific Ocean; anthropogenic impacts; benthic assemblages; depth strata; spatial heterogeneity; vertical zonation.


Conflict of interest statement

We declare we have no competing interests.

Figures

Our 33 study islands within six marine ecoregions across the Pacific Ocean
Figure 1.
Our 33 study islands within six marine ecoregions across the Pacific Ocean. Benthic community data were collected using 2239 reef surveys at unpopulated (triangles; n = 18) and populated (circles; n = 15) islands.
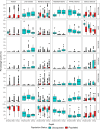
Variation in percentage cover of seven benthic groups
Figure 2.
Variation in percentage cover of seven benthic groups: scleractinian (hard) coral, crustose coralline algae (CCA), soft coral, Halimeda, fleshy upright macroalgae (MA), encrusting macroalgae (EMA) and turf algae, between depth strata (shallow: 0−6 m, mid: >6−18 m, deep: >18−30 m) for unpopulated (blue) and populated (red) islands and atolls across six ecoregions in the Pacific Ocean. The central line within the box shows the median percentage cover, the upper and lower lines correspond to the first and third quartiles, respectively (25th and 75th percentiles). Whiskers show confidence intervals of 95% from the median, and dots indicate datapoints which are beyond the confidence intervals. Note different scales for percentage cover on the y-axes. Number of unpopulated versus populated islands within each ecoregion (and their respective number of survey sites in parentheses) is as follows. Hawaii Islands: unpopulated n = 1, populated n = 7 (6:755); Line Islands: unpopulated n = 3, populated n = 0 (98:0); Mariana Islands: unpopulated n = 8, populated n = 5 (354:473); Marshall Island: unpopulated n = 1, populated n = 0 (65:0); Phoenix, Tokelau and Northern Cook (PTNC) Islands: unpopulated n = 3, populated n = 0 (121:0); Samoa Islands: unpopulated n = 2, populated n = 3 (58:309). Total number of sampling stations (unique site/depth combinations) for each of the 33 islands and atolls (A) in our study are as follows (with number of depth strata replicates for shallow:mid:deep shown in parentheses): Niihau-Lehua 59 (20:21:18), Hawaii 124 (29:59:36), Kauai 74 (18:31:25), Lanai 87 (39:33:15), Maui 122 (37:57:28), Molokai 119 (36:44:39), Johnston (A) 6 (2:2:2), Alamagan 22 (4:10:8), Guguan 26 (6:10:10), Agrihan 20 (8:4:8), Sarigan 25 (6:10:9), Asuncion 53 (10:27:16), Farallon de Pajaros 30 (8:14:8), Maug 89 (14:50:25), Pagan 89 (18:33:38), Aguijan 29 (8:11:10), Guam 240 (84:81:75), Rota 61 (18:24:19), Saipan 98 (20:32:46), Tinian 45 (10:18:17), Wake (A) 65 (19:27:19), Baker 23 (5:11:7), Howland 36 (6:19:11), Swains 62 (20:22:20), Jarvis 42 (10:24:8), Kingman (A) 15 (3:9:5), Palymra (A) 41 (8:16:17), Rose (A) 56 (15:24:17), South Bank 2 (0:0:2), Ofu & Olosega 60 (17:21:22), Tau 46 (9:20:17), Tutuila 203 (46:85:72).
Canonical analysis of principal coordinates (CAP)
Figure 3.
Canonical analysis of principal coordinates (CAP), showing changes in coral reef benthic community structure across depth strata (shallow: 0−6 m, mid: >6−18 m, deep: >18−3 0 m) for unpopulated (a) and populated (b) islands in the Mariana ecoregion and the unpopulated islands in the Marshall (c) and Samoa (d) ecoregions. These ecoregions were found to have significant differences in benthic community structure across depth strata (where p ≤ 0.05). The closer points appear, the more similar their benthic communities. Vector lines represent Pearson’s correlations (r) which are plotted for seven benthic groups: hard (scleractinian) coral, crustose coralline algae (CCA), soft coral, Halimeda, fleshy upright macroalgae, encrusting macroalgae and turf algae. The direction of the vector indicates the relationship of each benthic variable to the groupings in multivariate space, and the vector length is proportional to the strength of the correlation, with the circle representing r = 1. Benthic groups labelled are indicator groups, identified as the variables with the strongest correlations (r ≥ 0.5) with the first two CAP axes. See the electronic supplementary material S2.1 for full CAP results.
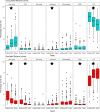
Percentage cover of seven benthic groups: hard (scleractinian) coral,
Figure 4.
Percentage cover of seven benthic groups: hard (scleractinian) coral, crustose coralline algae (CCA), soft coral, Halimeda, fleshy upright macroalgae, encrusting macroalgae (EMA) and turf algae, across depth strata (shallow: 0−6 m, mid: >6−18 m, deep: >18−30 m) for the unpopulated and populated Mariana ecoregion. Box plots are shown for each depth stratum, showing median values (horizontal lines), boxes for values in the 25th−75th percentiles, vertical lines for values less than the 25th percentile and greater than the 75th and outliers (solid black circles). Black stars indicate benthic indicator groups (variables with the strongest correlations, r ≥ 0.5). At the unpopulated and populated islands of the Mariana ecoregion, significant differences (where p ≤ 0.05) were observed across shallow (0−6 m) to mid (>6−18 m) and shallow (0−6 m) to deep (>18−30 m) depth strata.
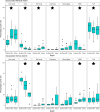
Percentage cover of seven benthic groups: hard (scleractinian) coral
Figure 5.
Percentage cover of seven benthic groups: hard (scleractinian) coral, crustose coralline algae (CCA), soft coral, Halimeda, fleshy upright macroalgae, encrusting macroalgae (EMA) and turf algae, across depth strata (shallow: 0−6 m, mid: >6−18 m, deep: >18−30 m) for the unpopulated Marshall and Samoa ecoregions. Box plots are shown for each depth stratum, showing median values (horizontal lines), boxes for values in the 25th−75th percentiles, vertical lines for values less than the 25th percentile and greater than the 75th and outliers (solid black circles). Black stars indicate benthic indicator groups (variables with the strongest correlations, r ≥ 0.5). At the unpopulated islands of the Marshall and Samoa ecoregions, significant differences in benthic community structure between all three depth strata were observed.

Similar articles

References

    1. Odum EP. 1969. The strategy of ecosystem development: an understanding of ecological succession provides a basis for resolving man’s conflict with nature. Science 164, 262–270. ( 10.1126/science.164.3877.262) - DOI - PubMed
    1. Connell JH, Hughes TP, Wallace CC. 1997. A 30-year study of coral abundance, recruitment, and disturbance at several scales in space and time. Ecol. Monogr. 67, 461–489. ( 10.1890/0012-9615(1997)067[0461:aysoca]2.0.co;2) - DOI
    1. Chase J, Leibold M. 2009. Ecological niches: linking classical and contemporary approaches. Chicago, IL: University of Chicago Press.
    1. Hirzel AH, Le Lay G. 2008. Habitat suitability modelling and niche theory. J. Appl. Ecol. 45, 1372–1381. ( 10.1111/j.1365-2664.2008.01524.x) - DOI
    1. Keddy PA. 1989. Effects of competition from shrubs on herbaceous wetland plants: a 4-year field experiment. Can. J. Bot. 67, 708–716. ( 10.1139/b89-094) - DOI

LinkOut - more resources