

Alterations of serum metabolic profile in major depressive disorder: A case-control study in the Chinese population
- PMID: 40495854
- PMCID: PMC12146990
- DOI: 10.5498/wjp.v15.i5.102618
Alterations of serum metabolic profile in major depressive disorder: A case-control study in the Chinese population
Abstract
Background: Major depressive disorder (MDD) is characterized by persistent depressed mood and cognitive symptoms. This study aimed to discover biomarkers for MDD, explore its pathological mechanisms, and examine the associations of the identified biomarkers with clinical and psychological variables.
Aim: To discover candidate biomarkers for MDD identification and provide insight into the pathological mechanism of MDD.
Methods: The current study adopted a single-center cross-sectional case-control design. Serum samples were obtained from 100 individuals diagnosed with MDD and 97 healthy controls (HCs) aged between 18 to 60 years. Metabolomics was performed on an Ultimate 3000 UHPLC system coupled with Q-Exactive MS (Thermo Scientific). The online software Metaboanalyst 6.0 was used to process and analyze the acquired raw data of peak intensities from the instrument.
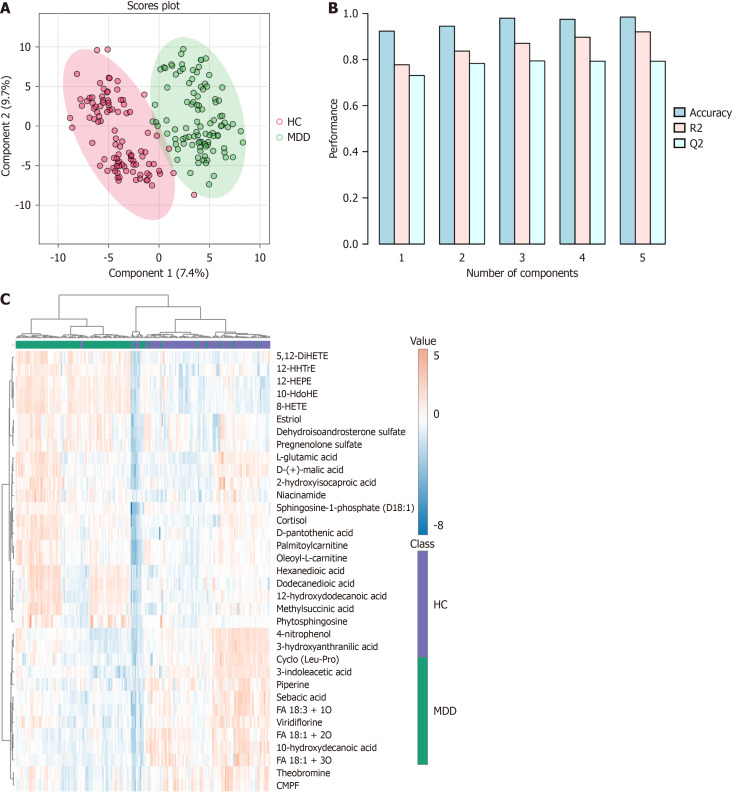
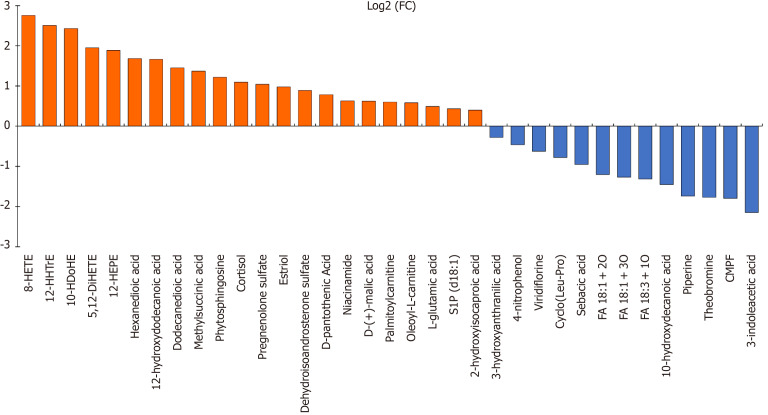
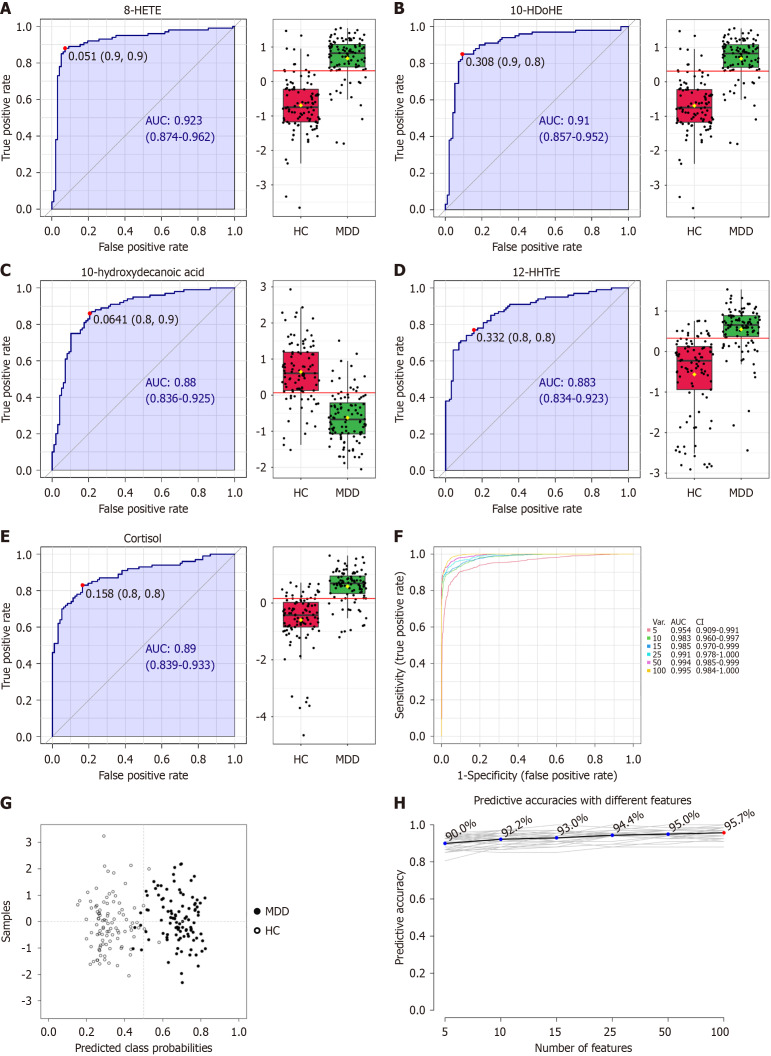
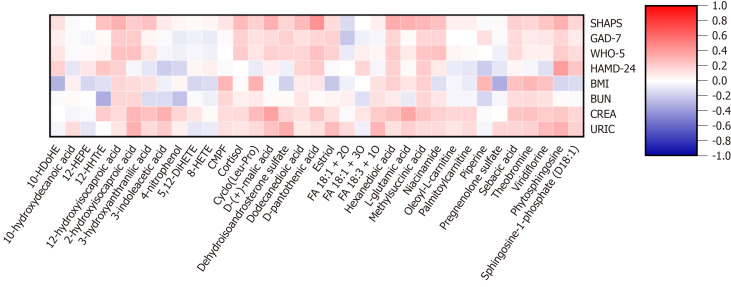
Results: The study included 100 MDD patients and 97 HCs. Metabolomic profiling identified 35 significantly different metabolites (e.g., cortisol, sebacic acid, and L-glutamic acid). Receiver operating characteristic curve analysis highlighted 8-HETE, 10-HDoHE, cortisol, 12-HHTrE, and 10-hydroxydecanoic acid as top diagnostic biomarkers for MDD. Significant correlations were found between metabolites (e.g., some lipids, steroids, and amino acids) and clinical and psychological variables.
Conclusion: Our study reported metabolites (some lipids, steroids, amino acids, carnitines, and alkaloids) responsible for discriminating MDD patients and HCs. This metabolite profile may enable the development of a laboratory-based diagnostic test for MDD. The mechanisms underlying the association between psychological or clinical variables and differential metabolites deserve further exploration.
Keywords: Clinical variables; Major depressive disorder; Metabolites; Psychological variables; Serum metabolic profiling.
©The Author(s) 2025. Published by Baishideng Publishing Group Inc. All rights reserved.
Conflict of interest statement
Conflict-of-interest statement: The authors declare no conflict of interests for this article.
Figures
Similar articles
-
The Utility of Amino Acid Metabolites in the Diagnosis of Major Depressive Disorder and Correlations with Depression Severity.Int J Mol Sci. 2023 Jan 23;24(3):2231. doi: 10.3390/ijms24032231. Int J Mol Sci. 2023. PMID: 36768551 Free PMC article.
-
Interpretation of the pathogenesis and therapeutic mechanisms of first-episode major depressive disorder based on multiple amino acid metabolic pathways: a metabolomics study.Metab Brain Dis. 2024 Nov 22;40(1):37. doi: 10.1007/s11011-024-01427-3. Metab Brain Dis. 2024. PMID: 39576355
-
Non-targeted Metabolomics Profiling of Plasma Samples From Patients With Major Depressive Disorder.Front Psychiatry. 2022 Feb 21;12:810302. doi: 10.3389/fpsyt.2021.810302. eCollection 2021. Front Psychiatry. 2022. PMID: 35264984 Free PMC article.
-
The potential for metabolomics in the study and treatment of major depressive disorder and related conditions.Expert Rev Proteomics. 2020 Apr;17(4):309-322. doi: 10.1080/14789450.2020.1772059. Epub 2020 Jun 9. Expert Rev Proteomics. 2020. PMID: 32516008 Review.
-
The contribution of polyamine pathway to determinations of diagnosis for treatment-resistant depression: A metabolomic analysis.Prog Neuropsychopharmacol Biol Psychiatry. 2024 Jan 10;128:110849. doi: 10.1016/j.pnpbp.2023.110849. Epub 2023 Sep 1. Prog Neuropsychopharmacol Biol Psychiatry. 2024. PMID: 37659714 Review.
References
-
- Otte C, Gold SM, Penninx BW, Pariante CM, Etkin A, Fava M, Mohr DC, Schatzberg AF. Major depressive disorder. Nat Rev Dis Primers. 2016;2:16065. - PubMed
-
- Fekadu A, Demissie M, Birhane R, Medhin G, Bitew T, Hailemariam M, Minaye A, Habtamu K, Milkias B, Petersen I, Patel V, Cleare AJ, Mayston R, Thornicroft G, Alem A, Hanlon C, Prince M. Under detection of depression in primary care settings in low and middle-income countries: a systematic review and meta-analysis. Syst Rev. 2022;11:21. - PMC - PubMed
-
- Zhang X, Zhang Z, Diao W, Zhou C, Song Y, Wang R, Luo X, Liu G. Early-diagnosis of major depressive disorder: From biomarkers to point-of-care testing. TrAC Trend Anal Chem. 2023;159:116904.
LinkOut - more resources
Full Text Sources
