. 2025 May 27:17:1562065.
doi: 10.3389/fnsyn.2025.1562065. eCollection 2025.

Differential Ca2+ handling by isolated synaptic and non-synaptic mitochondria: roles of Ca2+ buffering and efflux

Affiliations

Differential Ca2+ handling by isolated synaptic and non-synaptic mitochondria: roles of Ca2+ buffering and efflux

Jyotsna Mishra et al. Front Synaptic Neurosci. .

Abstract

Mitochondria regulate intracellular calcium ion (Ca2+) signaling by a fine-tuned process of mitochondrial matrix (m) Ca2+ influx, mCa2+ buffering (sequestration) and mCa2+ release (Ca2+ efflux). This process is critically important in the neurosynaptic terminal, where there is a simultaneous high demand for ATP utilization, cytosolic (c) Ca2+ regulation, and maintenance of ionic gradients across the cell membrane. Brain synaptic and non-synaptic mitochondria display marked differences in Ca2+ retention capacity. We hypothesized that mitochondrial Ca2+ handling in these two mitochondrial populations is determined by the net effects of Ca2+ uptake, buffering or efflux with increasing CaCl2 boluses. We found first that synaptic mitochondria have a more coupled respiration than non-synaptic mitochondria; this may correlate with the higher local energy demand in synapses to support neurotransmission. When both mitochondrial fractions were exposed to increasing mCa2+ loads we observed decreased mCa2+ sequestration in synaptic mitochondria as assessed by a significant increase in the steady-state free extra matrix Ca2+ (ss[Ca2+]e) compared to non-synaptic mitochondria. Since, non-synaptic mitochondria displayed a significantly reduced ss[Ca2+]e, this suggested a larger mCa2+ buffering capacity to maintain [Ca2+]m with increasing mCa2+ loads. There were no differences in the magnitude of the transient depolarizations and repolarizations of the membrane potential (ΔΨm) and both fractions exhibited similar gradual depolarization of the baseline ΔΨm during additional CaCl2 boluses. Adding the mitochondrial Na+/Ca2+ exchanger (mNCE) inhibitor CGP37157 to the mitochondrial suspensions unmasked the mCa2+ sequestration and concomitantly lowered ss[Ca2+]e in synaptic vs. non-synaptic mitochondria. Adding complex V inhibitor oligomycin plus ADP (OMN + ADP) bolstered the matrix Ca2+ buffering capacity in synaptic mitochondria, as did Cyclosporin A (CsA), in non-synaptic. Our results display distinct differences in regulation of the free [Ca2+]m to prevent collapse of ΔΨm during mCa2+ overload in the two populations of mitochondria. Synaptic mitochondria appear to rely mainly on mCa2+ efflux via mNCE, while non-synaptic mitochondria rely mainly on Pi-dependent mCa2+ sequestration. The functional implications of differential mCa2+ handling at neuronal synapses may be adaptations to cope with the higher metabolic activity and larger mCa2+ transients at synaptosomes, reflecting a distinct role they play in brain function.

Keywords: Ca2+ buffering; Ca2+ efflux; bioenergetics; non-synaptic mitochondria; synaptic mitochondria.


Conflict of interest statement

The authors declare that the research was conducted in the absence of any commercial or financial relationships that could be construed as a potential conflict of interest. The author(s) declared that they were an editorial board member of Frontiers, at the time of submission. This had no impact on the peer review process and the final decision.

Figures
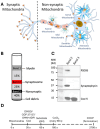
Figure 1
Figure 1
Synaptic and non-synaptic mitochondria isolation and experimental timeline to study Ca2+ handling and bioenergetics in isolated synaptic and non-synaptic mitochondria. (A) Compartmental distribution of mitochondria in subcellular location of neurons and glial cells. Synaptic mitochondria are located within the synaptosome while non-synaptic mitochondria are derived from soma, glial and vascular cells. (B) Schematic diagram of visible bands seen upon ultracentrifugation as described in materials and methods. The synaptosome (band 2; red color) and non-synaptic (band 3; black color) fractions are indicated in their respective gradients following ultracentrifugation. (C) Representative western blot of synaptosome markers in isolated synaptic (band 2) and non-synaptic (band 3) fractions. (D) Timeline of the experimental protocol (in seconds) for isolated synaptic and non-synaptic mitochondria. Different interventions, such as CGP 37157 (2 μM), oligomycin (OMN; 10 μM) + ADP (250 μM) and CsA (0.5 μM) were added at 30 s, followed by the addition of the substrates [Na+-glutamate + Na+-malate (GM)] at 60 s. At 180 s, 40 μM of CaCl2 was added, followed by sequential additions of 40 μM CaCl2 at every 90 s intervals. CCCP (10 μM) was added at the end of each experiment to achieve the maximal dye release from mitochondria to terminate the experiment.
Figure 2
Figure 2
Representative traces of O2 consumption rate (OCR) of isolated synaptic and non-synaptic mitochondria. Complex I substrates [Na+-glutamate + Na+-malate (GM)] and ADP were sequentially injected to assess mitochondrial OCR, the slope, at the different respiratory states. The Respiratory Control Index (RCI) is derived from the ratio of the OCR during state 3 (in the presence of ADP) to the OCR during state 4 (after exhausting the added ADP) respiration. The insets show average RCI of synaptic and non-synaptic mitochondria. Data are expressed as mean ± SEM (*p < 0.0001).
Figure 3
Figure 3
Comparison of synaptic and non-synaptic mitochondria Ca2+ handling. (A) Representative traces of extra-matrix Ca2+ ([Ca2+]e) measured with the Ca2+-sensitive ratiometric dye Fura-4FF in synaptic and non-synaptic mitochondria. (B) Change of ΔΨm in synaptic and non-synaptic mitochondria measured using the ΔΨm sensitive dye TMRM (tetramethylrhodamine methyl ester perchlorate). Synaptic (red trace) and non-synaptic (black trace) mitochondria were energized with complex I substrates, [Na+-glutamate + Na+-malate (GM)] at 60 s and 40 μM CaCl2 pulses were added at every 90 s, followed by addition of 10 μM CCCP at the end of the experiment. The insets show quantification of steady-state [Ca2+]e (A) and ΔΨm (B). Error bars represent mean ± SEM (*p < 0.05).
Figure 4
Figure 4
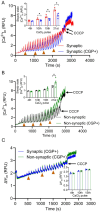
Effect of CGP on extra-mitochondrial calcium ([Ca2+]e) dynamics of synaptic and non-synaptic mitochondria. Representative traces of extra-matrix Ca2+ ([Ca2+]e) measured with the Ca2+-sensitive ratiometric dye Fura-4F in isolated synaptic (A) and non-synaptic (B) mitochondria in the presence and absence of CGP. Changes in ΔΨm in CGP-treated synaptic and non-synaptic mitochondria (C) measured using the ΔΨm sensitive dye TMRM (tetramethylrhodamine methyl ester perchlorate). 2 μM CGP was added in synaptic (blue trace) and non-synaptic (green trace) mitochondria at 30 s, followed by the addition of complex I substrates, [Na+-glutamate + Na+-malate (GM)] at 60 s. 40 μM CaCl2 pulses were added at every 90 s, and 10 μM CCCP was given at the end of the experiment. The insets show quantification of steady-state [Ca2+]e (A,B) and ΔΨm (C) after a cumulative addition of 160, 400, 600, and 840 μM CaCl2. Error bars represent mean ± SEM (*p < 0.05).
Figure 5
Figure 5
Effect of OMN + ADP on extra-mitochondrial calcium ([Ca2+]e) dynamics of synaptic and non-synaptic mitochondria. Representative traces of extra-matrix Ca2+ ([Ca2+]e) measured with the Ca2+-sensitive ratiometric dye Fura-4F in an isolated synaptic (A) and non-synaptic (B) mitochondria. 10 μM OMN and 250 μM ADP (OMN + ADP) were added in synaptic (blue trace) and non-synaptic (green trace) mitochondria at 30 s followed by the addition of the complex I substrates, [Na+-glutamate + Na+-malate (GM)] at 60 s. 40 μM CaCl2 pulses were added at every 90 s, and 10 μM CCCP was added at the end of each experiment. Quantification of steady-state [Ca2+]e after a cumulative addition of 160, 400, and 600 μM CaCl2 (C). Change in ΔΨm in OMN + ADP-treated synaptic and non-synaptic mitochondria were measured using the ΔΨm sensitive dye TMRM (tetramethylrhodamine methyl ester perchlorate) (D). The insets (A,B) show [Ca2+]m uptake kinetics in detail. The inset (D) shows ΔΨm after a cumulative addition of 160, 400, and 600 μM CaCl2. Error bars represent mean ± SEM (*p < 0.05).
Figure 6
Figure 6
Effect of CsA on extra-mitochondrial calcium ([Ca2+]e) dynamics of synaptic and non-synaptic mitochondria. Representative traces of extra-matrix Ca2+ ([Ca2+]e) were measured with the Ca2+-sensitive ratiometric dye Fura-4FF in an isolated synaptic (A) and non-synaptic (B) mitochondria. 0.5 μM CsA was added in synaptic (blue trace) and non-synaptic (green trace) mitochondria at 30 s followed by the addition of complex I substrates, [Na+-glutamate + Na+-malate (GM)] at 60 s. 40 μM CaCl2 pulses were added at every 90 s, and 10 μM CCCP was added at the end of each experiment. Quantification of steady-state [Ca2+]e after a cumulative addition of 160, 400, 600, and 840 μM CaCl2 (C). Change in ΔΨm of OMN + ADP-treated synaptic and non-synaptic mitochondria were measured using the ΔΨm sensitive dye TMRM (tetramethylrhodamine methyl ester perchlorate) (D). Inset (D) shows ΔΨm after a cumulative addition of 160, 400, and 600 μM CaCl2. Error bars represent mean ± SEM (*p < 0.05).
Figure 7
Figure 7
Assessment of synaptic (S) and non-synaptic (NS) mitochondrial proteins associated with mitochondrial bioenergetics and Ca2+ handling. Representative immunoblots (A) and quantification of the relative protein expressions of mCU (B), VDAC (C), ANT1 (D) and CyP D (E) in synaptic and non-synaptic mitochondria normalized to the mitochondrial housekeeping protein, COX IV. Error bars represent mean ± SEM (*p < 0.05 and **p < 0.01).

Similar articles

References

    1. Aklima J., Onojima T., Kimura S., Umiuchi K., Shibata T., Kuraoka Y., et al. (2021). Effects of matrix pH on spontaneous transient depolarization and reactive oxygen species production in mitochondria. Front. Cell Dev. Biol. 9:692776. doi: 10.3389/fcell.2021.692776, PMID: - DOI - PMC - PubMed
    1. Aldakkak M., Camara A. K., Heisner J. S., Yang M., Stowe D. F. (2011). Ranolazine reduces Ca2+ overload and oxidative stress and improves mitochondrial integrity to protect against ischemia reperfusion injury in isolated hearts. Pharmacol. Res. 64, 381–392. doi: 10.1016/j.phrs.2011.06.018, PMID: - DOI - PMC - PubMed
    1. Aldakkak M., Stowe D. F., Dash R. K., Camara A. K. (2013). Mitochondrial handling of excess Ca2+ is substrate-dependent with implications for reactive oxygen species generation. Free Radic. Biol. Med. 56, 193–203. doi: 10.1016/j.freeradbiomed.2012.09.020, PMID: - DOI - PMC - PubMed
    1. Andreyev A. Y., Fahy B., Fiskum G. (1998). Cytochrome C release from brain mitochondria is independent of the mitochondrial permeability transition. FEBS Lett. 439, 373–376. doi: 10.1016/s0014-5793(98)01394-5, PMID: - DOI - PubMed
    1. Banaclocha M. M., Hernandez A. I., Martinez N., Ferrandiz M. L. (1997). N-acetylcysteine protects against age-related increase in oxidized proteins in mouse synaptic mitochondria. Brain Res. 762, 256–258. doi: 10.1016/s0006-8993(97)00493-9, PMID: - DOI - PubMed

LinkOut - more resources