. 2025 Dec;19(1):88.
doi: 10.1007/s11571-025-10281-7. Epub 2025 Jun 9.

Sound intensity-dependent cortical activation: implications of the electrical and vascular activity on auditory intensity

Affiliations

Sound intensity-dependent cortical activation: implications of the electrical and vascular activity on auditory intensity

Vanesa Muñoz et al. Cogn Neurodyn. 2025 Dec.

Abstract

Recent studies combining electroencephalography (EEG) and functional near-infrared spectroscopy (fNIRS) have shown promising results linking neural and vascular responses. This study analyzes the topographical effect of auditory stimulus intensity on cortical activation and explores neurovascular coupling between fNIRS hemodynamic signals and auditory-evoked potentials (AEPs), extracted from EEG. Forty healthy volunteers (13 males, 27 females; mean age = 22.27 ± 3.96 years) listened to complex tones of varying intensities (50-, 70-, and 90-dB SPL) across seven frequencies (range of 400-2750 Hz) in blocks of five, while EEG and fNIRS were recorded. PERMANOVA analysis revealed that increasing intensity modulated hemodynamic activity, leading to amplitude changes and enhanced recruitment of auditory and prefrontal cortices. To isolate stimulus-specific activity, Spearman correlations were computed on residuals-components of AEPs and fNIRS responses with individual trends removed. The N1 amplitude increase was correlated with higher superior temporal gyrus (STG) and superior frontal gyrus (SFG) activity, and reduced activity in inferior frontal gyrus (IFG) for the oxygenated hemoglobin (HbO), while the deoxygenated hemoglobin (HbR) was associated with increased activity in one channel near the Supramarginal Gyrus (SMG). P2 amplitude increase was associated with higher activation in SFG and IFG for HbO, while for HbR with the activity in SMG, angular gyrus (AnG), SFG, and IFG. Additionally, internal correlations between fNIRS channels revealed strong associations within auditory and frontal regions. These findings provide insights into existing models of neurovascular coupling by showing how stimulus properties, such as intensity, modulate the relationship between neural activity and vascular responses.

Supplementary information: The online version contains supplementary material available at 10.1007/s11571-025-10281-7.

Keywords: AEPs; Auditory intensity; FNIRS; Neurovascular coupling.


Conflict of interest statement

Competing interestsThe authors declare no competing interests.

Figures

Fig. 1
Fig. 1
a Experimental protocol of the presented auditory stimulation. b Setup of fNIRS optodes and EEG electrodes; sources are shown in red, detectors in blue and EEG electrodes in green. The numbers correspond to the channel number (short channels in red font) and the lines show the channels formed by the optodes (auditory cortex: yellow; visual cortex: Green; Brodmann area 9-SFG: blue; Brodman area 45–47-IFG: orange). c Sensitivity maps created with AtlasViewer showing the coverage and depth of the fNIRS montage. ISI: Inter-Stimulus Interval, SPL: Sound Pressure Level
Fig. 2
Fig. 2
a Average of the electrodes and intensities in the EEG signal, to select the AEPs. b Average of the channels and intensities for the fNIRS channels, to select the time window. Each gray square shows the selected time window. c Event-related potentials at electrode Cz for the 5 tones delivered, showing a marked reduction in amplitude after the ST1
Fig. 3
Fig. 3
a Event-related potentials at electrode Cz showing the differential magnitude for each intensity presented. b Violin box plot for each of the event-related potentials showing the significant comparisons for each of them. The interception of the red line in the violin box plot coincides with the median. *p <.05 **p ≤.001
Fig. 4
Fig. 4
Block Average of the fNIRS signal by regions of interest (ROIs). The significant post-hoc interaction in the PERMANOVA is plotted next to the average figure for each ROI in a violin boxplot. The dotted lines indicated the changes in the deoxygenated hemoglobin. The red asterisk represents the ROIs with the effect of intensity in the PERMANOVA results. The red line in the violin boxplots represents the median. *p <.05 **p ≤.001. R IFG: Right Inferior Frontal Gyrus; R AC: Right auditory cortex; L AC: Left auditory cortex
Fig. 5
Fig. 5
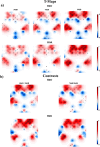
T-contrast map, for each of the a intensities and b their significant contrasts, for HbO and HbR. The significant channels are indicated with a circle and an asterisk (FDR corrected)
Fig. 6
Fig. 6
Spearman correlation matrix for the residuals of AEPs and the residuals of fNIRS betas. Only correlations that remained significant after false discovery rate (FDR) correction are shown. AC: Auditory cortex; VSC: Visual cortex; SFG: Superior frontal gyrus; MFG: Medial frontal gyrus; IFG: Inferior frontal gyrus; Int: Intensity
Fig. 7
Fig. 7
Representative linear regression plots for selected channels illustrating the relationship between auditory evoked potential residuals and fNIRS hemodynamic residuals. The topographies highlight the Spearman Correlation significant fNIRS channels for all electrodes associated with N1 and P2 in both HbO and HbR. Channels in blue on the topographies indicate negative correlations, while red channels indicate positive correlations. Channels marked with dashed lines are those plotted in the regression

Similar articles

References

    1. Aasted CM, Yücel MA, Cooper RJ, Dubb J, Tsuzuki D, Becerra L, Petkov MP, Borsook D, Dan I, Boas DA (2015) Anatomical guidance for functional near-infrared spectroscopy: atlasviewer tutorial. Neurophotonics 2(2):020801. 10.1117/1.NPh.2.2.020801 - PMC - PubMed
    1. Alcaini M, Giard MH, Thévenet M, Pernier J (1994) Two separate frontal components in the N1 wave of the human auditory evoked response. Psychophysiology 31(6):611–615. 10.1111/j.1469-8986.1994.tb02354.x - PubMed
    1. Aron AR, Robbins TW, Poldrack RA (2004) Inhibition and the right inferior frontal cortex. Trends Cogn Sci 8(4):170–177. 10.1016/j.tics.2004.02.010 - PubMed
    1. Atienza M, Cantero JL, Gómez CM (2001) The initial orienting response during human REM sleep as revealed by the N1 component of auditory event-related potentials. Int J Psychophysiol off J Int Organiz Psychophysiol 41(2):131–141. 10.1016/s0167-8760(00)00196-3 - PubMed
    1. Attwell D, Buchan AM, Charpak S, Lauritzen M, Macvicar BA, Newman EA (2010) Glial and neuronal control of brain blood flow. Nature 468(7321):232–243. 10.1038/nature09613 - PMC - PubMed

LinkOut - more resources