. 2025 Sep;73(9):1910-1924.
doi: 10.1002/glia.70048. Epub 2025 Jun 11.

Drebrin Upregulation Regulates Astrocyte Polarization and Supports Tissue Recovery After Spinal Cord Injury in Mice

Affiliations

Drebrin Upregulation Regulates Astrocyte Polarization and Supports Tissue Recovery After Spinal Cord Injury in Mice

Barbora Smejkalová et al. Glia. 2025 Sep.

Abstract

Spinal cord injury (SCI) results in significant disruption of nerve fibers responsible for transmitting signals between the brain and body, often leading to partial or complete motor, sensory, and autonomic dysfunction below the injury site. Astrocytes are an important component in scar formation, crucial for suppression of injury propagation, effective wound healing, and the regulation of neuronal plasticity. Here, we identify the role of the actin-binding protein Drebrin (DBN) in reactive astrogliosis following SCI. SCI induces the upregulation of DBN in astrocytes, which controls immediate injury containment but also the long-term preservation of tissue integrity and healing in the spinal cord. DBN knockout results in enlarged spinal cord lesions, increased immune cell infiltration, and neurodegeneration. Mechanistically, DBN loss disrupts the polarization of scar border-forming astrocytes, leading to impaired encapsulation of the injury. In summary, DBN serves as a pivotal regulator of SCI outcome by modulating astrocytic polarity, which is essential for establishing a protective barrier confining the lesion site.

Keywords: immune cell infiltration; neurodegeneration; reactive astrogliosis; spinal cord injury.


Conflict of interest statement

The authors declare no conflicts of interest.

Figures

FIGURE 1
FIGURE 1
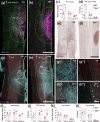
DBN is upregulated in astrocytes after thoracic spinal cord injury. Sections were triple‐stained with antibodies against DBN, GFAP and IBA1. (a) Overview of the lesion site in WT mice at 7 days post injury (early) timepoint labeled with anti‐GFAP and anti‐DBN antibodies, scale bar 500 μm. (b, c) close‐up images of the GFAP and DBN signal at the lesion site (b) and far from lesion site ((c), arrow in (a), 2500 μm far) respectively, scale bar 50 μm. (b’, c’)—Co‐localization analysis of GFAP and DBN immunoreactivity corresponding to (b) and (c), respectively. DBN co‐localization relative to GFAP is visualized as heatmap. (d) Overview of lesion site in WT mice 7 days post injury labeled with anti‐ DBN and anti‐IBA1 antibodies, scale bar 500 μm. (e, f) Close up images of the DBN and IBA1 immunoreactivity at the lesion site (e) and far from lesion site ((f) arrow in (d), 2500 μm far) respectively, scale bar 50 μm. (e’, f’) Co‐localization analysis of the DBN and IBA1 signals corresponding to (e) and (f), respectively. DBN co‐localization relative to IBA1 is visualized as heatmap. Note that panels (a–c) and (d–f) depict the same regions but are presented separately to allow distinct assessment of DBN co‐localization with either GFAP or IBA1.
FIGURE 2
FIGURE 2
MRI of whole spinal cords 7 days post thoracic spinal cord injury—(a) T2*MRI image showing WT spinal cord 7 days post injury (left image), overlay of the image with highlighted lesion core (green) and injury spread area (mangenta, center image), and a corresponding 3D reconstruction with highlighted lesion core and injury spread (right image). Scale bar 1 mm. (b) MRI image showing a Dbn −/− spinal cord 7 days post injury (left image), overlay of the image with highlighted lesion core (green) and injury spread area (mangenta, center image), and a corresponding 3D reconstruction with highlighted lesion core and injury spread (right image). Scale bar 1 mm. (c) Quantification of the lesion volume from the 3D MRI reconstruction, data shown as mean ± SEM (N = 3), ns p ≥ 0.05, *p < 0.05, **p < 0.01, ***p < 0.001, ****p < 0.0001, t‐test, Two‐tailed.
FIGURE 3
FIGURE 3
Altered astrocyte reactivity and scar formation following thoracic SCI in Dbn −/− mice—Representative images of GFAP immunoreactivity in WT tissue at (a) early timepoint (1–2 weeks), (b) an intermediate timepoint (4 weeks) and (c) a late timepoint (8 weeks) following SCI. Representative images of GFAP immunoreactivity in Dbn −/− tissue at (d) an early timepoint (1–2 weeks), (e) an intermediate timepoint (4 weeks), and (f) a late timepoint (8 weeks) following SCI, scale bars 500 μm. Graphs representing quantification of lesion size (g), GFAP intensity (h) and solidity index (i). Data shown as mean ± SEM, early timepoint (N = 5), intermediate and late timepoints (N = 3), ns p ≥ 0.05, *p < 0.05, **p < 0.01, ***p < 0.001, ****p < 0.0001, two‐way ANOVA, Bonferroni‐Šídák's multiple comparison test.
FIGURE 4
FIGURE 4
Behavioral analyses of WT and Dbn −/− mice following thoracic SCI—Results of motor tests of WT and Dbn −/− animals after SCI. Mice were pre‐tested before injury and then tested at 2, 4, 6, and 8 weeks post injury. (a) Basso Mouse Scale, (b) Rotarod maximum speed test, (c) Metz‐Whishaw score from ladder rung walking test (with unevenly spaced rungs). Data shown as mean ± SEM (N = 8–9 animals per group). ns p ≥ 0.05, *p < 0.05, **p < 0.01, ***p < 0.001, ****p < 0.0001, two‐way ANOVA, Bonferroni‐Šídák's multiple comparison test.
FIGURE 5
FIGURE 5
Immune cell reactivity after SCI differs in WT and Dbn −/− tissue—WT (a) and Dbn −/− (b) tissue was labeled at early timepoint with IBA1 and GFAP antibodies. Graphs show quantifications of IBA1 signal intensity (c) and area coverage (d). Oil Red O and hematoxylin staining in WT (e) and Dbn −/− (f) tissue. Analysis of Arg1 and iNOS signal in (g) WT and (h) Dbn −/− tissue, scale bar 500 μm. Details from WT tissue taken from lesion (g‘) and far from lesion (g”). Details from Dbn −/− tissue taken from lesion (h‘) and far from lesion (h”), scale bar 100 μm. White arrowheads show areas of increased iNOS positivity. Graphs show quantifications of iNOS (i, j) and Arg1 (k, l) intensity and area coverage, respectively. Measurements taken at lesion area (indicated with white dotted line), adjacent area 0–500 μm (indicated with yellow dotted line) and far from lesion (2000–2500 μm distant area of gray matter from the same slice, indicated by arrows in g and h, respectively). Data shown as mean ± SEM, (N = 5), ns p ≥ 0.05, *p < 0.05, **p < 0.01, ***p < 0.001, ****p < 0.0001, two‐way ANOVA, Bonferroni‐Šídák's multiple comparison test.
FIGURE 6
FIGURE 6
Increased neuronal degeneration in Dbn −/− animals following thoracic SCI(a–d) Representative images of Nissl histology in WT (a, c) and Dbn −/− (b, d) tissue following SCI at intermediate and late timepoints, respectively, scale bar 500 μm. (e–h) Representative images of GFAP and synaptophysin (SYP) co‐labeling in WT (e, g) and Dbn −/− (f, h) tissue following SCI at intermediate and late timepoints, respectively, scale bar 500 μm. (e’–h’) SYP signal in grayscale corresponding to (e–h) respectively, scale bar 500 μm. (g”, h”) Magnifications of the SYP signal next to the lesion site, scale bar 100 μm. (g”’, h”’) Magnifications of the SYP signal far from the lesion site, scale bar 100 μm. (i) Density of Nissl bodies in gray matter adjacent to the lesion site (0–500 μm), (j) quantification of SYP signal intensity in gray matter adjacent to the lesion site (0–500 μm). Data shown as mean ± SEM, (N = 3), ns p ≥ 0.05, *p < 0.05, **p < 0.01, ***p < 0.001, ****p < 0.0001, two‐way ANOVA, Bonferroni‐Šídák's multiple comparison test.
FIGURE 7
FIGURE 7
Loss of DBN in Dbn −/− mice affects polarization of astrocytes at the lesion site. (a, b) Reconstructions of GFAP signal from WT (a) and Dbn −/− (b) tissues. Overlay of the mask created in Imaris over the GFAP positive astrocytic network adjacent to the lesion site at the early timepoint shows representative cell (in green) used for analysis, asterisk indicates center of the lesion, scale bar 50 μm. (c, d) Graphs show quantifications of astrocyte morphometric measurements (c) percentage of astrocytic processes oriented towards lesion center. (d) Astrocyte process mean diameter. Data in superplots show overlay of individual values of analyzed cells and mean for each animal, (N = 3 animals per group, n = 9 cells per animal), ns p ≥ 0.05, *p < 0.05, **p < 0.01, ***p < 0.001, ****p < 0.0001, two‐way ANOVA, Bonferroni‐Šídák's multiple comparison test.

References

    1. Ahuja, C. S. , Wilson J. R., Nori S., et al. 2017. “Traumatic Spinal Cord Injury.” Nature Reviews Disease Primers 3, no. 1: 17018. 10.1038/nrdp.2017.18. - DOI - PubMed
    1. Anderson, M. A. , Burda J. E., Ren Y., et al. 2016. “Astrocyte Scar Formation Aids Central Nervous System Axon Regeneration.” Nature 532, no. 7598: 195–200. 10.1038/nature17623. - DOI - PMC - PubMed
    1. Aoki, C. , Sekino Y., Hanamura K., et al. 2005. “Drebrin A Is a Postsynaptic Protein That Localizes In Vivo to the Submembranous Surface of Dendritic Sites Forming Excitatory Synapses.” Journal of Comparative Neurology 483, no. 4: 383–402. 10.1002/cne.20449. - DOI - PubMed
    1. Attwell, C. L. , Van Zwieten M., Verhaagen J., and Mason M. R. J.. 2018. “The Dorsal Column Lesion Model of Spinal Cord Injury and Its Use in Deciphering the Neuron‐Intrinsic Injury Response.” Developmental Neurobiology 78, no. 10: 926–951. 10.1002/dneu.22601. - DOI - PMC - PubMed
    1. Basso, D. M. , Fisher L. C., Anderson A. J., Jakeman L. B., Mctigue D. M., and Popovich P. G.. 2006. “Basso Mouse Scale for Locomotion Detects Differences in Recovery After Spinal Cord Injury in Five Common Mouse Strains.” Journal of Neurotrauma 23, no. 5: 635–659. 10.1089/neu.2006.23.635. - DOI - PubMed

MeSH terms