. 2025 Jul 18;26(14):e202500289.
doi: 10.1002/cbic.202500289. Epub 2025 Jul 1.

Characterization of DnaB-DnaG Interaction in M. tuberculosis Using Small-Angle X-ray Scattering-Based Dissociation Assay

Affiliations

Characterization of DnaB-DnaG Interaction in M. tuberculosis Using Small-Angle X-ray Scattering-Based Dissociation Assay

Dayan A et al. Chembiochem. .

Abstract

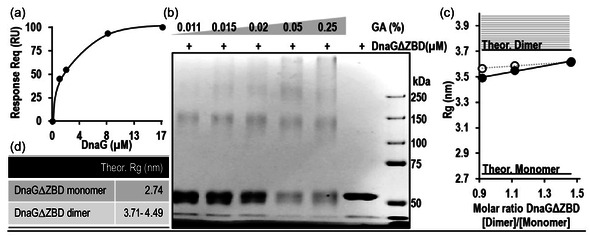
The complex interactions between helicase and primase, two key components of the replisome involved in DNA replication in Mycobacterium tuberculosis are studied. Utilizing purified, complementary domains of these proteins, a surface plasmon resonance (SPR) analysis and a cross-linking assay to characterize their binding dynamics are employed. The SPR analysis reveals a binding dissociation constant of 0.21 ± 0.08 μM, and the cross-linking assay suggests the possible formation of a heterodimer species. Importantly, a small-angle X-ray scattering dissociation assay to study the dynamic interactions between the proteins in solution is utilized. The findings provide new opportunities for targeted therapeutic strategies aimed at DNA replication in M. tuberculosis by revealing the structural interplay between helicase and primase.

Keywords: DnaB; DnaG; protein–protein interactions; small‐angle X‐ray scattering dissociation assay.


Conflict of interest statement

The authors declare no conflict of interest.

Figures

Figure 1
Figure 1
Assembly of proteins at the DNA replication fork of M. tuberculosis. DnaB helicase and DnaG primase are recruited along with DNA pol III holoenzyme and together commence the bidirectional synthesis of a new DNA molecule. A helicase ring (gray) unwinds double‐stranded DNA to expose the two individual strands. One strand is copied continuously (leading), and the other, discontinuously (lagging) by two DNA polymerase complexes (light gray). DNA polymerases use short RNA primers synthesized by DnaG primase (green) on the lagging strand to form Okazaki fragments. The RNA primers on the lagging strand are degraded, and the gaps are filled and ligated by further enzymatic activities in the replication fork to form a single continuous DNA strand.[ 43 ] The illustration was created based on the crystal structure of bacteriophage T7 replisome[ 44 ] PDBID 5IKN using PyMol (https://www.pymol.org).
Figure 2
Figure 2
Dimerization of T7 DNA primase. a) [1H, 15N]‐TROSY HSQC spectrum of 15N‐deuterated T7 primase; black—T7 primase alone, blue—T7 primase with 1 mM ATP/CTP, and red—T7 primase with 1 mM ATP/CTP and 10 mM MgCl2. Insets show magnified views of specific areas (labeled 1, 2, 3), indicating changes in chemical shifts upon the addition of ATP/CTP/MgCl2. Assignments of the observed resonances were derived from published NMR assignments of T7 primase.[ 30 ] The original assignment map, which accounts for 70% of the resonances, is shown in Figure S1a, Supporting Information. b) SAXS structural analysis and visualization of T7 primase. b1) Radius of gyration (R g) of T7 primase (50 μM) in the presence of increasing amounts of 4‐mer RNA primers (5′‐ACCC‐3′). The gray lines represent theoretical R g values for the T7 DNA primase monomer (R g = 24 Å) and dimer (R g = 27 Å) calculated using the crystal structure of T7 primase (PDBID: NUI[ 29 ]), as a reference structure, and CRYSOL software.[ 31 ] Raw SAXS profiles are presented in Figure S2a, Supporting Information. b2) Distance distribution functions of the T7 primase alone (lower portion) and T7 primase in the presence of RNA (upper portion), obtained using the computer program GNOM.[ 38 ] b3) The corresponding ab initio SAXS model of gp5 obtained using the ab‐initio modeling program GASBOR[ 45 ] that uses SAXS data to reconstruct a protein structure by representing it as an assembly of dummy beads. b4) R g determined using an in‐house script for T7 primase at three concentrations (2, 4, and 8 mg mL−1). Raw SAXS profiles are presented in Figure S2b, Supporting Information. b5) Crystal structure indicates plausible dimerization of T7 primase (PDBID: NUI[ 29 ]). c) Fe(II)‐catalyzed cross‐linking of T7 primase. d) Cross‐linking of T7 primase with glutaraldehyde. The reaction products were separated by size‐exclusion chromatography (top right), and the fractions were analyzed using SDS‐PAGE (top left). One fraction, corresponding to each cross‐linking reaction, was selected, based on the highest dimer‐to‐monomer ratio, and analyzed by MALDI‐TOF (bottom panel).
Figure 3
Figure 3
Dimerization of DnaG from M. tuberculosis. a) SPR analysis of soluble full‐length DnaG binding to the full‐length DnaG immobilized on a GLC sensor chip by amino coupling. The signal observed at equilibrium was plotted as a function of soluble DnaG concentration (raw data are available in Figure S1c, Supporting Information). b) Formation of DnaGΔZBD dimers after crosslinking with increasing concentrations of glutaraldehyde observed by SDS‐PAGE. Gel bands around 60 and 120 kDa correspond to DnaGΔZBD monomers and dimers, respectively. c) Values of R g obtained by SAXS of monomeric and dimeric state of DnaGΔZBD at concentrations of 5, 7, and 11 μM. Solid black circles represent the calculated R g values of DnaGΔZBD in solution, and empty circles represent experimental R g values. The raw SAXS profiles, along with their corresponding Guinier plots, are shown in Figure S1d, Supporting Information. d) Theoretical R g values of DnaGΔZBD oligomeric states, calculated using the computer program CRYSOL.[ 31 ]
Figure 4
Figure 4
Interactions between primase–helicase domains (DnaGΔZBD–DnaBn) of M. tuberculosis. a) Schematic representation of the structures of full‐length DnaG and DnaB proteins and the truncated variants used in the current study (DnaG, turquoise, and DnaB, orange). b) SPR analysis of the interaction of soluble DnaGΔZBD with immobilized DnaBn. The response is plotted as a function of soluble DnaGΔZBD concentration, and steady‐state analysis revealed K D = 0.21 ± 0.08 μM. c) Molecular weights of the expected protein complexes. Heterodimer refers to DnaGΔZBD–DnaBn complex. d) SDS‐PAGE analysis of cross‐linked DnaGΔZBD and DnaBn, at a constant glutaraldehyde concentration of 0.045%. The cyan arrow points to 60‐kDa DnaGΔZBD monomers; the blue arrow to 120‐kDa DnaGΔZBD dimers; and the orange and light‐orange arrows to 32‐kDa DnaBn dimers and 16‐kDa DnaBn monomers, respectively. The mosaic arrow indicates the 76‐kDa DnaBn–DnaGΔZBD heterodimer. The asterisk indicates the high‐molecular‐weight aggregates. e) Quantification of the pixel intensity of the 76‐kDa DnaBn–DnaGΔZBD heterodimer bands plotted as a function of DnaBn concentration.
Figure 5
Figure 5
Low‐resolution SAXS model for disruption of DnaG dimers by DnaB. a) Schematic model for disruption of DnaG dimers by DnaB. b) SAXS profiles and the corresponding Guinier plots. Experimental data (blue, raw data are presented in Figure S3, Supporting Information). Simulation of the disruption of a DnaG dimer by a DnaBn monomer (orange). Simulation of the direct binding of a DnaBn monomer to a DnaG monomer (yellow). Simulation of noninteracting species (green). c) Theoretical R g values for the DnaBn helicase, calculated using the crystal structure of the N‐terminal domain of DnaB helicase from M. tuberculosis (PDBID: 2R5U)[ 13 ] and of DnaGΔZBD primase, calculated using the high‐resolution structure prediction I‐TASSER suite[ 34 ] and the computer program CRYSOL.[ 31 ] d) Simulated and experimentally determined R g values of DnaBn helicase and DnaGΔZBD primase mixed in solution at different molar ratios, based on the determined K D value and mass action law. The dashed lines represent the theoretical R g values of the DnaGΔZBD monomer or homodimer or the DnaBn–DnaGΔZBD heterodimer in a solution, while the blue dots represent the R g values of the interacting proteins in a solution, as obtained by SAXS. e) Experimentally determined distance distribution function P(r) of DnaBn and DnaGΔZBD species. Protein structure figures were created using the visualization software PyMol (https://pymol.org/). Theoretical SAXS profiles were generated using CRYSOL based on 3D atomic models of the oligomeric states. Experimental data were directly compared with theoretical curves to identify the molecular species present at each stage of the dissociation assay.

References

    1. Kastritis P. L., Bonvin A. M., J. R. Soc. Interface 2013, 10, 20120835. - PMC - PubMed
    1. Bleichert F., Botchan M. R., Berger J. M., Science 2017, 355. - PubMed
    1. Beattie T. R., Bell S. D., EMBO J. 2012, 31, 1556. - PMC - PubMed
    1. Fass D., Bogden C. E., Berger J. M., Structure 1999, 7, 691. - PubMed
    1. Lu Y. B., Ratnakar P. V., Mohanty B. K., Bastia D., Proc. Natl. Acad. Sci. U.S.A. 1996, 93, 12902. - PMC - PubMed

MeSH terms

LinkOut - more resources