. 2025 May 22;14(11):765.
doi: 10.3390/cells14110765.

P53-Induced Autophagy Degradation of NKX3-2 Improves Ovarian Cancer Prognosis

Affiliations

P53-Induced Autophagy Degradation of NKX3-2 Improves Ovarian Cancer Prognosis

Alessandra Ferraresi et al. Cells. .

Abstract

NKX3-2, a transcriptional repressor factor belonging to the NK family of homeobox-containing proteins, has been widely studied for its role in promoting chondrogenic differentiation and homeostasis. NKX3-2 is upregulated in chemoresistant ovarian tumors and metastatic gastric cancer cells; however, its prognostic role and mechanistic involvement in cancer cell biology remain to be elucidated. By interrogating the TCGA database, we found that cancer patients with high NKX3-2 expression had a shorter overall survival rate than patients with low expression. In ovarian cancer patients, NKX3-2 negatively correlates with P53. Given the prominent role of the latter oncosuppressor in controlling DNA repair and cell death, here we investigate the molecular mechanism involved in this negative correlation in several ovarian cancer cell lines expressing different levels of the two proteins. We found that the high expression of endogenous or ectopic P53 reduced NKX3-2 protein expression, while its knockdown increased it. In contrast, the genetic manipulation of NKX3-2 expression did not affect P53 expression. Mechanistically, P53-mediated downregulation of NKX3-2 does not entail transcriptional activity or proteasomal clearance but occurs via P53-NKX3-2 protein-protein interaction, which in turn results in P53-induced NKX3-2 degradation via the autophagy-lysosome pathway. Remarkably, patients bearing a tumor characterized by low NKX3-2 and high MAP1LC3B expression (indicative of active autophagy) display a better prognosis. Taken together, our data indicate that NKX3-2 represents a negative prognostic factor under P53 control in ovarian cancer. From a translational point of view, identifying this novel mechanism may represent a new molecular signature capable of predicting the clinical outcome of patients, a crucial aspect of developing personalized therapeutic approaches.

Keywords: BAPX1; TCGA; apoptosis; autophagy; cancer cell metabolism; lysosome; ovarian cancer; p53; personalized medicine; prognosis.


Conflict of interest statement

The authors declare no conflicts of interest.

Figures
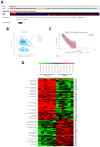
Figure 1
Figure 1
NKX3-2 negatively correlates with TP53 expression, and this is associated with poor clinical outcomes. (A) The oncoprint shows the genetic alterations and mRNA expression levels of NKX3-2 and TP53 in 316 ovarian cancer patients (Ovarian Serous Cystadenocarcinoma dataset, Consortium TCGA, Nature 2011). The heatmap reports upregulated and downregulated genes in red and blue, respectively. (B) The scatter plot displays the inverse correlation of NKX3-2 and TP53 mRNA levels. (C) The Kaplan–Meier curve depicts overall survival based on NKX3-2/TP53 differential expression levels. (D) Comparison of differentially expressed genes in two groups of patients stratified based on NKX3-2 and TP53 expression. Patients were stratified in Group A (high NKX3-2/low TP53 expression) and Group B (low NKX3-2/high TP53 expression). The heatmap reports the top differentially expressed genes belonging to each biological process related to cell metabolism, cell motility, apoptosis, DNA repair mechanisms, and oncogenic signaling pathways.
Figure 2
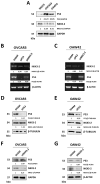
Figure 2
P53 negatively modulates NKX3-2 protein but not vice versa. (A) Three cell lines (SKOV3, OVCAR3, and OAW42), representing the heterogenicity of TP53 (null, mutated, and wild type, respectively), were analyzed for the expression of NKX3-2 by Western blotting. (B,C) OVCAR3 and OAW42 cells were silenced for P53 or NKX3-2. Agarose gel electrophoresis was used to visualize the PCR products for P53 and NKX3-2. Normalization was performed with β-ACTIN. (D,E) OVCAR3 and OAW42 cells were silenced for P53, and NKX3-2 protein expression was monitored by Western blotting. Normalization was performed with β-Tubulin. (F,G) OVCAR3 and OAW42 cells were silenced for NKX3-2, and P53 protein expression was monitored by Western blotting. Normalization was performed GAPDH or β-Actin. All densitometric analyses for Western blotting and agarose gel electrophoresis of PCR products are included.
Figure 3
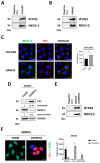
Figure 3
NKX3-2 interacts with p53. (A,B) Cell homogenates from OVCAR3 and OAW42 cells were processed for immunoprecipitation, and Western blotting was used to assess NKX3-2–P53 interaction. (C) Immunofluorescence co-staining for NKX3-2 (green)—P53 (red). Scale bar = 20 μm; magnification = 63×. The fluorescence quantification of NKX3-2–P53 co-localization is reported in the graph. (D) SKOV3 cells were genetically manipulated to overexpress ectopic P53. Cell homogenates were characterized by Western blotting for the expression of P53 and NKX3-2. Normalization was performed by GAPDH. Densitometric analysis is included. (E) Cell homogenates of SKOV3 P53-overexpressing cells were processed by immunoprecipitation, and Western blotting was used to assess the NKX3-2–P53 interaction. (F) SKOV3 cells genetically manipulated as described in panel D were characterized by immunofluorescence double-staining for NKX3-2 (green)—P53 (red). Scale bar = 20 μm; magnification = 63×. The quantification of NKX3-2 and P53 fluorescent signals, and NKX3-2–P53 co-localization are reported in the graph. Statistical analysis was performed using GraphPad Prism 5.0 software. Bonferroni’s multiple comparison test after t-test analysis (unpaired, two-tailed) was employed. Significance was considered as follows: **** p < 0.0001; *** p < 0.001; * p < 0.05; ns p > 0.05.
Figure 4
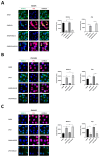
Figure 4
P53-induced downregulation of NKX3-2 is not mediated by proteasomal degradation. Immunofluorescence double staining for NKX3-2 (green)—P53 (red) performed on SKOV3 (A), OVCAR3, and OAW42 (B,C) genetically manipulated to overexpress (A) or silence (B,C) P53 expression. After 40 h of transfection, cells were cultured in the absence/presence of 10 µM MG132 for a further 8 h. Scale bar = 20 μm; magnification = 63×. The quantification of NKX3-2 and P53 fluorescent signals is reported in the graphs. Statistical analysis was performed using GraphPad Prism 5.0 software. Bonferroni’s multiple comparison test after One-way ANOVA analysis (unpaired, two-tailed) was employed. Significance was considered as follows: **** p < 0.0001; *** p < 0.001; ** p < 0.001; * p < 0.05; ns p > 0.05.
Figure 5
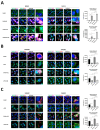
Figure 5
P53 induces NKX3-2 autophagic degradation. Immunofluorescence triple staining for NKX3-2 (green)—P53 (purple)—LC3 or LAMP1 (red) performed on SKOV3 (A), OVCAR3, and OAW42 (B,C) genetically manipulated to overexpress (A) or silence (B,C) P53 expression. After 40 h of transfection, cells were cultured in the absence/presence of 30 µM chloroquine (ClQ) for a further 8 h. Scale bar = 20 μm; magnification = 63×. The quantification of NKX3-2/P53/LC3 and NKX3-2/P53/LAMP1 co-localization is reported in the graphs. Statistical analysis was performed using GraphPad Prism 5.0 software. Bonferroni’s multiple comparison test after One-way ANOVA analysis (unpaired, two-tailed) was employed. Significance was considered as follows: **** p < 0.0001; *** p < 0.001; ** p < 0.001; * p < 0.05; ns p > 0.05.
Figure 6
Figure 6
NKX3-2 interacts with LC3. SKOV3 cells were genetically manipulated to overexpress, while OVCAR3 and OAW42 cells were silenced for NKX3-2, respectively. Cell homogenates were precipitated with anti-NKX3-2 antibody, and the presence of LC3 among the interactors was assessed by Western blotting. Densitometric analysis of NKX3-2-LC3 interaction is reported in the graph. Statistical analysis was performed using GraphPad Prism 5.0 software. Bonferroni’s multiple comparison test after One-way ANOVA analysis (unpaired, two-tailed) was employed. Significance was considered as follows: ** p < 0.01; * p < 0.05.
Figure 7
Figure 7
Low NKX3-2 together with high MAP1LC3B expression is associated with better clinical outcomes. (A) The oncoprint shows the genetic alterations and mRNA expression levels of NKX3-2 and MAP1LC3B in 316 ovarian cancer patients (Ovarian Serous Cystadenocarcinoma dataset, Consortium TCGA, Nature 2011). The heatmap reports the upregulated and downregulated genes in red and blue, respectively. (B) The Kaplan–Meier curve depicts overall survival based on NKX3-2/MAP1LC3B differential expression levels.

Similar articles

References

    1. Hong M.-K., Ding D.-C. Early Diagnosis of Ovarian Cancer: A Comprehensive Review of the Advances, Challenges, and Future Directions. Diagnostics. 2025;15:406. doi: 10.3390/diagnostics15040406. - DOI - PMC - PubMed
    1. Kossaï M., Leary A., Scoazec J.-Y., Genestie C. Ovarian Cancer: A Heterogeneous Disease. Pathobiology. 2017;85:41–49. doi: 10.1159/000479006. - DOI - PubMed
    1. Lengner C.J., Hassan M.Q., Serra R.W., Lepper C., van Wijnen A.J., Stein J.L., Lian J.B., Stein G.S. Nkx3.2-mediated Repression of Runx2 Promotes Chondrogenic Differentiation. J. Biol. Chem. 2005;280:15872–15879. doi: 10.1074/jbc.M411144200. - DOI - PubMed
    1. Rainbow R.S., Kwon H., Zeng L. The role of Nkx3.2 in chondrogenesis. Front. Biol. 2014;9:376–381. doi: 10.1007/s11515-014-1321-3. - DOI - PMC - PubMed
    1. Ouyang S., Zhu G., Ouyang L., Luo Y., Zhou R., Pan C., Bin J., Liao Y., Liao W. Bapx1 mediates transforming growth factor-β- induced epithelial-mesenchymal transition and promotes a malignancy phenotype of gastric cancer cells. Biochem. Biophys. Res. Commun. 2017;486:285–292. doi: 10.1016/j.bbrc.2017.03.029. - DOI - PubMed