. 2025 May 27;14(11):785.
doi: 10.3390/cells14110785.

Transcriptomic Analyses of Ovarian Clear Cell Carcinoma Spheroids Reveal Distinct Proliferative Phenotypes and Therapeutic Vulnerabilities

Affiliations

Transcriptomic Analyses of Ovarian Clear Cell Carcinoma Spheroids Reveal Distinct Proliferative Phenotypes and Therapeutic Vulnerabilities

Bart Kolendowski et al. Cells. .

Abstract

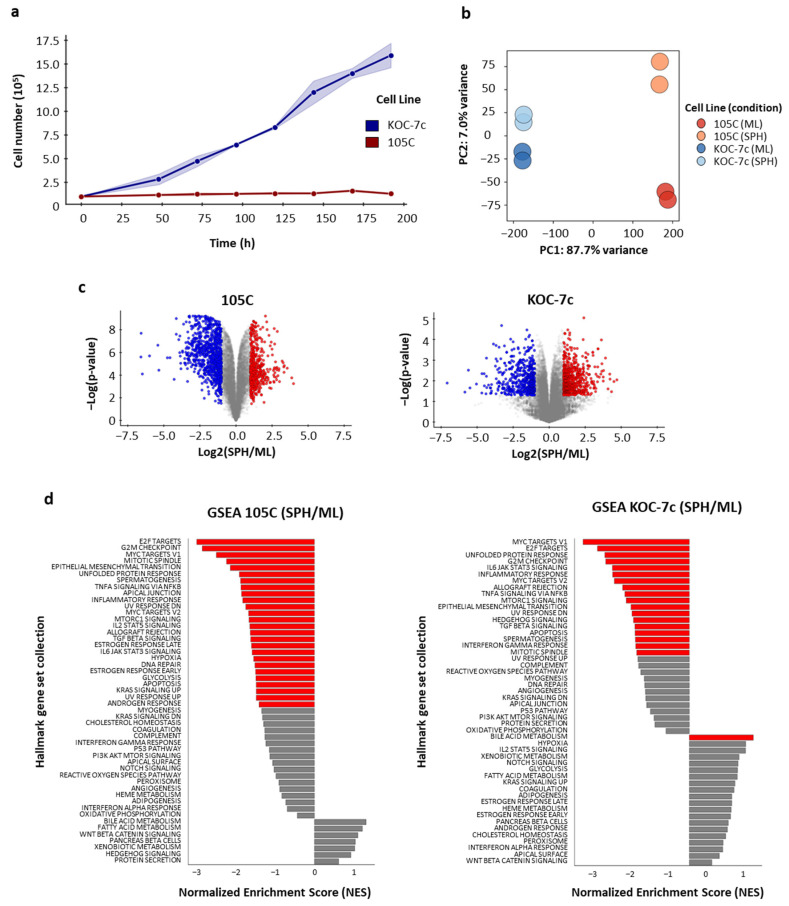
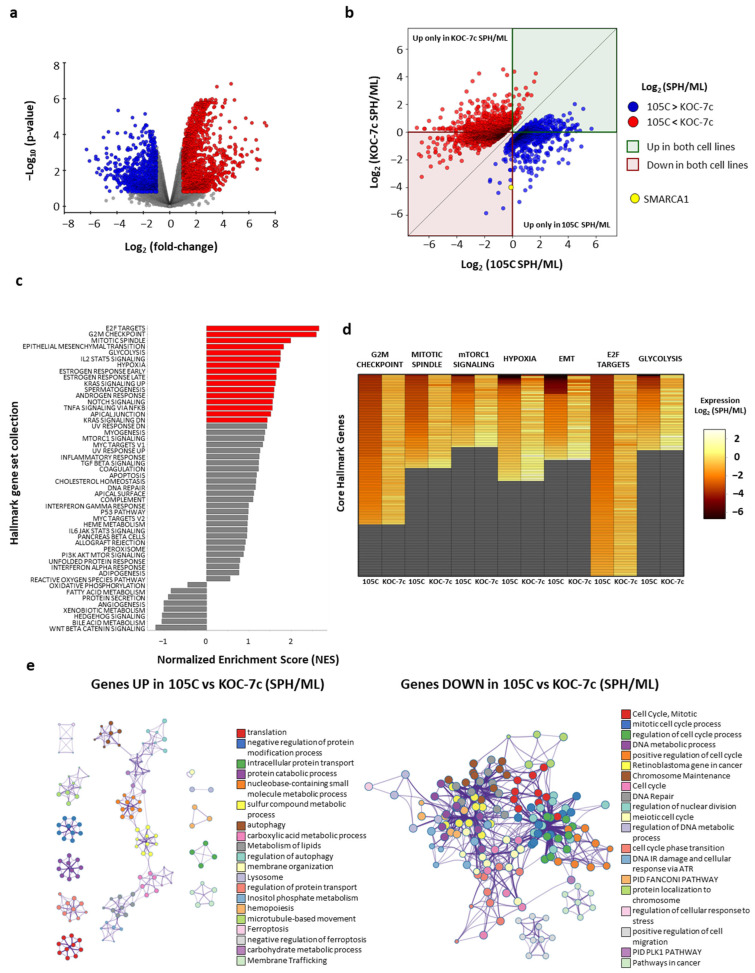
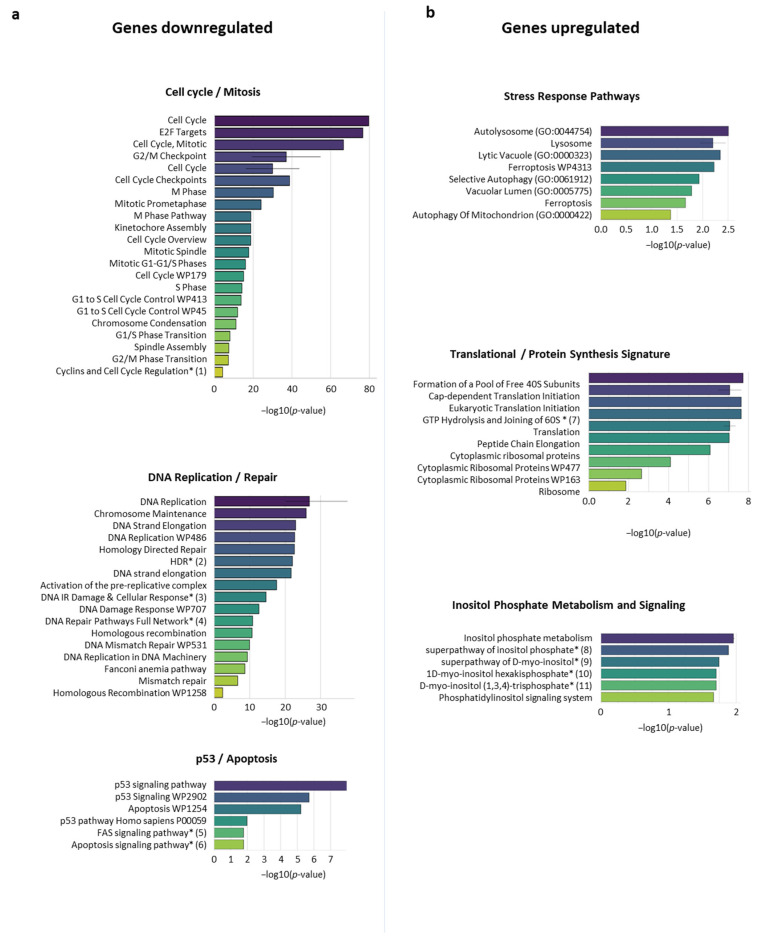
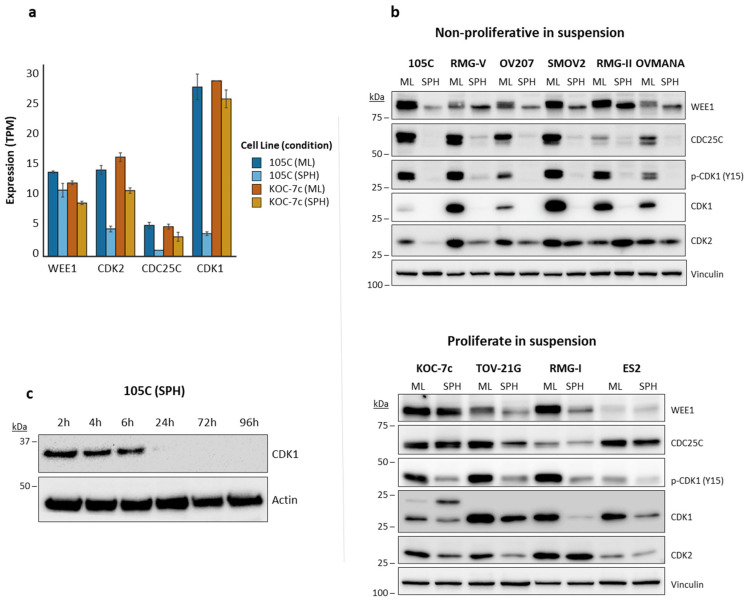
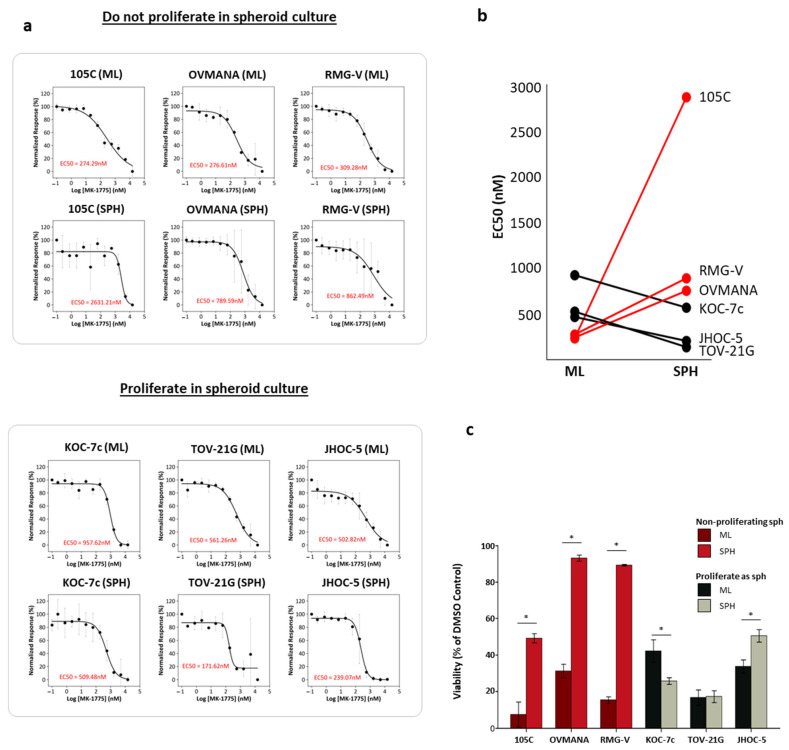
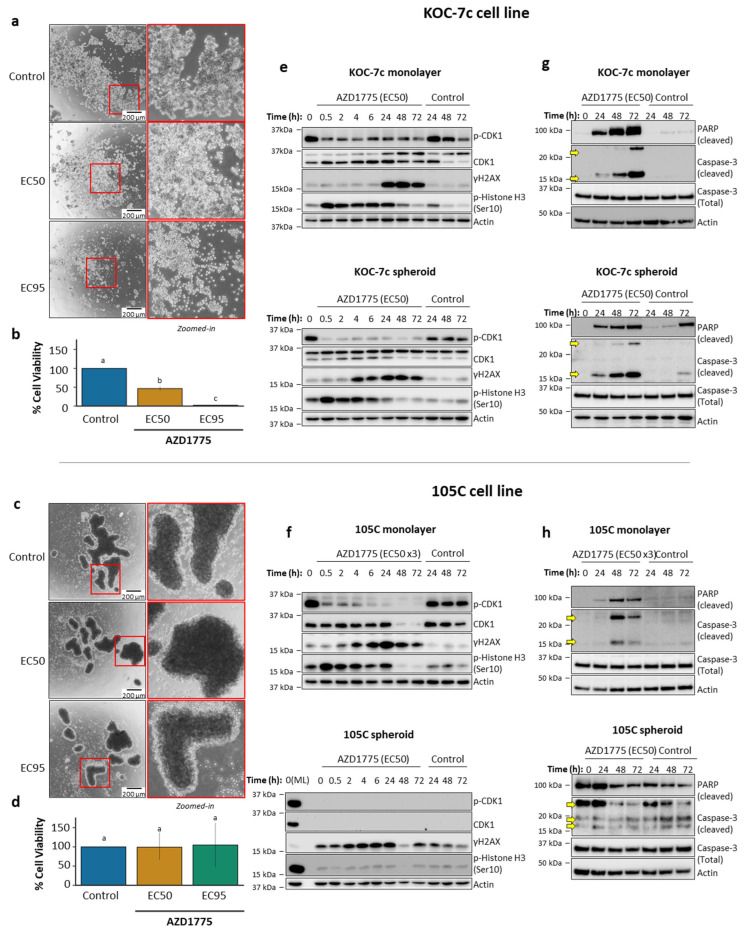
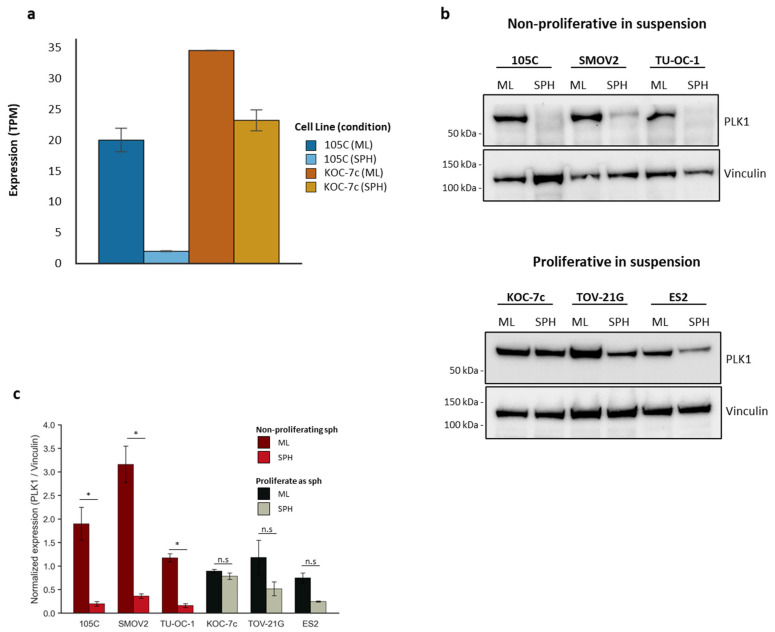
Cancer cell spheroids autonomously form in the ascites fluid and are considered a conduit for epithelial ovarian cancer metastasis within the peritoneal cavity. Spheroids are homotypic, avascular 3D structures that acquire resistance to anoikis to remain viable after cellular detachment. We used in vitro spheroid model systems to interrogate pathways critical for spheroid cell proliferation, distinct from those driving monolayer cancer cell proliferation. Using the 105C and KOC-7c human ovarian clear cell carcinoma (OCCC) cell lines, which have distinct proliferative phenotypes as spheroids but the same prototypical OCCC gene mutation profile of constitutively activated AKT signaling with the loss of ARID1A, we revealed therapeutic targets that efficiently kill cells in spheroids. RNA-seq analyses compared the transcriptome of 3-day monolayer and spheroid cells from these lines and identified the characteristics of dormant spheroid cell survival, which included the G2/M checkpoint, autophagy, and other stress pathways induced in 105C spheroids, in sharp contrast to the proliferating spheroid cells of the KOC-7c cell line. Next, we assessed levels of various G2/M checkpoint regulators and found a consistent reduction in steady-state levels of checkpoint regulators in dormant spheroid cells, but not proliferative spheroids. Our studies showed that proliferative spheroid cells were sensitive to Wee1 inhibition by AZD1775, but the dormant spheroid cells showed a degree of resistance to AZD1775, both in terms of EC50 values and spheroid reattachment abilities. Thus, we identified biomarkers of dormant spheroids, including the G2/M checkpoint regulators Wee1, Cdc25c, and PLK1, and showed that, when compared to proliferating spheroid cells, the transcriptome of dormant OCCC spheroids is a source of therapeutic targets.

Keywords: AZD1775; G2/M; cancer; cell line; clear cell; dormancy; ovarian; spheroid.


Conflict of interest statement

The authors declare no conflicts of interest for this study.

Figures

Figure 1
Figure 1
RNA-Seq analysis of ovarian clear cell carcinoma cell lines 105C and KOC-7c, comparing the monolayer to spheroid transcriptome. (a) Change in cell number of KOC-7c and 105C cell lines maintained over time in suspension culture using ultralow-attachment plates. The doubling time for the KOC-7c spheroid cells is 57 h, whereas the 105C cell line spheroid cell number does not change over time after 5 days in suspension culture. (b) PCA plot on RNA-Seq data showing the distinct grouping of 105C and KOC-7c cell lines and further separation between cells grown as monolayer (ML) compared to those maintained in suspension as spheroids (SPH) within each group, indicating that the largest differences between the samples are primarily due to cell types with further differences seen as a consequence of culture conditions especially for the 105C line. (c) Volcano plots of RNA-Seq data for both 105C and KOC-7c cell lines. Differentially expressed genes (DEGs) in 105C and KOC-7c cell lines observed when comparing expression between monolayer and spheroid within each line with the 105C cell line showing a much larger number of genes exhibiting significant changes in expression while the transcriptome of the KOC-7c line does not change significantly between monolayer and spheroid culture (red (upregulated); blue (downregulated): p < 0.05 and absolute (fold change) > 2). (d) GSEA analyses of differentially expressed genes in 105C and KOC-7c lines reveals pathways downregulated when cells are grown in suspension as 3D spheroids (red bars: FDR adjusted p-value < 0.05).
Figure 2
Figure 2
Pathways are differentially regulated in response to spheroid cultures between 105C and KOC-7c cell lines. (a) Volcano plot using genes that are differentially expressed when comparing response of 105C to KOC-7c maintained in spheroid cultures. Red markers indicate genes that are significantly increased in KOC-7c cells in response to spheroid cultures relative to 105C cell line response to spheroid culture, while blue markers signify genes whose expression is lower in response to KOC-7c spheroid culture relative to 105C cell line in spheroid cultures. (b) Comparing change in gene expression between 105C and KOC-7c under monolayer or spheroid culture conditions, which are identified as being significantly different between KOC-7c (SPH/ML) vs. 105C (SPH/ML). Each marker represents fold change of gene (suspension/monolayer) for both 105C and KOC-7c cell lines. Red dots signify genes significantly upregulated in KOC-7c cells relative to 105C cells based on ratio of spheroid to monolayer data. Blue dots indicate genes significantly downregulated in KOC-7c cells relative to 105C based on ratio of spheroid to monolayer. The red quadrant contains genes which are increased in both 105C (SPH/ML) and KOC-7c (SPH/ML), while the green quadrant contains genes that are elevated in both 105C (SPH/ML) and KOC-7c (SPH/ML). Genes in red and green quadrants have same direction of change with regard to expression (SPH/ML); however, magnitude of change in gene expression between 105C and KOC-7c cell lines is sufficient to cause genes to be seen as significantly down- or upregulated in KOC-7c (SPH/ML) relative to 105C (SPH/ML). White quadrants contain genes which are regulated in opposite directions across each cell line, meaning that distribution of DEGs is predominantly cell-specific. The yellow point highlights SMARCA, a gene that is downregulated in both 105C and KOC-7c (SPH/ML); however, due to magnitude difference, it is still seen as reduced in KOC-7c vs. 105C; (c) GSEA analysis using difference in fold change between two cell lines for each gene (i.e., (KOC-7cSPH/KOC-7cML)/(105CSPH/105CML)] reveals multiple pathways that are differentially regulated when comparing response of 105C and KOC-7c cell lines to 3D spheroid formation (red bars: FDR adjusted p-value < 0.05). (d) Heatmap of fold change (suspension/monolayer) of core GSEA genes composing pathways that were identified as significantly enriched in GSEA analysis reveals that 105C cell line downregulates expression of core genes when cultured as spheroids (relative to monolayer) while KOC-7c cell line generally maintains consistent expression of these genes between monolayer and spheroid culture; (e) Metascape analyses describing genes upregulated (on left) in 105C vs. KOC-7c form in contrast, distinct functional clusters which are not overlapping and enriched in pathways such as translation, autophagy, metabolic processes, and ferroptosis regulation indicating shift towards stress adaptation and metabolic reprogramming. Right side Metascape Network analysis of genes downregulated in 105C vs. KOC-7c (SPH/ML) reveal highly interconnected network primarily enriched in pathways related to cell cycle regulation, DNA repair, and chromosome maintenance suggesting reduction in proliferative and genome maintenance processes in 105C cell line relative to spheroid proliferative KOC-7c line. Nodes represent biological terms and edges, or interconnecting lines define term overlap based on shared gene memberships. Colors correspond to pathway annotations.
Figure 3
Figure 3
Enrichr analysis identified pathways found to be differentially expressed in 105C SPH/ML vs. KOC-7c SPH/ML. To identify pathways that are potentially differentially regulated between 105C and KOC-7c cell lines when maintained in suspension, we performed gene set enrichment using Enrichr for genes downregulated in response to suspension culture in 105C vs. KOC-7c cells as well as those which are upregulated. (a) Genes which are downregulated in 105C (SPH/ML) relative to KOC-7c (SPH/ML) reveal enrichment for terms associated with cell cycle/mitosis DNA replication/repair and p53/apoptosis. (b) Upregulated genes instead show an enrichment relating to translation stress response as well as energy homeostasis (Inositol Phosphate Metabolism and Signaling). * indicates terms that are truncated in this Figure for brevity.
Figure 4
Figure 4
Expression of G2/M pathway proteins. (a) G2/M pathway gene transcript levels (Transcripts Per Million) on day 3 105C and KOC-7c monolayer or spheroid cells shows downregulation of CDK1 and CDC25C expression in 105C spheroid cells. Data are mean ± SEM of n = 2 independent RNA-seq experiments. (b) Western blot analysis of G2/M pathway protein levels in day 3 OCCC cell lines cultured as monolayer or spheroid cells. OCCC cell lines that do not proliferate as spheroids show consistent downregulation of G2/M pathway proteins when cultured as spheroids while expression is more likely to be maintained in cell lines that proliferate in spheroid culture. (c) Time course using whole-cell lysate was collected from 105C cells cultured in suspension at each indicated time point and incubated with antibody targeting CDK1. We used siRNA knockdown of CDK1 to show that higher molecular weight band that we observe is non-specific (Figure S2).
Figure 5
Figure 5
Wee1 inhibitor AZD1775 EC50 determinations on OCCC cell lines which behave differently in spheroid cultures. (a) Cells were cultured for three days either in monolayer or suspension followed by a 3-day treatment with AZD1775 at concentrations ranging from 1 nM to 15 µM (n = 3) and then alamarBlue was used to measure cell viability. Measurements were normalized to DMSO (100%) (0% = value at highest concentration). (b) EC50 values indicate that lines which do not proliferate (black lines and points) appear to be more sensitive as spheroids compared to their monolayer counter parts, while lines which do not proliferate as spheroids (red line and points) appear to become more resistant. See Supplementary Table S3 for actual EC50 values for each cell line and culture condition. (c) At maximum concentration of AZD1775, we tested (15 µM) cell lines which do not proliferate in suspension showed an increase in viability as spheroids when compared to their monolayer counterparts. Cells which do proliferate showed decreased viability or no change. JHOC-5 both does not proliferate in suspension during early time points but shows robust proliferation after day 10 (Supplementary Figure S3). Data are mean ± SEM of n = 3 independent experiments; * p < 0.05 versus corresponding monolayer (two-tailed paired t-test). Red line: ML(EC50) < SPH(EC50); Black line: ML(EC50) > SPH(EC50).
Figure 6
Figure 6
Effects of AZD1775 on mitotic entry and DNA damage in 105C and KOC-7c cells in monolayer and spheroid culture. (a,c) Representative images of KOC-7c and 105C spheroids treated with AZD1775. KOC-7c spheroids were seeded at 1 × 10⁴ cells/well in 24-well ultralow-attachment (ULA) plates allowed to form for 3 days and then treated for an additional 3 days. Similarly, 105C spheroids were seeded at 1.25 × 10⁵ cells/well in 24-well ULA plates also treated 3 days after seeding and imaged following 3 days of treatment. All images were taken immediately before reattachment. Red boxes indicate regions shown at higher magnification; (b,d) 105C and KOC-7c spheroid reattachment assay results after treatment with AZD1775. Cells were seeded at density of 1.25 × 10⁵ cells per well for 105C cell line and 1 × 10⁴ cells per well for KOC-7c cell line in 24-well ULA plates. Three days after seeding, cells were treated with their respective AZD1775 EC50 and EC95 concentrations for three days. 105C cell line EC50 was ~3 µM and EC95 was ~9 µM while for KOC-7c cell line EC50 was ~600 nM and EC95 was ~3 µM. Following three days of treatment cells were reattached into 24-well adherent culture plates. Cell viability after reattachment was determined using alamarBlue assay. 105C cells exhibited resistance to AZD1775 at both doses of drug. Error bars represent SEM. Conducted one-way ANOVA followed by Tukey’s multiple comparisons test. Different letters represent significantly different values (p < 0.05); (e,f) Cells were treated with their respective AZD1775 EC50 concentrations for 3 days (105C monolayer cells treated with triple their EC50). Western blot analysis performed for phospho-CDK1 total CDK1, γH2AX, and phospho-H3. Actin was used as loading control; (g,h) Adherent (monolayer) cells for both cell lines were seeded in 6-well adherent culture plates at densities that yielded ~90% confluency at time of lysate collection. Spheroid cells were seeded at 2 × 10⁵ cells/well for KOC-7c cells and 1 × 10⁶ cells/well for 105C cells in 6-well ULA culture. KOC-7c cells were treated with their AZD1775 EC50 concentration (ML: 950 nM; SPH: 600 nM). 105C adherent cells were treated at triple their AZD1775 EC50 concentration (750 nM) and 105C spheroid cells were treated at EC50 of KOC-7c spheroid cells. Cells were treated 3 days post-seeding and whole-cell protein lysates were collected at every time point and used for Western blot analysis of apoptosis markers. Different letters (a, b, c) represent significantly different values (p < 0.05). Yellow arrows denote cleaved Caspase-3 bands.
Figure 7
Figure 7
PLK1 expression in OCCC cell lines which proliferate as spheroids and those that do not. (a) PLK1 transcript levels (Transcripts Per Million) obtained from RNA-seq showing dramatic downregulation in 105C spheroids. n = 2, SEM; (b) PLK1 protein levels in OCCC cell lines which do not proliferate as spheroids and OCCC cell lines which can proliferate in spheroid form. Vinculin used as loading control. (c) Bars represent relative protein expression (PLK1/Vinculin, arbitrary units) in monolayer (ML) versus spheroid (SPH) cultures for each OCCC cell line (mean ± SD, n = 2 paired biological replicates). Paired Student’s t-test; ns = not significant, * p < 0.05.

Similar articles

Cited by

References

    1. Huang R.Y.-J., Lin J.J.-C. Ovarian Clear Cell Carcinoma: An Endometriosis-Associated Cancer with Therapeutic Challenges. Cold Spring Harb. Perspect. Med. 2024;14:a041315. doi: 10.1101/cshperspect.a041315. - DOI - PubMed
    1. Liu Z., Jing C., Kong F. From Clinical Management to Personalized Medicine: Novel Therapeutic Approaches for Ovarian Clear Cell Cancer. J. Ovarian Res. 2024;17:39. doi: 10.1186/s13048-024-01359-7. - DOI - PMC - PubMed
    1. Wang Y., Hoang L., Ji J.X., Huntsman D.G. SWI/SNF Complex Mutations in Gynecologic Cancers: Molecular Mechanisms and Models. Annu. Rev. Pathol. 2020;15:467–492. doi: 10.1146/annurev-pathmechdis-012418-012917. - DOI - PMC - PubMed
    1. Ohkawa K., Amasaki H., Terashima Y., Aizawa S., Ishikawa E. Clear Cell Carcinoma of the Ovary: Light and Electron Microscopic Studies. Cancer. 1977;40:3019–3029. doi: 10.1002/1097-0142(197712)40:6<3019::AID-CNCR2820400639>3.0.CO;2-M. - DOI - PubMed
    1. Kato N. Pathology of Clear Cell Carcinoma of the Ovary: A Basic View Based on Cultured Cells and Modern View from Comprehensive Approaches. Pathol. Int. 2020;70:591–601. doi: 10.1111/pin.12954. - DOI - PubMed

Publication types

MeSH terms

Associated data