. 2025 Jun 2;14(11):827.
doi: 10.3390/cells14110827.

Air-Exposure- and Reoxygenation-Stimulated Expressions of Caspase-3 and Induction of Apoptosis in the Central Nervous System of the Crab Erimacrus isenbeckii

Affiliations

Air-Exposure- and Reoxygenation-Stimulated Expressions of Caspase-3 and Induction of Apoptosis in the Central Nervous System of the Crab Erimacrus isenbeckii

Elena Kotsyuba et al. Cells. .

Abstract

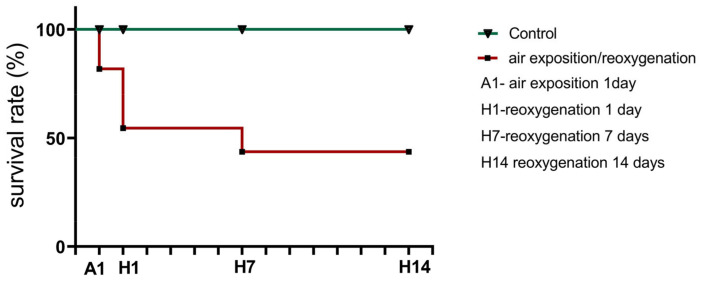
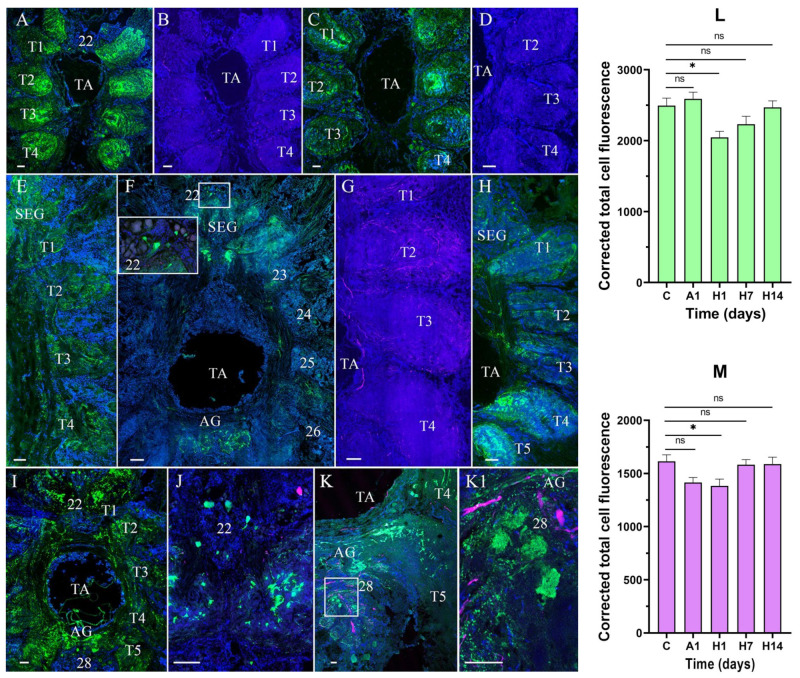
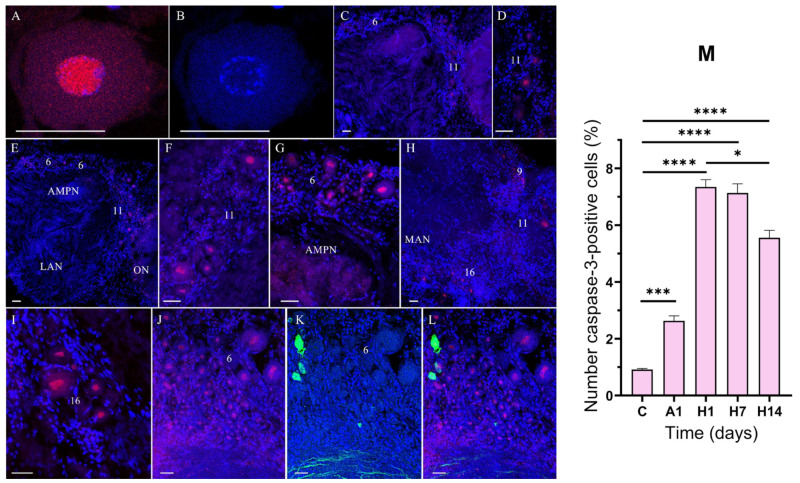
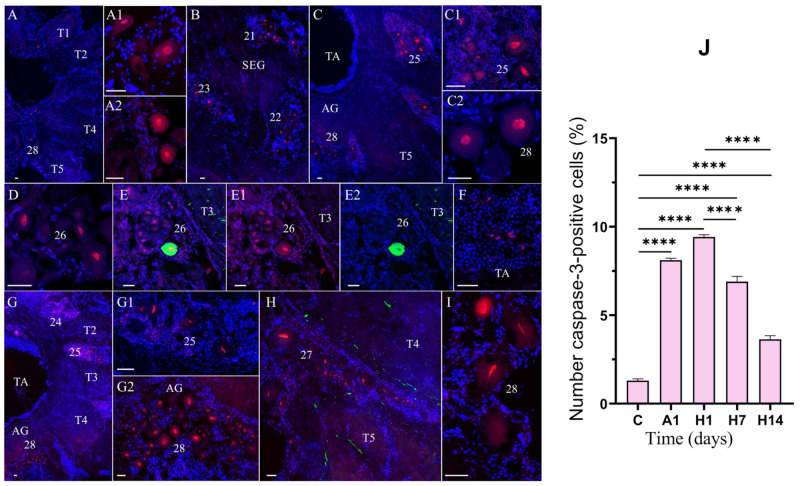
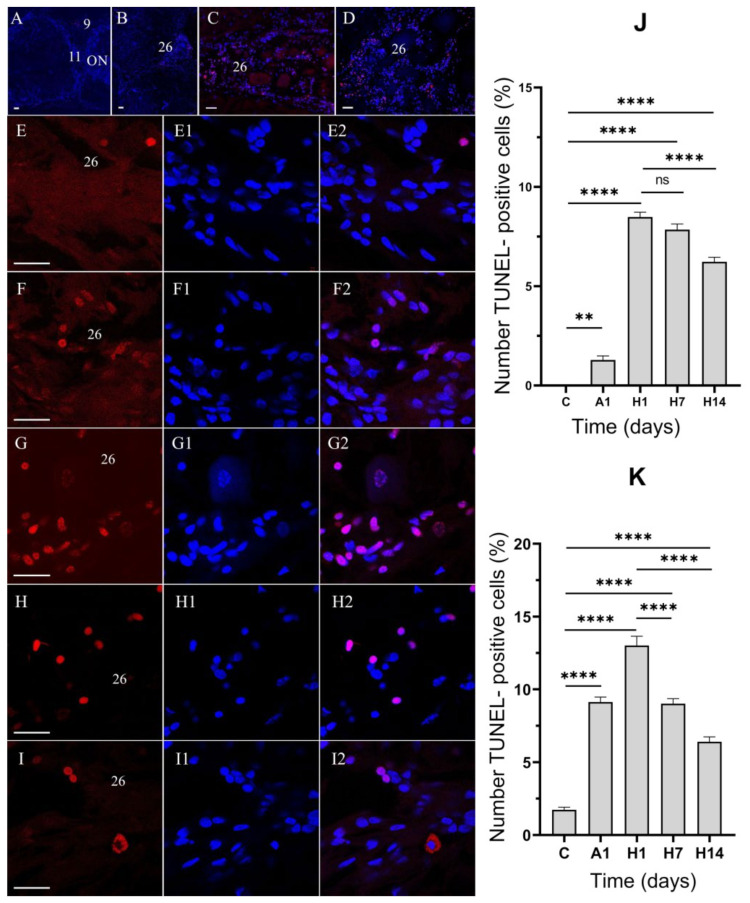
Air exposure stress during live transport and subsequent reoxygenation are factors in the development of molecular/pathological and compensatory/adaptive responses. They affect the physiological functions and survival of economically important invertebrate species, in particular, crustaceans. In this study, we consider the effects of anoxia and subsequent reoxygenation on the physiological responses, signaling pathways involved in stress, and cell apoptosis in the central nervous system (CNS) of the horsehair crab, Erimacrus isenbeckii. The results showed that 1 day of air exposure stress and 1 subsequent day of reoxygenation cause the immunoreactivity of tyrosine hydroxylase (TH) and neuropeptide Y (NPY) to change, suggesting that these changes may be associated with adaptive responses, which are presumably employed to avoid oxidative damage and provide the initial mechanism for survival. Caspase-3 immunoreactive neurons increased eight-fold in the brain and 7.2-fold in the VNC after 1 day of reoxygenation, and the TUNEL-positive cell percentage rose from 0% (control) to 8.4% in the brain and from 1.7% (control) to 13% in the VNC. The results of our study provide evidence that anoxia and reoxygenation can activate caspase-3 and facilitate apoptosis in the CNS of crabs. These results provide evidence that even short-term air exposure stress followed by reoxygenation can trigger significant apoptotic cell death in crustacean neural tissue, which is important for developing better live transport practices.

Keywords: apoptosis; caspase-3; crustaceans; dopamine.


Conflict of interest statement

The authors declare no conflicts of interest.

Figures

Figure 1
Figure 1
Kaplan–Meier survival curves of crabs, Erimacrus isenbeckii, in the control group (normoxia) and after experimental air exposure and reoxygenation (after 1, 7, and 14 days). Circles indicate crabs after air exposure and reoxygenation; triangles, control crabs. Only the air exposure/reoxygenation group showed mortality during the experimental period.
Figure 2
Figure 2
Distribution of neuropeptide Y (NPY)-like and tyrosine hydroxylase (TH)-like immunoreactivity in the median brain of control crabs, E. isenbeckii. (A). Horizontal sections through mid-ventral planes of the brain showing NPY-lir in AMPN, PMPN, LAN, MAN, and in neuronal clusters 11 and 14/15 (B). TH-lir in neuronal clusters 6, 11, and 14 and in AMPN, PMPN, LAN, and MAN (C). Neuronal clusters 11 and 14 including medium-sized neurons with high TH-lir (D). Horizontal sections through mid-ventral planes of the brain showing NPY- and TH-lir in AMPN, PMPN, CB, LAN, MAN, ON, and AnN and in clusters 6 and 9 (D1D3). Double-labeling for NPY (green) and TH (magenta) in cell cluster 9 (E). Immunolocalization of TH-lir in the proto- and deutocerebrum (FF3). Immunodetection of TH-lir (magenta) and its colocalization with NPY-lir (green) in cell cluster 11. The letter designations are as follows: AMPN, anterior medial protocerebral neuropil; PMPN, posterior medial protocerebral neuropil; ON, olfactory neuropil; CB, central body; LAN, lateral antenna l neuropil; MAN, medial antenna l neuropil; AnN, antenna II neuropil; 6, 9 and 11, 14/15 are cell clusters. Color designations: magenta indicates TH; green, NPY; blue, DAPI. Scale bars: 100 μm.
Figure 3
Figure 3
Changes in neuropeptide Y (NPY)-like and tyrosine hydroxylase (TH)-like immunoreactivity in the median brain of crabs, E. isenbeckii, after 1 day of air exposure (AC) and reoxygenation at 1 (DF), 7 (G), and 14 (HH3) days. High NPY-lir in fibers in AMPN and ON (A). NPY- and TH-lir in neurons of cell cluster 9 (B). TH-lir in fibers in AnN (C). A decrease in NPY-lir in AMPN, PMPN, MAN, LAN, and ON at 1 day of reoxygenation (D). A decrease in NPY- and TH-lir in neurons of cell cluster 9 (E). TH-lir in fibers of PMPN and MAN (F). NPY-lir in PMPN, MAN, LAN, and ON at 7 days of reoxygenation (G). NPY-lir in AMPN, PMPN, MAN, LAN, and ON at 14 days of reoxygenation (H). Immunodetection of TH- and NPY-lir and their colocalization in cell cluster 9 (H1H3). Changes in signal intensity of NPY- (I) and TH-lir (J) in the median brain after air exposure and reoxygenation (I). The letter designations are as follows: AMPN, anterior medial protocerebral neuropil; PMPN, posterior medial protocerebral neuropil; ON, olfactory neuropil; CB, central body; LAN, lateral antenna I neuropils; MAN, medial antenna l neuropils; 6, 9, and 11 are cell clusters. Color designations: magenta indicates TH; green, NPY; blue, DAPI. Scale bars: 100 μm. Data were analyzed by one-way ANOVA followed by Dunnett’s multiple comparison test in GraphPad Prism 7. Data are presented as mean ± standard error of the mean (n = 6); ns, no significance; ** p < 0.01; *** p < 0.001.
Figure 4
Figure 4
Distribution of neuropeptide Y (NPY)-like and tyrosine hydroxylase (TH)-like immunoreactivity in the ventral nerve cord (VNC) of control crabs, E. isenbeckii. Horizontal sections through the VNC showing NPY-lir in the suboesophageal ganglion (SEG), thoracic ganglia (TG), and abdominal ganglion (AG) (A). A part of the SEG showing TH-lir in dorsolateral clusters (DLC) and ventro-medial cluster (VMC) (B). A part of the SEG showing TH-lir neurons in VMC (C). TH-lir fibers in neuropils of TG (D). NPY-lir neurons in cell cluster 22 (E). Combined figure illustrating the distribution of NPY- and TH-lir in the SEG (F). Double-labeling for NPY- (green) and TH-lir (magenta) in neurons of VMC (F1F3). The letter designations are as follows: SEG, suboesophageal ganglion; TG, thoracic ganglion; TA, thoracic artery; T1–T5, neuropils of TG; DLC, dorsolateral cluster; VMC, ventro-medial cluster; AG, abdominal ganglion; 22 and 28 are cell clusters. Color designations: magenta indicates TH; green, NPY; blue, DAPI. Scale bars: 100 μm.
Figure 5
Figure 5
Changes in neuropeptide Y (NPY)-like and tyrosine hydroxylase (TH)-like immunoreactivity in the ventral nerve cord (VNC) of crabs, E. isenbeckii, after 1 day of air exposure (A,B) and reoxygenation at 1 (C,D), 7 (EG), and 14 (HK1) days. Mid-ventral section showing increase in NPY-lir in neuropils of thoracic ganglia (TG) (T1–T5) (A). Mid-ventral section showing decrease in TH-lir in TG (B). Decrease in NPY-lir in neuropil of TG (C). TH-lir in nerve fibers in TG (D). NPY-lir in SEG and TG after 1 day of reoxygenation (E). NPY-lir in cell cluster 22 (F). Increase in TH-lir in TG after 7 days of reoxygenation (G). Increase in NPY-lir in TG after 14 days of reoxygenation (H). Dorsal section showing NPY-lir in TG and AG (I). NPY-lir neurons in cell cluster 22 (J). Increase in NPY-lir in neurons and nerve fibers in the AG after 14 days of reoxygenation (K). Expression of NPY-lir in cell cluster 28 (K,K1). Changes in signal intensity of NPY- and TH-lir in VNC after air exposure and reoxygenation (L,M). The letter designations are as follows: SEG, suboesophageal ganglion; TA, thoracic artery; T1–T5, neuropils of TG; AG, abdominal ganglion; 22 and 28 are cell clusters. Color designations: magenta indicates TH; green, NPY; blue, DAPI. Scale bars: 100 μm. Data were analyzed by one-way ANOVA followed by Dunnett’s multiple comparison test in GraphPad Prism 7. Data are presented as mean ± standard error of the mean (n = 5); ns, no significance; * p < 0.05.
Figure 6
Figure 6
Changes in caspase-3-lir in the median brain of crabs, E. isenbeckii, in control (C,D) and after 1 day of air exposure (E,F) and reoxygenation at 1 (G,H), 7 (H,I), and 14 (JL) days. Caspase-3-lir neuron (A). DAPI staining of nuclei (B). Horizontal sections through mid-ventral planes of a part of the brain showing single caspase-3-lir neurons in clusters 6 and 11 (C). Caspase-3-lir neurons in cluster 11 (D). Increase in caspase-3 expression in clusters 6 and 11 after 1 day of air exposure (E). Expression of caspase-3 in neurons in clusters 11 (F). Increase in caspase-3 expression in cluster 6 after 1 day of air exposure (G). Caspase-3-lir neurons in clusters 9, 11, and 16 (H). Caspase-3-lir neurons in cluster 16 (I). Double-labeling for TH (green) and caspase-3 (red) in neurons of cluster 6 (JL). Numbers of caspase-3-positive cells in different median brain regions in control and after air exposure and reoxygenation (M). The letter designations are as follows: AMPN, anterior medial protocerebral neuropil; ON, olfactory neuropil; LAN, lateral antenna I neuropils; MAN, medial antenna l neuropils; 6, 9, 11, and 16 are cell clusters. Color designations: red indicates caspase-3; green, TH; blue, DAPI. Scale bars: 50 μm. Data were analyzed by one-way ANOVA followed by Dunnett’s multiple comparison test in GraphPad Prism 7. Data are presented as mean ± standard error of the mean (n = 6); ns, no significance; * p < 0.05; *** p < 0.001; **** p < 0.001.
Figure 7
Figure 7
Changes in caspase-3-lir in the ventral nerve cord (VNC) of crabs, E. isenbeckii, in control (AA2) and after 1 day of air exposure (BC2) and reoxygenation at 1 (DF), 7 (GG2), and 14 (H,I) days. Caspase-3-lir neurons in TG of control crabs (A). Presence of caspase-3-lir in cell cluster 28 (A1). Caspase-3-lir neurons in cell cluster 26 (A2). Expression of caspase-3 in cell clusters 21 (ventro-medial cluster, VMC), 22, and 23 (B). Caspase-3-lir neurons in cell clusters of TG (C). Numerous caspase-3-lir neurons in cell cluster 25 (C1). Caspase-3-lir neurons in cell cluster 28 of AG (C2). Caspase-3-lir neurons in cell cluster 26 of TG (D). Immunolabeling for TH (green) and caspase-3 (red); combined figure showing their colocalization in cell cluster 26 (EE2). Caspase-3-lir hemocytes in thoracic artery (TA) (F). Caspase-3-lir neurons in cell clusters of TG and AG after 7 days of reoxygenation (G). Caspase-3-lir neurons with altered nuclei in cell cluster 25 (G1). Numerous caspase-3-lir neurons in cell cluster 28 (G2). Caspase-3-lir neurons with altered nuclei in cell cluster 27 (red) and TH-lir nervous fibers (green) (H). Caspase-3-lir neurons in cell cluster 28 after 14 days of reoxygenation (I). Quantification for caspase-3 neurons in cell clusters in VNC of crabs, E. isenbeckii, in control, after 1 day of air exposure and at 1, 7, and 14 days of reoxygenation (J). The letter designations are as follows: SEG, suboesophageal ganglion; TA, thoracic artery; T1–T5, neuropils of TG; AG, abdominal ganglion; 21, 22, 23, 24, 25, 26, 27, and 28 are cell clusters. Color designations: red indicates caspase-3; green, TH; blue, DAPI. Scale bars: 50 μm. Data were analyzed by analyzed using a one-way analysis of variance (ANOVA) with Dunnett’s post hoc test or one-way ANOVA with Tukey’s multiple comparison tests. Data are presented as mean ± standard error of the mean (n = 6); **** p < 0.0001.
Figure 8
Figure 8
TUNEL-positive cells in the brain (A) and ventral nerve cord (VNC) (BI2) of crabs, E. isenbeckii, in control, after 1 day of air exposure, and at 1, 7, and 14 days of reoxygenation. Horizontal sections through mid-ventral planes of a part of the brain showing single TUNEL-positive cells in cluster 9 after 1 day of anoxia (A). TUNEL-positive cells in cluster 26 of TG in control crabs (B), after 1 day of air exposure (C), and after 1 day of reoxygenation (D). TUNEL-positive cells in cluster 26 of TG in control (EE2), after 1 day of air exposure (FF2), and reoxygenation at 1d (GG2), 7d (HH2), and 14 days (II2). Cytoplasmic TUNEL signaling in cluster 26 of TG after 14 days of reoxygenation (II2). Quantitative assessment of TUNEL-positive cells in the brain and VNC of crabs, E. isenbeckii, in control, after 1 day of air exposure and at 1, 7, and14 days (J,K). The letter designations are as follows: AMPN, anterior medial protocerebral neuropil; ON, olfactory neuropil; cell clusters 9, 26. Red indicates TUNEL staining; blue, DAPI staining. Scale bars: A–D—50 μm; E–I2—25 μm. Data analysis was performed in GraphPad Prism 7 using a one-way analysis of variance (ANOVA) with Dunnett’s post hoc test or one-way ANOVA with Tukey’s multiple comparison tests. Data are presented as mean ± SEM (n = 5), ns, no significance, ** p < 0.01, **** p < 0.0001.

Similar articles

References

    1. Mota V.C., Siikavuopio S.I., James P. Physiological responses to live air transport of red king crab (Paralithodes camtschaticus) Fish. Res. 2021;237:105882. doi: 10.1016/j.fishres.2021.105882. - DOI
    1. Cheng W., Liu C.H., Kuo C.M. Effects of dissolved oxygen on hemolymph parameters of freshwater giant prawn, Macrobrachium rosenbergii (de Man) Aquaculture. 2003;220:843–856. doi: 10.1016/S0044-8486(02)00534-3. - DOI
    1. Romero M.C., Ansaldo M., Lovrich G.A. Effect of aerial exposure on the antioxidant status in the subantarctic stone crab Paralomis granulosa (Decapoda: Anomura) Compar. Biochem. Physiol. Part C. 2007;146:54–59. doi: 10.1016/j.cbpc.2006.06.009. - DOI - PubMed
    1. Chen R., Lai U.H., Zhu L., Singh A., Ahmed M., Forsyth N.R. Reactive Oxygen Species Formation in the Brain at Different Oxygen Levels: The Role of Hypoxia Inducible Factors. Front. Cell Dev. Biol. 2018;6:132. doi: 10.3389/fcell.2018.00132. - DOI - PMC - PubMed
    1. Linh N.V., Khongcharoen N., Nguyen D.H., Dien L.T., Rungrueng N., Jhunkeaw C., Sangpo P., Senapin S., Uttarotai T., Panphut W., et al. Effects of hyperoxia during oxygen nanobubble treatment on innate immunity, growth performance, gill histology, and gut microbiome in Nile tilapia, Oreochromis niloticus. Fish Shellfish Immunol. 2023;143:109191. doi: 10.1016/j.fsi.2023.109191. - DOI - PubMed

LinkOut - more resources