. 2025 Jun 5;14(11):852.
doi: 10.3390/cells14110852.

Functional Characterization of LTR12C as Regulators of Germ-Cell-Associated TA-p63 in U87-MG and T98-G In Vitro Models

Affiliations

Functional Characterization of LTR12C as Regulators of Germ-Cell-Associated TA-p63 in U87-MG and T98-G In Vitro Models

Lucia Meola et al. Cells. .

Abstract

Glioblastoma multiforme (GBM) is a deadly disease known for its genetic heterogeneity. LTR12C is an endogenous retrovirus-derived regulator of pro-apoptotic genes and is normally silenced by epigenetic regulation. In this study, we found that the treatment of two glioblastoma cell lines, T98-G and U87-MG, with DNA methyltransferase (DNMT) and histone deacetylase (HDAC) inhibitors activated LTR12C expression. Combined treatment with these epigenetic drugs exerted a synergistic action on the LTR12C activation in both cell lines, while treatment with each drug as a single agent had a far weaker effect. A strong induction of the expression of the TP63 gene was seen in both cell lines, with the pro-apoptotic isoform GTA-p63 accounting for most of this increase. Coherently, downstream targets of p63, such as p21 and PUMA, were also induced by the combined treatment. Furthermore, we observed a significant reduction in the GBM cell growth and viability following the dual DNMT/HDAC inhibition. These findings reveal that the reactivation of LTR12C expression has the potential to modulate survival pathways in glioblastoma and provide information regarding possible epigenetic mechanisms that can be used to treat this deadly disease.

Keywords: GTA-p63; LTR12C; epigenetics; glioblastoma; p21.


Conflict of interest statement

The authors declare no conflicts of interest.

Figures
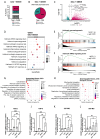
Figure 1
Figure 1
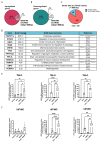
Differential gene expression analysis of the T98-G cells after dual DNMT1 and HDACs inhibition. (A) Bar plot of the percentage of genes upregulated, downregulated, or not regulated after the DNMT1 and HDACs inhibition in the T98-G cells (abs FC ≥ 2, p adj ≤ 0.05). (B) Pie chart of the differentially expressed genes after the combinatory DNMT1 and HDACs inhibition in the T98-G cells with respect to the control (abs FC ≥ 2, p adj ≤ 0.05). (C) Volcano plot of the differentially expressed genes after the DNMT1 and HDACs inhibition in the T98-G cells with respect to the control. (D) Gene Set Enrichment Analysis (GSEA) of the cancer hallmark gene sets from MSigDB in the T98-G cells treated with both DAC and SB939. (E,F) GSEA of spermatogenesis (E) and KRAS signaling down (F) signatures in the T98-G cells treated with both DAC and SB939. Bars represent individual genes in the ordered gene set list. The GSEA was performed by implementing the clusterProfiler package in R Studio. (version 2023.06.2+561). (G,H) Gene Ontology analysis of biological process categories enriched for upregulated (G) and downregulated genes (H) performed by using the topGO package in the R environment. The p value was calculated with the weighted Fisher’s exact test. (I,J) Quantitative RT-PCR of TIAM1 (I) and DUSP1 (J) gene expressions after the DNMT1 and/or HDACs inhibition in the T98-G cells. (K,L) Quantitative RT-PCR of the TIAM1 (K) and DUSP1 (L) gene expressions after the DNMT1 and/or HDACs inhibition in the U87-MG cells. The results are expressed as 2Ct. The data are expressed as the mean ± SD, * p value ≤ 0.05; ** p value ≤ 0.01; *** p value ≤ 0.001; **** p value ≤ 0.0001; test—unpaired two tailed t-test of treated samples vs. vehicle, corrected for multiple testing with the Bonferroni method.
Figure 2
Figure 2
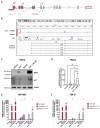
Dual DNMT1 and HDACs inhibition induced the expression of LTR12C-driven genes in the GBM cell models. (A) Overlap between the genes upregulated by cotreatment with DAC and SB939 in the T98-G cells and the genes that presented an LTR12C nearby (<5000 bp). (B) Overlap between the genes downregulated by the cotreatment with DAC and SB939 in the T98-G cells and the genes that presented a LTR12C nearby (<5000 bp). (C) Pie chart of protein coding and non-protein coding genes near to a LTR12C (<5.000 bp) and deregulated by the double inhibition of DNMT1 and HDACs in the T98-G cells. (D) Table of genes with an LTR12C that overlapped their TSSs and was deregulated after the cotreatment with DAC and SB939. KCNN2, PPP1R3A, and ACSBG1 were also found on the list provided by Othani et al. (E) Quantitative RT-PCR analysis of the GBP2, GBP5, and TP63 mRNA expression levels in the T98-G cells treated with 500 nM DAC and/or 500 nM SB939. (F) Quantitative RT-PCR analysis of the GBP2, GBP5, and TP63 global mRNA expressions in the U87-MG cells treated with 500 nM DAC and/or 500 nM SB939. The results are expressed as 2Ct. The data are expressed as the mean ± SD, * p value ≤ 0.05; ** p value ≤ 0.01; *** p value ≤ 0.001; **** p value ≤ 0.0001; test—unpaired two tailed t-test of treated samples vs. vehicle, corrected for multiple testing with the Bonferroni method.
Figure 3
Figure 3
DNMT1 and HDACs combined inhibition induced the GTA-p63 expression at the mRNA and protein levels in glioblastoma cell lines. (A) Schematic representation of the TP63 gene locus, showing three different alternative promoters (GTA, TA, and ΔN) and the position of primers used for the RT-qPCR analyses. (B) Gene body coverage of the RNA-seq reads on TP63 first exons in the T98-G cells treated with DAC and SB939 or vehicle shows that these drugs induced LTR12C-driven GTA-p63 expression, as visualized on IGV software. (C,D) Representative Western blot analysis of the p63 protein levels in T98-G after the treatment with 500 nM DAC and/or 500 nM SB939 for 96 h. (D) Densitometric analysis of C, performed with ImageJ (1.3K) software. (E,F) Quantitative RT-PCR analysis of GTA-p63, TA-p63α, and global TP63α levels in U87-MG (E) and T98-G (F) cells treated with 500 nM DAC and/or 500 nM SB939 for 96 h. The results are expressed as 2Ct. The data are expressed as the mean ± SD, * p value ≤ 0.05; *** p value ≤ 0.001; **** p value ≤ 0.0001; test—unpaired two tailed t-test of treated samples vs. vehicle, corrected for multiple testing with the Bonferroni method.
Figure 4
Figure 4
DNMT1 and HDACs combined inhibition affected the expression of the cell cycle-related genes. (A) Quantitative RT-PCR of the CDKN1A (p21) mRNA levels after the treatment with 500 nM DAC and/or 500 nM SB939 in the U87-MG (up) and T98-G (down). (B) Quantitative RT-PCR of the CDK4 mRNA levels after treatment with 500 nM DAC and/or 500 nM SB939 in the U87-MG (up) and T98-G (down). (C) Quantitative RT-PCR of the CDK6 mRNA levels after the treatment with 500 nM DAC and/or 500 nM SB939 in the U87-MG (up) and T98-G (down). The results are expressed as 2Ct. (D) Representative Western blot and densitometric analysis of CDKN1A (p21) protein levels in the U87-MG (left) and T98-G (right) cells after the inhibition of DNMT1 and/or HDACs. The data are expressed as the mean ± SD, * p value ≤ 0.05; ** p value ≤ 0.01; *** p value ≤ 0.001; test—unpaired two tailed t-test of treated samples vs. vehicle, corrected for multiple testing with the Bonferroni method.
Figure 5
Figure 5
DNMT1 and HDAC combinatory inhibition induced the expression of pro-apoptotic genes. (A,B) Quantitative RT-PCR of BBC3 (PUMA) and PMAIP (NOXA) mRNA expression levels after the treatment with 500 nM DAC and/or 500 nM SB939 in the U87-MG (A) and T98-G (B) cells. The results are expressed as 2Ct. (C) Representative Western blot and densitometric analysis of the PARP1 protein cleavage after the treatment with 500 nM DAC and/or 500 nM SB939 in the U87-MG (left) and T98-G (right) cells. (D) Representative Western blot analysis of the p53 protein expression level after the treatment with 500 nM DAC and/or 500 nM SB939 in the T98-G cells (left) and densitometric analysis (right). The data is expressed as the mean ± SD, * p value ≤ 0.05; ** p value ≤ 0.01; *** p value ≤ 0.001; test—unpaired two tailed t-test of treated samples vs. vehicle, corrected for multiple testing with the Bonferroni method.
Figure 6
Figure 6
Dual inhibition of DNMT1 and HDACs reduced the cell viability in the two glioblastoma cell models. (A) MTS analysis of the U87-MG (left) and T98-G (right) cells treated with 500 nM DAC and/or 500 nM SB939 for 96 h. (B) Dose–response curves of DAC, SB939, and DAC and SB939 in the U87-MG (left) and T98-G (right) cells treated for 96 h. The percentage of cell proliferation was calculated from Incucyte Live-Cell Analysis data as the percentage of the ratio of cell number of treated samples over the cell number of the control group. (C) Incucyte® Live-Cell Analysis of the U87-MG and T98-G cells during treatment with 500 nM DAC and/or 500 nM SB939 for 96 h. (D) Incucyte® Live-Cell Analysis of the numbers of dying U87-MG and T98-G cells during the treatments with 500 nM DAC and/or 500 nM SB939 for 96 h. The data are expressed as the mean ± SD, * p value ≤ 0.05; ** p value ≤ 0.01; *** p value ≤ 0.001; **** p value ≤ 0.0001; test—unpaired two tailed t-test of treated samples vs. vehicle for each time point, corrected for multiple testing with the Bonferroni method.

References

    1. Sturm D., Bender S., Jones D.T.W., Lichter P., Grill J., Becher O., Hawkins C., Majewski J., Jones C., Costello J.F., et al. Paediatric and Adult Glioblastoma: Multiform (Epi)Genomic Culprits Emerge. Nat. Rev. Cancer. 2014;14:92–107. doi: 10.1038/nrc3655. - DOI - PMC - PubMed
    1. Schaff L.R., Mellinghoff I.K. Glioblastoma and Other Primary Brain Malignancies in Adults: A Review. JAMA. 2023;329:574. doi: 10.1001/jama.2023.0023. - DOI - PMC - PubMed
    1. Medikonda R., Dunn G., Rahman M., Fecci P., Lim M. A Review of Glioblastoma Immunotherapy. J. Neurooncol. 2021;151:41–53. doi: 10.1007/s11060-020-03448-1. - DOI - PubMed
    1. Johnson W.E. Origins and Evolutionary Consequences of Ancient Endogenous Retroviruses. Nat. Rev. Microbiol. 2019;17:355–370. doi: 10.1038/s41579-019-0189-2. - DOI - PubMed
    1. Goyal A., Bauer J., Hey J., Papageorgiou D.N., Stepanova E., Daskalakis M., Scheid J., Dubbelaar M., Klimovich B., Schwarz D., et al. DNMT and HDAC Inhibition Induces Immunogenic Neoantigens from Human Endogenous Retroviral Element-Derived Transcripts. Nat. Commun. 2023;14:6731. doi: 10.1038/s41467-023-42417-w. - DOI - PMC - PubMed

Publication types

MeSH terms

Substances

LinkOut - more resources