

The distribution of the frailty index among different arthritis patients and the association between the frailty index and mortality in rheumatoid arthritis patients among U.S. adults (results from NHANES 1999-2018)
- PMID: 40498220
- PMCID: PMC12159114
- DOI: 10.1007/s40520-025-03091-8
The distribution of the frailty index among different arthritis patients and the association between the frailty index and mortality in rheumatoid arthritis patients among U.S. adults (results from NHANES 1999-2018)
Abstract
Background: We conducted to examine the prevalence of frailty among different arthritis populations and to elucidate the associations between frailty and all-cause and cause-specific mortality among rheumatoid arthritis (RA) in the American adults.
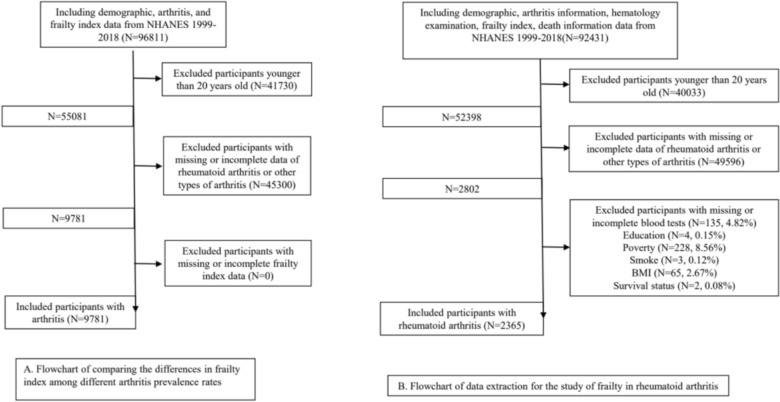
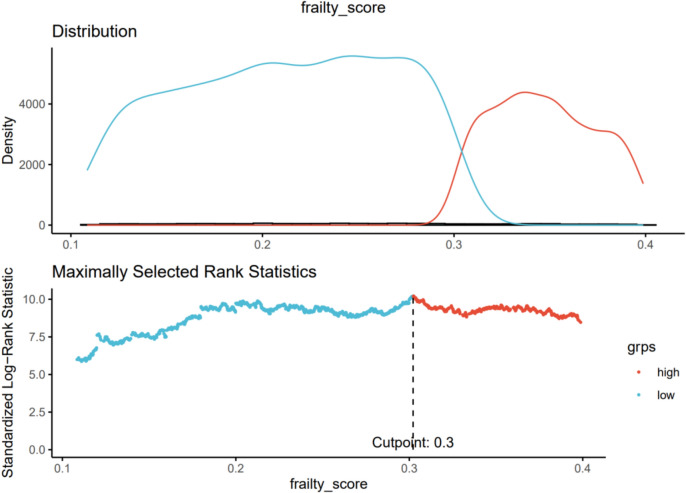
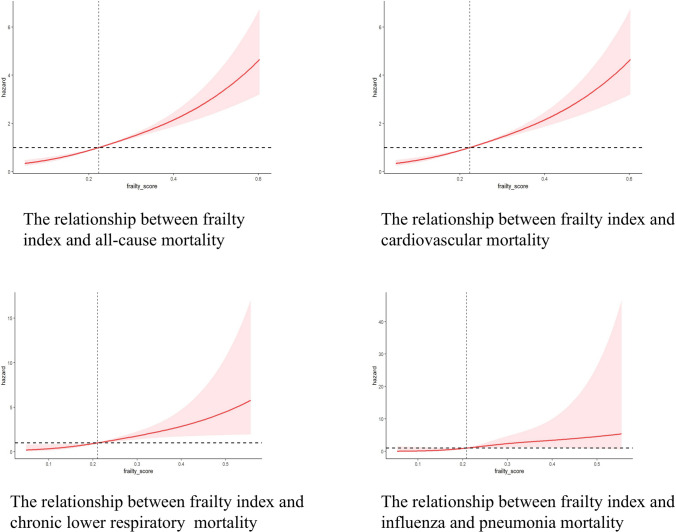
Method: National Health and Nutrition Examination Survey (NHANES) database spanning 1999 to 2018 was collected, supplemented with pertinent mortality records from the U.S. National Death Index (NDI) up to December 31, 2019. The Frailty Index defined by Searle was adopted. Different types of arthritis include: RA, Osteoarthritis (OA), Psoriatic Arthritis (PsA), and others. Statistical methods mainly included maximum selected rank statistics, univariate and multivariate COX regression models, and Restricted Cubic Spline (RCS).
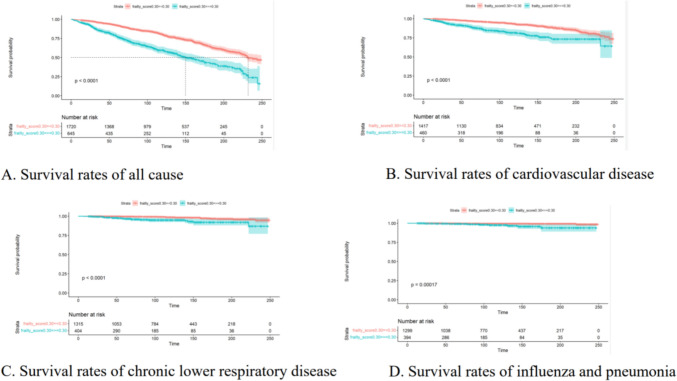
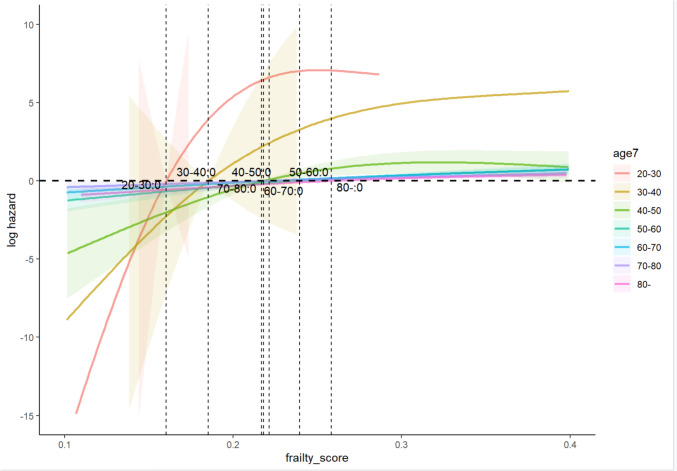
Results: The frailty indices of different arthritis populations were 0.24, 0.21, 0.21, and 0.20, respectively. The cut-off value for the frailty index was 0.3. Compared to those with a lower frailty index, participants with a higher frailty index exhibited higher risks of all-cause mortality (HR = 2.11, 95% CI 1.70-2.62), heart disease mortality (HR = 2.38, 95% CI 1.53-3.70), lower respiratory disease mortality (HR = 3.79, 95% CI 1.62-8.88), and influenza and pneumonia mortality (HR = 6.08, 95% CI 2.12-17.42). Frailty-associated all-cause mortality risks increased with age among different age groups.
Conclusion: Frailty was particularly pronounced among RA patients. Relatively high frailty index could predict higher all-cause and cause-specific mortality among RA adults in America, and the all-cause mortality related to frailty increased with age. Frailty index could be utilized as a prognostic marker in RA management. Timely interventions are paramount for optimizing patient outcomes.
Keywords: Frailty index; Mortality risk; Nutrition Examination Survey database; Rheumatoid arthritis; Survival analysis.
© 2025. The Author(s).
Conflict of interest statement
Declarations. Conflict of interest: The authors declare no competing interests. Human and animal rights: The NCHS research ethics review board approved the NHANES study protocol, and participants provided written informed consent at enrollment. The review board of Tongren Hospital, Shanghai Jiao Tong University School of Medicine determined the study to be exempt because it used publicly available de-identified data, and the patient had already signed informed consent upon enrollment. The present study followed the Strengthening the Reporting of Observational Studies in Epidemiology (STROBE) reporting guideline. Informed consent statement: None declared.
Figures
Similar articles
-
Association of the systemic immune-inflammation index with all-cause and cardiovascular mortality in individuals with rheumatoid arthritis.Sci Rep. 2024 Jul 2;14(1):15129. doi: 10.1038/s41598-024-66152-4. Sci Rep. 2024. PMID: 38956376 Free PMC article.
-
Red cell distribution width/albumin ratio and mortality risk in rheumatoid arthritis patients: Insights from a NHANES study.Int J Rheum Dis. 2024 Sep;27(9):e15335. doi: 10.1111/1756-185X.15335. Int J Rheum Dis. 2024. PMID: 39278721
-
Urinary albumin-to-creatinine ratio for predicting risk of all-cause mortality and specific-cause mortality in patients with rheumatoid arthritis: evidence from NHANES 1999-2018.Clin Rheumatol. 2025 Feb;44(2):623-633. doi: 10.1007/s10067-024-07272-0. Epub 2024 Dec 30. Clin Rheumatol. 2025. PMID: 39738846
-
Association of prognostic nutritional index with the presence and all-cause mortality of rheumatoid arthritis: the National Health and Nutrition Examination Survey 2003-2018.BMC Public Health. 2024 Nov 26;24(1):3281. doi: 10.1186/s12889-024-20795-0. BMC Public Health. 2024. PMID: 39593001 Free PMC article.
-
The comprehensive relationship between combined anti-inflammatory and healthy diets and all-cause mortality in rheumatoid arthritis: results from NHANES 2003-2018.Arthritis Res Ther. 2024 Dec 23;26(1):226. doi: 10.1186/s13075-024-03462-y. Arthritis Res Ther. 2024. PMID: 39716234 Free PMC article.
References
MeSH terms
LinkOut - more resources
Full Text Sources
Medical
Research Materials
Miscellaneous
