. 2025 Jun 13;11(24):eadt7589.
doi: 10.1126/sciadv.adt7589. Epub 2025 Jun 11.

Endothelial CLEC5A drives barrier dysfunction and vascular leakage responsible for lung injury in bacterial pneumonia and sepsis

Affiliations

Endothelial CLEC5A drives barrier dysfunction and vascular leakage responsible for lung injury in bacterial pneumonia and sepsis

Tie-Ning Zhang et al. Sci Adv. .

Abstract

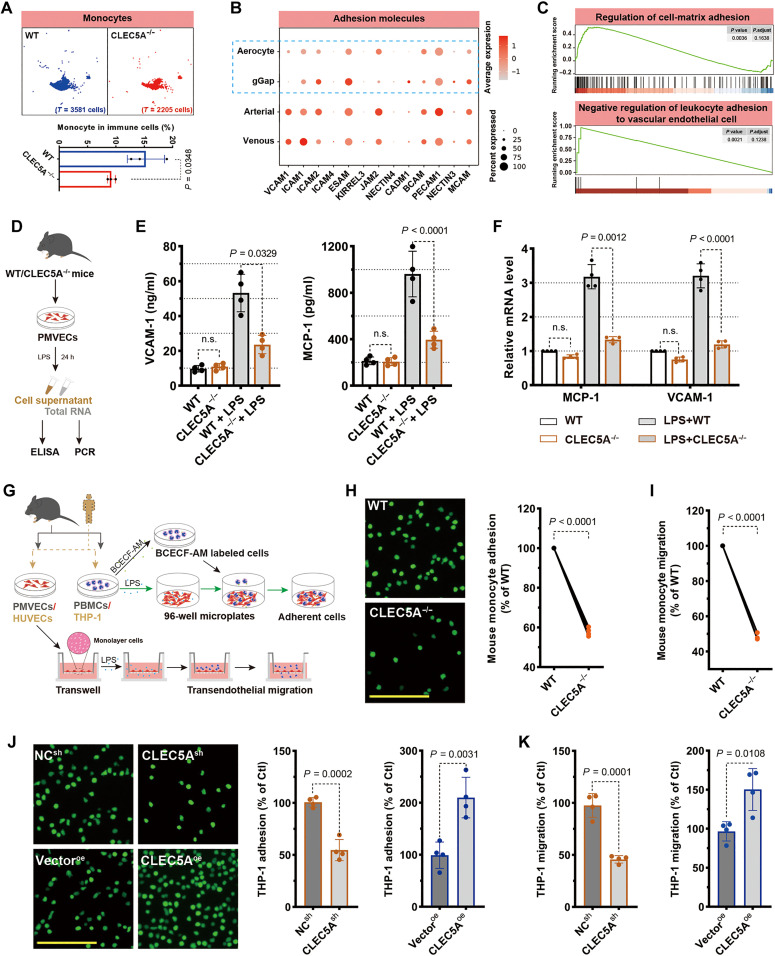
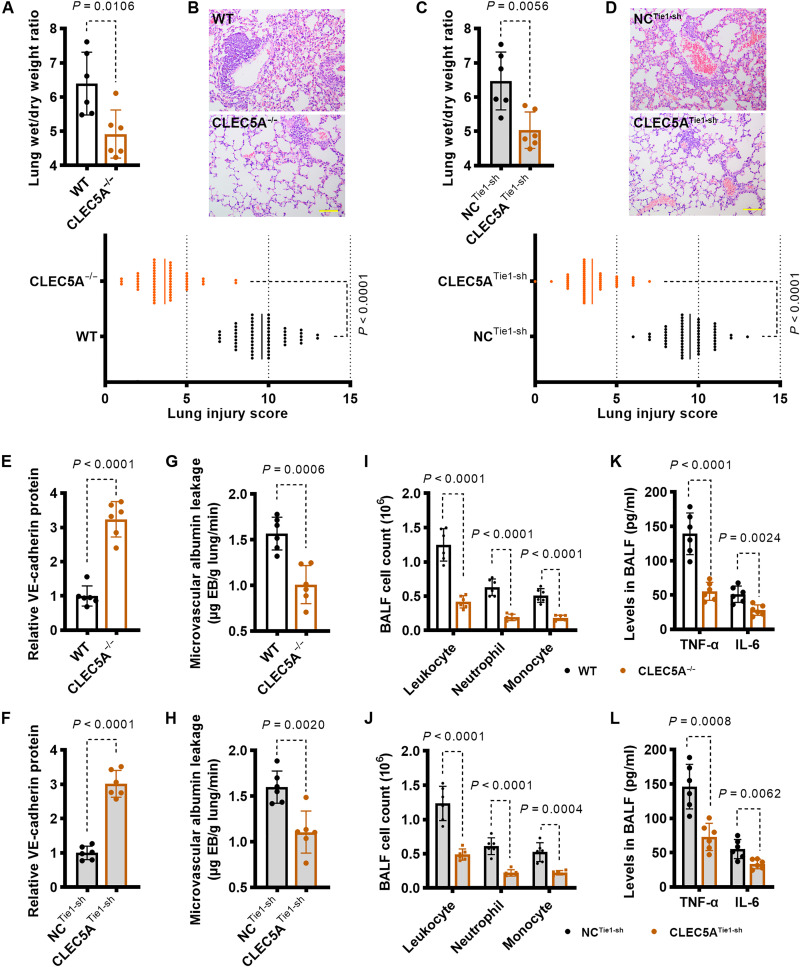
Endothelial barrier dysfunction and the resulting vascular injury are responsible for multiorgan failure in sepsis. Myeloid C-type lectin domain family 5 member A (CLEC5A) is a pattern recognition receptor involved in host defense against infection. Mice lacking CLEC5A were resistant to cecal ligation and puncture (CLP)-induced polymicrobial sepsis and lipopolysaccharide (LPS)-induced endotoxemia, as observed by decreased mortality. Single-cell RNA sequencing revealed transcriptomic heterogeneity of vascular endothelial cells in CLEC5A-deficient lungs following CLP. Endothelial-specific knockdown of CLEC5A improved survival of CLP-challenged mice, which was completely ineffective with reexpression of endothelial CLEC5A. The survival benefits were attributed to alleviated inflammatory storm and vascular leakage. Furthermore, endothelial CLEC5A deficiency protected mice against Escherichia coli-induced pneumonia. In vitro, CLEC5A deletion maintained trans-endothelial electrical resistance, and inhibited adhesion and trans-endothelial migration of monocytes/neutrophils under LPS stimulation. The study unveils the importance of CLEC5A in regulating endothelial barrier function and suggests endothelial CLEC5A as a therapeutic target for pneumonia or sepsis-causing bacterial infection.


Figures

Fig. 1.
Fig. 1.. Genetic knockout of CLEC5A improves the survival of mice with endotoxemia or polymicrobial sepsis.
(A) Analysis of the gene expression profiles of datasets (GSE28750, GSE206635, GSE1871, and GSE34901) downloaded from the NCBI GEO database and identification of CLEC5A as a potential gene related to sepsis and sepsis-induced acute lung injury. Top DEGs among C-type lectin domain family were displayed based on the limma with P < 0.05 and FC > 1.5 and sorted by the robust rank aggregation. Genes on white panel meet score (P value) < 0.05 and frequency (Freq) ≥ 3. Blue font highlights the top-ranked gene. NA, not applicable. (B) mRNA expression of CLEC5A in blood samples from patients with sepsis (GSE28750), lung tissues from patients with COVID-19 (GSE206635), and lungs from mice with LPS-induced lung injury (GSE1871) and E. coli–induced pneumonia (GSE34901). (C) Two mouse models of sepsis were established in this study, including bacterial LPS-induced endotoxemia and CLP-induced polymicrobial sepsis. PMVECs were isolated from corresponding mice. (D) Representative images of immunofluorescence staining for CLEC5A with DAPI counterstaining of nuclei in lung tissues, 4 hours after LPS or 12 hours after CLP (biological replicates, n = 6 per group). Scale bars, 100 μm. (E) Western blotting analysis and representative blots showing the expression of CLEC5A in PMVECs from mice challenged by LPS or CLP (biological replicates, n = 6 per group). h, hours. (F) mRNA expression of CLEC5A in mouse PMVECs (biological replicates, n = 6 per group). (G) Schematic diagram of CLEC5A genetic knockout (KO) mice (CLEC5A−/−) generation. CLEC5A−/− mice were generated on a C57BL/6 background by the CRISPR-Cas9 system, and WT littermates were used as the control. (H) Survival rate of mice after LPS or CLP challenge (biological replicates, n = 10 per group). The statistical significance was determined by repeated measures two-way ANOVA analysis using the Geisser-Greenhouse correction. The statistical significance between survival curves was determined by P value using the log-rank (Mantel-Cox) test. n.s., not significant.
Fig. 2.
Fig. 2.. scRNA-seq analysis of endothelial cells in the lungs after CLP.
(A) Overview of the study design for scRNA-seq. (B) UMAP plot of 14 cell types identified from the lungs of CLEC5A−/− mice and WT littermates (biological replicates, n = 3 per group), including granulocyte, T cell, B cell, AM, monocyte, macrophage, NKT, mesothelium, NK, endothelial, fibroblast, DC, epithelial, and SMC. They were grouped into immune cells and nonimmune cells. (C) UMAP plot of endothelial features showing the distribution of established marker gene PECAM1. Gene expression level is shown by purple color grading. (D) Violin plot depicting the expression level of endothelial cell-type marker gene PECAM1. (E) Representative immunofluorescence images showing coexpression of CLEC5A and CD31 (encoded by gene PECAM1) in lung tissues (biological replicates, n = 6 per group). Scale bars, 50 μm. Percentage of CLEC5A+CD31+ in total CD31+ cells was quantified. (F) Relative expression of PECAM1 mRNA and CD31 protein levels in PMVECs. The statistical significance between two groups was determined by an unpaired two-tailed t test and comparisons among more than two groups by one-way ANOVA analysis. (G) UMAP plot of endothelial cell clusters in CLEC5A−/− mice (red dots) and WT littermates (blue dots). (H) UMAP plot of endothelial cell subtypes and cell percentage, including endothelial cells of lymphatic, aerocyte, gCap, arterial, and venous types. (I) GO and KEGG enrichment analysis for DEGs in endothelial cells between CLEC5A−/− mice and WT littermates (FC > 1.5 or FC < 0.67 and P < 0.05). Bar plots of top 10 enriched GO-BP and KEGG pathways. The significance of enrichment was determined by P value < 0.05.
Fig. 3.
Fig. 3.. Deletion of CLEC5A protects against CLP-induced lung injury in mice.
CLEC5A−/− transgenic mice and WT littermates were subjected to CLP to induce polymicrobial sepsis, and mice received sham operation as the control. The lungs were collected at 12 hours post-CLP. (A) Gross morphology of the lung at 12 hours post-CLP operation. (B) Lung index shown as the percentage of lung weight to body weight. (C) Ratio of lung wet-to-dry weight. (D) Representative images of H&E staining of lung tissues in sham and CLP mice. In the CLP group, images on the right panel represent the region marked by a black square from the left panel. Scale bars, 100 μm. (E) Severity of CLP-induced lung injury determined by inflammation, edema, hemorrhage, and alveolar septal thickening, corresponding to H&E staining. (F) Inflammatory cell counts in BALF, including total leukocytes and differential neutrophils and monocytes. (G and H) Levels of inflammatory cytokines and chemokines in BALF and lung tissues, including TNF-α, IL-6, MCP-1, and CXCL5. The statistical significance for lung wet/dry weight ratio and lung injury score was determined by the Kruskal-Wallis test, and others were determined by one-way ANOVA analysis (biological replicates, n = 6 per group for each experiment).
Fig. 4.
Fig. 4.. Specific deletion of endothelial CLEC5A improves the survival after CLP and decreases pulmonary endothelial barrier permeability.
(A) In vivo endothelial-specific expression or knockdown of CLEC5A was carried out via tail vein injection of AAV9 under promoter Tie1. (B) Expression of CLEC5A in PMVECs isolated from WT and CLEC5A−/− mice (biological replicates, n = 4 per group). (C) Survival rate of WT mice with endothelial-specific CLEC5A overexpression or knockdown (CLEC5ATie1-oe or CLEC5ATie1-sh) (biological replicates, n = 10 per group). (D) Survival rate of CLEC5A−/− mice with CLEC5ATie1-oe (biological replicates, n = 10 per group). The statistical significance between survival curves was determined by P value using the log-rank test for trend. (E) Experimental design for in vivo and in vitro studies of pulmonary endothelial barrier function. (F) Pulmonary microvascular albumin leakage was determined as the content of EB dye-labeled albumin in the lung (biological replicates, n = 6 per group). (G and H) Expression of VE-cadherin in lung tissues and PMVECs isolated from CLEC5A−/− mice and WT littermates after CLP challenge (biological replicates, n = 6 per group). (I) The permeability of the PMVEC monolayer was measured using FITC-labeled dextran by a transwell assay under LPS (10 μg/ml, 24 hours) (biological replicates, n = 4 per group). (J) TEER was assessed in LPS-challenged PMVECs (10 μg/ml, 4 hours) (biological replicates, n = 4 per group). (K) Quantification and representative images of immunofluorescence staining for VE-cadherin in PMVECs. Scale bar, 50 μm. (L) Expression of VE-cadherin in PMVECs with lentivirus-mediated CLEC5A overexpression (CLEC5Aoe) or knockdown (CLEC5Ash) under LPS treatment (10 μg/ml, 24 hours) (biological replicates, n = 4 per group). The statistical significance between two groups was determined by an unpaired two-tailed t test and comparisons among more than two groups by one-way ANOVA analysis.
Fig. 5.
Fig. 5.. CLEC5A promotes endothelial adhesion and transmigration of monocytes in vitro.
(A) UMAP plot of monocyte clusters in WT lungs (n = 3) and CLEC5A−/− lungs (n = 3) and percentage in immune cells. (B) Dot plot showing the expression of adhesion molecules in each subtype of endothelial cells. (C) GSEA of the DEGs in the endothelial cells between CLEC5A−/− and WT lungs showing significant enrichment of cell-adhesion related-GO pathways, in which the up-regulated DEGs were mainly enriched. The significance was determined by P value with false discovery rate (FDR) < 0.25. (D) Mouse PMVECs were isolated and challenged by LPS (10 μg/ml) for 24 hours. (E) Levels of MCP-1 and VCAM-1 in the supernatant by ELISA. (F) Relative mRNA expression of MCP-1 and VCAM-1 in PMVECs. (G) Overview of in vitro adhesion and trans-endothelial migration assays in mouse PMVECs and HUVECs. (H) Mouse PBMCs were labeled by BCECF-AM, and the adherent monocytes to PMVECs were observed under a fluorescence microscopy. Scale bar, 50 μm. Monocyte-endothelial adhesion was quantified as the percentage of fluorescence intensity relative to the WT group. (I) Transmigration of mouse PBMCs across the PMVEC monolayer was shown as the percentage of transmigrated cells relative to the WT group by MTT assay. Lentivirus-mediated gene delivery for CLEC5A (CLEC5Aoe) or shRNA targeting CLEC5A (CLEC5Ash) were carried out in HUVECs. (J) Adhesion of THP-1 to HUVECs was shown as fluorescence and quantified as the percentage of fluorescence intensity relative to the control group. Scale bar, 50 μm. (K) Migration of THP-1 through the HUVEC monolayer shown as the percentage of transmigrated cells relative to the control group. The statistical significance was determined by an unpaired two-tailed t test (or with Welch’s correction) for comparison between two groups and by one-way ANOVA test for comparisons among four groups (biological replicates, n = 4 per group for each experiment).
Fig. 6.
Fig. 6.. CLEC5A promotes trans-endothelial migration of neutrophils in vitro.
Mouse PMVECs were exposed to LPS (10 μg/ml) for 24 hours, and the production of CXCL5 and ICAM-1 was detected in the presence or absence of CLEC5A. Expression of CXCL5 and ICAM-1 by real-time PCR in (A) PMVECs from CLEC5A−/− transgenic mice and (B) in PMVECs with lentivirus-mediated overexpression (CLEC5Aoe) or knockdown of CLEC5A (CLEC5Ash). (C and D) Respective levels in the supernatant by ELISA. (E) Migration of neutrophils across LPS-challenged PMVECs was determined by a transmigration assay. Peripheral blood granulocytes were obtained from normal C57BL/6J mice, and granulocytes that transmigrated across the PMVEC monolayer were identified as neutrophils under phase contrast microscopy. Representative images of transmigrated neutrophils to cross (F) PMVECs from CLEC5A−/− mice and (G) PMVECs infected with lentivirus-expressing CLEC5A (CLEC5Aoe) or shRNA targeting CLEC5A (CLEC5Ash). Scale bars, 50 μm. Trans-endothelial migration of neutrophils was quantified as the percentage of transmigrated cell number relative to WT or control group. Cells with LPS stimulation but without infection were served as the controls. The statistical significance was determined by an unpaired two-tailed t test for comparison between two groups and by one-way ANOVA test for comparisons among four groups (biological replicates, n = 4 per group for each experiment).
Fig. 7.
Fig. 7.. Endothelial CLEC5A deficiency protects mice against E. coli–induced pneumonia.
Mice were intratracheally inoculated with 1.5 × 107 CFUs of E. coli and euthanized after 16 hours. The lungs were collected from CLEC5A−/− mice and endothelial-deficient mice (CLEC5ATie1-sh). (A and C) Ratio of lung wet-to-dry weight. (B and D) Representative images of H&E staining of lung tissues and quantitative analysis of lung injury severity. Scale bars, 100 μm. (E and F) Relative expression of VE-cadherin in lung tissues. (G and H) Mice received EB at 16 hours after bacterial inoculation, and pulmonary microvascular albumin leakage (μg EB/g lung per minute) was determined after 30 min. (I and J) BALF cell counts of leukocyte, neutrophil, and monocyte. (K and L) BALF levels of TNF-α and IL-6. The statistical significance between two groups was determined by an unpaired two-tailed t test, and the Mann-Whitney test was used for lung injury score (biological replicates, n = 6 per group for each experiment).
Fig. 8.
Fig. 8.. Transcriptome changes in vascular/capillary endothelial cells by scRNA-seq analysis.
An in-depth analysis of the DEGs was carried out in specific endothelial subtypes. (A) Heatmaps of the DEGs among five subtypes of endothelial cells between WT and CLEC5A−/− lungs. The column is hierarchically ordered by the subtypes of endothelial cells (aerocyte, arterial, gCap, lymphatic, and venous) and then groups of WT and CLEC5A−/−, with single-cell gene expression represented by each column. The vascular endothelial cells include subtypes of aerocyte, arterial, gCap and venous. The capillary endothelial cells include aerocyte and gCap of endothelial cells. (B) Number of the DEGs in capillary (gCap and aerocyte), arterial, venous, and lymphatic types of endothelial cells. (C) Violin plots showing the expression of SCARB1, PODXL, RAMP2, and FABP4 in capillary endothelial cells. The expression was further validated in primary PMVECs isolated from CLEC5A−/− mice or WT littermates 12 hours post-CLP. (D) Representative blots showing SCARB1, PODXL, FABP4, and RAMP2 expression. (E and F) The relative protein and mRNA expression levels were analyzed (biological replicates, n = 4 per group). The statistical significance was determined by an unpaired two-tailed t test for comparison between two groups.
Fig. 9.
Fig. 9.. Potential downstream targets of CLEC5A in CLP-induced lung injury.
To validate SCARB1, PODXL, RAMP2, and FABP4 as potential targets of CLEC5A in vivo, endothelial-specific gene knockdown/overexpression was carried out under Tie1 by AAV9 through tail vein injection. (A to D) Survival rate of CLEC5A−/− mice with endothelial knockdown/overexpression of target gene after CLP (biological replicates, n = 10 per group). The statistical significance between survival curves was determined by P value using the log-rank (Mantel-Cox) test. (E to G) H&E staining showing histological changes in lung tissues and the corresponding lung injury score (biological replicates, n = 6 per group). Scale bars, 100 μm. (H and I) Pulmonary microvascular albumin leakage represented as μg EB/g lung per minute (biological replicates, n = 6 per group). (J and K) Levels of TNF-α, IL-6, and MCP-1 in the BALF (biological replicates, n = 6 per group). (L and M) Levels of TNF-α, IL-6, and MCP-1 in the lungs (biological replicates, n = 6 per group). (N and O) Quantification of inflammatory cells in the BALF, including leukocyte, neutrophil, and monocyte (biological replicates, n = 6 per group). (P) HUVECs were coinfected with LV expressing CLEC5Ash and PODXLsh. The monocyte-endothelial adhesion and trans-endothelial migration assays were carried out under LPS stimulation. (Q) Adhesion of THP-1 to HUVECs (biological replicates, n = 4 per group). (R) Transmigration of THP-1 across HUVECs (biological replicates, n = 4 per group). The statistical significance was determined by an unpaired two-tailed t test (or with Welch’s correction) for comparison between two groups.

References

    1. Singer M., Deutschman C. S., Seymour C. W., Shankar-Hari M., Annane D., Bauer M., Bellomo R., Bernard G. R., Chiche J.-D., Coopersmith C. M., Hotchkiss R. S., Levy M. M., Marshall J. C., Martin G. S., Opal S. M., Rubenfeld G. D., van der Poll T., Vincent J.-L., Angus D. C., The third international consensus definitions for sepsis and septic shock (Sepsis-3). JAMA 315, 801–810 (2016). - PMC - PubMed
    1. Deutschman C. S., Tracey K. J., Sepsis: Current dogma and new perspectives. Immunity 40, 463–475 (2014). - PubMed
    1. Keeley A., Hine P., Nsutebu E., The recognition and management of sepsis and septic shock: A guide for non-intensivists. Postgrad. Med. J. 93, 626–634 (2017). - PubMed
    1. Cecconi M., Evans L., Levy M., Rhodes A., Sepsis and septic shock. Lancet 392, 75–87 (2018). - PubMed
    1. Sevransky J. E., Levy M. M., Marini J. J., Mechanical ventilation in sepsis-induced acute lung injury/acute respiratory distress syndrome: An evidence-based review. Crit. Care Med. 32, S548–S553 (2004). - PubMed

MeSH terms