. 2025 Jun 13;11(24):eads5589.
doi: 10.1126/sciadv.ads5589. Epub 2025 Jun 11.

Phage display enables machine learning discovery of cancer antigen-specific TCRs

Affiliations

Phage display enables machine learning discovery of cancer antigen-specific TCRs

Giancarlo Croce et al. Sci Adv. .

Abstract

T cells targeting epitopes in infectious diseases or cancer play a central role in spontaneous and therapy-induced immune responses. Epitope recognition is mediated by the binding of the T cell receptor (TCR), and TCRs recognizing clinically relevant epitopes are promising for T cell-based therapies. Starting from a TCR targeting the cancer-testis antigen NY-ESO-1157-165 epitope, we built large phage display libraries of TCRs with randomized complementary determining region 3 of the β chain. The TCR libraries were panned against NY-ESO-1, which enabled us to collect thousands of epitope-specific TCR sequences. Leveraging these data, we trained a machine learning TCR-epitope interaction predictor and identified several epitope-specific TCRs from TCR repertoires. Cellular assays revealed that the predicted TCRs displayed activity toward NY-ESO-1 and no detectable cross-reactivity. Our work demonstrates how display technologies combined with TCR-epitope interaction predictors can effectively leverage large TCR repertoires for TCR discovery.


Figures
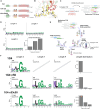
Fig. 1.
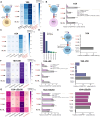
Fig. 1.. Phage display reveals CDR3β binding motifs of TCRs specific for NY-ESO-1.
(A) Description of the three template TCRs used in the phage libraries. Amino acid substitutions of the 1G4-c50 and 1G4-c53c50 templates are highlighted in bold. The core region of the CDR3β (YVGNT) is highlighted in red. Kd is the dissociation constant, a measure of binding affinity. (B) Illustration of the 1G4 - NY-ESO-1 complex [PDB: 2BNR; (78)]. The α-carbons of the core region of the CDR3β loop are represented as spheres. (C) Schematic of the design of the randomized TCR libraries for the phage display experiments. The TCRs have random amino acid sequences of lengths 5, 7, and 9 in the core region of the CDR3β loops. (D) Sequence motifs and length distribution of the core region of CDR3β loops in input phage libraries. (E) Illustration of the phage display experiment. The randomized TCRs expressed in phages were panned against the NY-ESO-1 pMHC monomer and sequenced. (F) Motifs and length distributions of the core regions of the CDR3β loops resulting after selection of phage libraries and motif deconvolution. Created in BioRender. G. Croce (2025), https://BioRender.com/r19q929.
Fig. 2.
Fig. 2.. Integrating phage display data with machine learning tools enables robust predictions of NY-ESO-1–specific TCRs.
(A) Illustration of training of MixTCRpred with CDR3β sequences obtained with the phage display screening, and evaluation of sequences from TCR repertoires of donors. (B) The receiver operating characteristic (ROC) curves obtained with a fivefold cross-validation based on the phage display data. The black dashed line is the mean ROC curve. (C) Distribution of the MixTCRpred scores of CDR3β sequences from TCR repertoires. The blue lines show the scores of the 30 CDR3β sequences selected for experimental testing. The dashed blue line shows the score of the reference CDR3β sequence CASSYVGNTGELFF. (D) Percentage of multimer+CD8+ cells among Jurkat cells transduced with each of the 30 TCRs selected in (C). TCRs are labeled on the basis of the sequence of the core region of CDR3β loops and ordered by the MixTCRpred scores. Stars indicate TCRs considered as NY-ESO-1 specific. (E) MixTCRpred scores of the TCRs with different CDR3β loops that could (green) or could not (white) be experimentally validated with the 1G4, 1G4-c50, and 1G4-c53c50 templates. The MixTCRpred scores of the positive control (the reference CDR3β sequence CASSYVGNTGELFF) and of the negative control (the CASSVDTNTGELFF sequence) are also shown. Points with an orange border represent TCRs that were also identified in the phage display screening and, therefore, part of the MixTCRpred training set. (F) Length of the core region of the CDR3β sequences that were tested (dashed lines) and validated (solid lines) for the three TCR templates. Created in BioRender. G. Croce (2025), https://BioRender.com/r28h762.
Fig. 3.
Fig. 3.. Computational models trained on phage display data outperforms other approaches for predictions of NY-ESO-1–specific TCRs.
(A) AUC achieved by MixTCRpred trained on the phage display data generated with the 1G4 template TCRs. (B) AUCs obtained with two deep learning predictors including the data generated with the phage display in their training sets. (C) AUCs achieved with two distance-based predictors including the data generated with the phage display in their training sets. (D) AUC obtained by looking for an exact match of the TCRs in the data generated by phage display. (E) AUCs obtained with two pretrained deep learning predictors that do not include the data generated with the phage display in their training sets. (F) AUCs achieved with two distance-based models by computing sequence similarity to the reference CDR3β (CASSYVGNTGELFF). Created in BioRender. G. Croce (2025), https://BioRender.com/h07r133.
Fig. 4.
Fig. 4.. TCRs identified by MixTCRpred display activity toward NY-ESO-1 and no detectable cross-reactivity.
(A) Heatmap showing the fraction of CD69+PD-1+ Jurkat cells encoding four TCRs on the 1G4 template after coculture with T2 cells pulsed with NY-ESO-1 at different concentrations. The CMV-derived epitope NLVPMVATV served as negative control. Mean values from three independent experiments are shown. The core region of the CDR3β loop is shown in the heatmap. (B) Fraction of CD69+PD-1+ Jurkat cells activated by coculture with HLA-A*02:01–positive Me275 melanoma cells expressing NY-ESO-1. Me275 pulsed with NY-ESO-1 at 1 μg/ml were used as positive controls; assays without Me275 served as negative controls. Mean values from two independent experiments in duplicate are shown. (C) Heatmap showing the fraction of CD69+PD-1+ Jurkat cells after coculture with T2 cells pulsed with three peptides from the self-proteome at peptide concentration of 0.1 μg/ml. NY-ESO-1 served as positive control and NLVPMVATV as negative control. Data from three independent experiments; the mean values are shown. (D) Number of HLA ligands identified by MS in HLA-A*02:01–transduced Jurkat cells and predicted to bind to the transduced or the endogenous HLAs. (E) Fraction of CD69+PD-1+ Jurkat cells activated by coculturing with HLA-A*02:01–transduced Jurkat cells presenting peptides derived from the self-proteome. Jurkat cells without any TCR expression were used as negative controls, while Jurkat cells expressing the affinity-enhanced TCR 1G4-c53c50 were used as positive controls. Mean values from three independent experiments in duplicate are shown. (F and G) Fraction of CD69+PD-1+ Jurkat cells expressing the four TCRs on the affinity-enhanced 1G4-c50 (F) and 1G4-c53c50 (G) templates under three conditions: stimulation with the indicated peptide at 0.1 μg/ml, coculture with Me275 cells, and stimulated by peptides derived from the self-proteome. Created in BioRender. G. Croce (2025), https://BioRender.com/z88e433.
Fig. 5.
Fig. 5.. Structural analyses reveal the molecular basis of the CDR3β binding motifs.
(A) Predicted binding modes of three CDR3β loops (CASSYVGNNGELFF, CASSYVGHRGELFF, and CASSNLGGLGELFF, in red), overlapped with the reference CDR3β (CASSYVGNTGELFF, in blue). The molecular modeling was performed using the crystal structure of the 1G4 template (PDB: 2BNR). The α-carbons of the core region of the CDR3β loops are represented as spheres. (B) Beta factor of the core region of the CDR3β loop (PDB: 2BNR). (C) Normalized solvent-excluded surface area (SESA) of amino acid side chains in the core region of CDR3β loop in the 1G4-c53c50 template (PDB: 2P5W, residue numbering based on PDB: 2BNR). Created in BioRender. G. Croce (2025), https://BioRender.com/m22r428.

References

    1. Hodi F. S., O’Day S. J., McDermott D. F., Weber R. W., Sosman J. A., Haanen J. B., Gonzalez R., Robert C., Schadendorf D., Hassel J. C., Akerley W., van den Eertwegh A. J. M., Lutzky J., Lorigan P., Vaubel J. M., Linette G. P., Hogg D., Ottensmeier C. H., Lebbé C., Peschel C., Quirt I., Clark J. I., Wolchok J. D., Weber J. S., Tian J., Yellin M. J., Nichol G. M., Hoos A., Urba W. J., Improved survival with ipilimumab in patients with metastatic melanoma. N. Engl. J. Med. 363, 711–723 (2010). - PMC - PubMed
    1. Wolchok J. D., Chiarion-Sileni V., Gonzalez R., Rutkowski P., Grob J.-J., Cowey C. L., Lao C. D., Wagstaff J., Schadendorf D., Ferrucci P. F., Smylie M., Dummer R., Hill A., Hogg D., Haanen J., Carlino M. S., Bechter O., Maio M., Marquez-Rodas I., Guidoboni M., McArthur G., Lebbé C., Ascierto P. A., Long G. V., Cebon J., Sosman J., Postow M. A., Callahan M. K., Walker D., Rollin L., Bhore R., Hodi F. S., Larkin J., Overall survival with combined nivolumab and ipilimumab in advanced melanoma. N. Engl. J. Med. 377, 1345–1356 (2017). - PMC - PubMed
    1. Tanyi J. L., Bobisse S., Ophir E., Tuyaerts S., Roberti A., Genolet R., Baumgartner P., Stevenson B. J., Iseli C., Dangaj D., Czerniecki B., Semilietof A., Racle J., Michel A., Xenarios I., Chiang C., Monos D. S., Torigian D. A., Nisenbaum H. L., Michielin O., June C. H., Levine B. L., Powell D. J. Jr., Gfeller D., Mick R., Dafni U., Zoete V., Harari A., Coukos G., Kandalaft L. E., Personalized cancer vaccine effectively mobilizes antitumor T cell immunity in ovarian cancer. Sci. Transl. Med. 10, eaao5931 (2018). - PubMed
    1. Sender R., Weiss Y., Navon Y., Milo I., Azulay N., Keren L., Fuchs S., Ben-Zvi D., Noor E., Milo R., The total mass, number, and distribution of immune cells in the human body. Proc. Natl. Acad. Sci. U.S.A. 120, e2308511120 (2023). - PMC - PubMed
    1. Jenkins M. K., Chu H. H., McLachlan J. B., Moon J. J., On the composition of the preimmune repertoire of T cells specific for peptide–major histocompatibility complex ligands. Annu. Rev. Immunol. 28, 275–294 (2010). - PubMed

MeSH terms