. 2025 Jun 13;11(24):eadt8697.
doi: 10.1126/sciadv.adt8697. Epub 2025 Jun 11.

Caspase-1-dependent pyroptosis converts αSMA+ CAFs into collagen-IIIhigh iCAFs to fuel chemoresistant cancer stem cells

Affiliations

Caspase-1-dependent pyroptosis converts αSMA+ CAFs into collagen-IIIhigh iCAFs to fuel chemoresistant cancer stem cells

Hongbo Gao et al. Sci Adv. .

Abstract

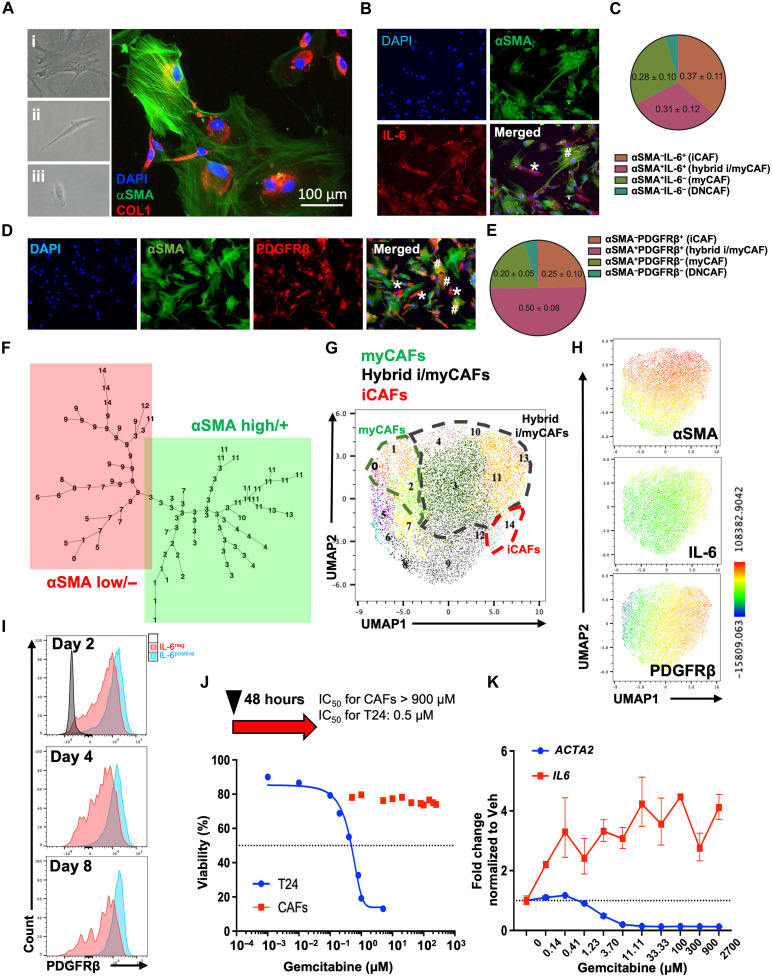
The impact of chemotherapy-induced tumor cell pyroptosis on fibroblasts, a key stromal cell type within the tumor microenvironment (TME), remains unexplored. Here, we report morphologically and molecularly distinct subtypes of cancer-associated fibroblasts (CAFs) in bladder cancer, including αSMA+IL-6- myofibroblastic CAFs (myCAFs), αSMA-IL-6+ inflammatory CAFs (iCAFs), and hybrid i/myCAFs. Caspase-1-dependent tumor pyroptosis releases several inflammatory chemokines, converting αSMA+ CAF into iCAFs in a CCR6-dependent manner. This is clinically relevant, as a fibroblast gene signature driven by iCAF markers and collagen type III is enriched in patients with chemoresistant bladder cancer after neoadjuvant chemotherapy. Contrary to the current notion, iCAFs, rather than myCAFs, produce collagen III in response to chemotherapy, supporting the expansion of cancer stem cells (CSCs). Thus, tumor cell pyroptosis initiates an iCAF-CSC feedforward loop that drives chemoresistance, indicating that inflammatory cell death is not universally beneficial to anticancer therapy, depending on the target cell type.


Figures

Fig. 1.
Fig. 1.. Patients with chemoresistant bladder cancer exhibit an inflammatory fibroblast signature.
(A) GSEA revealing a fibroblast gene signature enrichment in patients with chemoresistant bladder cancer (NES = 2.11, P < 0.0001). (B and C) Heatmaps display relative expression of COL1A1, COL1A2, and *COL3A1 (B) and key fibroblast markers, e.g., ACTA2, FAP, THY1, PDGFRA, *PDGFRB, and *IL6 (C) within the fibroblast signature, * denotes statistical significance. (D) mxIHC reveals CAF heterogeneity, showing differential PDGFRβ, αSMA, Col3, and IL-6 expression in tumor tissue sections from patients with MIBC. (E) Region 1 highlights hybrid i/myCAFs (*) coexpressing αSMA (a myofibroblastic myCAF marker), PDGFRβ, and IL-6 (an inflammatory iCAF marker), with few iCAFs (^) lacking αSMA but expressing PDGFRβ/IL-6. Both hybrid i/myCAFs and iCAFs colocalize Col3. (F) Region 2 shows a prevalence of iCAFs (^) with low/no expression of αSMA and high expression of PDGFRβ, IL-6, and Col3. (G) t-Distributed stochastic neighbor embedding (tSNE) plot illustrating various CAF subclusters from human bladder cancer clinical cohorts, designated as myCAFs, hybrid i/myCAFs, iCAFs, and double-negative CAFs (DNCAFs). (H) Dot plot compares ACTA2 and IL6 expression among myCAFs, hybrid i/myCAFs, iCAFs, and DNCAFs. (I) Dot plot illustrating the normalized expression of fibroblast marker genes among CAF subclusters. Color scheme represents z score distribution from −1 (red) to 1 (blue). (J) EPIC deconvolution analysis of chemoresistant bulk RNA-seq data to assess CAF subpopulations’ alterations upon NAC. ns, not significant; **P < 0.01.
Fig. 2.
Fig. 2.. Phenotypically distinct myCAFs, iCAFs, and hybrid i/myCAFs coexist ex vivo.
(A) Bright-field images showing morphologically distinct fibroblasts within human bladder cancer patient–derived CAFs, these include (i) large stellate-shaped CAFs with stress fibers, (ii) spindle-shaped CAFs, and (iii) small, round-shaped CAFs. IF costain illustrating the myofibroblastic marker αSMA (green) and collagen I (red) expression across CAF subtypes. (B) IF costain showing the colocalization of αSMA––a myofibroblastic marker (green), and IL-6––an inflammatory marker (red) in CAFs. (C) A pie chart qualifies CAF subtypes based on αSMA and IL-6 costaining. (D) IF costained αSMA (green) and PDGFRβ (red) in CAFs. (E) A pie chart quantifies CAF subtypes marked by αSMA and PDGFRβ. (F) Cytek multiplex flow cytometry analysis of CAFs using a panel of fibroblast markers, visualized using Minimum Spanning Tree into 14 CAF subpopulations that are assigned into multidimensional nodes based on their similarities. Briefly, these CAFs are subdivided into two major sub-branches: αSMAhigh/+ (green) and αSMAlow/− (red). (G) UMAP plot generated using FlowSOM to visualize the heterogeneity of CAFs, including myCAFs, iCAFs, and hybrid i/myCAFs. (H) UMAP illustrating αSMA, IL-6, and PDGFRβ expression in CAFs. (I) Flow cytometry analysis evaluating the expression dynamics of PDGFRβ in IL-6+ (blue) and IL-6 (red) CAFs over an 8-day monolayer culture, confirming that IL-6+ CAFs are also PDGFRβ+. (J) Treatment of T24 bladder cancer cells (blue line) and CAFs (red line) with dose escalation of gemcitabine chemotherapy for 48 hours in vitro. (K) Quantitative polymerase chain reaction (qPCR) analysis quantifying ACTA2 (gene name for αSMA, blue line) and IL6 (red line) expression in CAFs treated with increasing dosage of gemcitabine.
Fig. 3.
Fig. 3.. Chemotherapy-induced tumor pyroptosis converts αSMAhigh/+ CAFs into iCAFs.
(A) Schematic of CM from chemotherapy-treated cancer cells for subsequent treatment on CAFs in vitro. (B) Flow cytometry evaluating CM effects on αSMAhigh/+ CAFs and αSMAPDGFRβ+ iCAF conversion, in response to (i) base medium (2% FBS DMEM), (ii) CM from untreated T24 (CM-Veh), and (iii) CM from gemcitabine-treated T24 (CM-Gem). (C and D) Bar graphs quantifying αSMAhigh/+ CAFs (C) and αSMAPDGFβ+ iCAFs (D) upon treatment with CM-Veh and CM-Gem. (E) Flow cytometry histogram illustrating higher IL-6 expression in αSMAPDGFRβ+ iCAFs (blue) and αSMA+PDGFRβ+ hybrid i/my CAFs (red) than other CAFs (green and yellow). (F to H) Western blot analysis of Casp1-dependent pyroptosis and apoptosis in gemcitabine-treated T24 cells by immunoblotting (IB): (F) Casp1 full-length (FL) protein, (G) Casp1 p20 and p10 cleavage (Cl) products indicating enzymatic activity, and (H) Caspase-3 (Casp3) FL, Cl-Casp3, and DNA repair protein poly(ADP-ribose) polymerase 1 (PARP1) FL and Cl PARP1 (Cl-PARP1), as apoptosis markers. (I) Flow cytometry of DAPI and annexin V costaining in WT and Casp1 knockout (Casp1 KO) T24 cells upon gemcitabine treatment. (J) Bar graph quantifying fractions in (I), showing reduced lytic cell death (DAPI+/annexin V; red) in Casp1 KO cells (*P = 0.0265). (K) Flow cytometry analyzing CM from gemcitabine-treated WT or Casp1 knockout (Casp1 KO) T24 cells in the conversion between αSMAhigh/+ CAFs and αSMAPDGFβ+ iCAFs. (L) Corresponding IF costaining illustrating PDGFRβ (red) and αSMA (green) in CAFs exposed to CM-Gem from T24 WT and Casp1 KO cells. (M) Bar graph quantifying PDGFRβ+ iCAFs, showing significant reduction after exposure to CM-Gem from Casp1 KO versus WT cells.
Fig. 4.
Fig. 4.. Tumor cell pyroptosis skews CAFs toward iCAFs in a CCR6-dependent mechanism.
(A) Representative image illustrating a cytokine protein array (i.e., Proteome Profiler Human XL Cytokine Array Kit, R&D Systems) probed with the supernatant collected from WT and Casp1 KO T24 cancer cells after 48 hours of gemcitabine treatment. Red, blue, and green boxes highlighting the individual cytokines or chemokines with the most differential expression (i.e., reduction) in Casp1 KO versus WT Gem-treated supernatant. (B) Bar graph quantifying the intensity of three cytokines differentially released in WT and Casp1 KO supernatant, i.e., CXCL5, CXCL10, and CCL20. (C) ELISA quantification of CXCL5, CXCL10, and CCL20 protein concentration in the supernatants collected from gemcitabine-treated WT and Casp1 KO T24 bladder cancer cells. (D) Flow cytometry assessing the percentage of αSMAhigh/+ CAFs and αSMAPDGFβ+ iCAFs treated with CM from Gem-treated T24 cells with anti-CXCR2 neutralizing Ab, (anti-CXCR2 Ab, blocking receptor downstream to CXCL5), anti-CXCL10 neutralizing Ab, anti-CCL20 neutralizing ab, and CCR6i (blocking receptor downstream to CCL20). (E) Violin dot plot quantifying the relative changes in the percentage of αSMAPDGFβ+ iCAFs upon CM-Gem ± chemokine or chemokine receptor neutralizing Ab treatments.
Fig. 5.
Fig. 5.. Gemcitabine-induced emergence of PDGFRβ+ iCAFs reactively express Col3.
(A) Multicolor flow cytometry analyzing CAF subtypes denoted by the relative coexpression of IL-6 and αSMA (left), as well as PDGFRβ (right) in CAFs cocultured with T24 cancer cells. Flow cytometry confirms the existence of (i) αSMAlow/−IL-6+ iCAFs (red box), (ii) αSMA+IL-6+ hybrid i/my CAFs (blue box), (iii) pure αSMA+IL-6 myCAFs (yellow box), and (iv) αSMAIL-6 CAFs (green box). Right illustrates that PDGFRβ protein expression is highly expressed in IL-6+ CAFs (i.e., iCAFs and hybrid i/myCAFs) when compared with other CAF subtypes. (B) Corresponding IF costaining highlighting the smaller-shaped αSMAlow/−PDGFRβ+ iCAFs (green) and stretched stellate-shaped αSMA+ CAFs in coculture with T24 bladder cancer cells. (C) Flow cytometry evaluating the relative IL-6 and αSMA protein expression in PDGFRβFAP CAFs, PDGFRβFAP+ myCAFs, PDGFRβ+FAP+ hybrid i/myCAFs, and PDGFRβ+FAP iCAFs, illustrating that FAP is positively associated with αSMA expression, thus enabling fluorescence-activated cell sorting (FACS) in (D). (D) qPCR analysis comparing the relative IL6 and COL3A1 mRNA expression in FACS-purified CAF subsets upon gemcitabine treatment. In particular, PDGFRβ+FAP iCAFs and PDGFRβ+FAP+ hybrid i/myCAFs reactively up-regulate IL6 and COL3A1 mRNA expression upon chemotherapy treatment. (E and F) mxIHC costaining displaying the relative distribution of Col3 associated with PDGFRβ+ iCAFs and αSMA+ CAFs in vehicle-treated xenografts (Veh, E) and two cycles of gemcitabine-cisplatin (GC) chemotherapy (F). (G) Bar graph illustrates an expansion of stromal fibroblasts after chemotherapy, which composes of αSMAlow/−PDGFRβ+ iCAFs and αSMA+PDGFRβ+ hybrid i/myCAFs (yellow) predominately associating with Col3 deposition. (H) Bar graphs quantifying the changes in CAF subclusters within bladder cancer xenografts after 2 cycles of GC chemotherapy treatment compared with Veh-treated control. The increase in αSMAlow/−PDGFRβ+ iCAFs upon chemotherapy treatment is most notable.
Fig. 6.
Fig. 6.. Pharmaceutical inhibition of Caspase 1 improves chemotherapy response.
(A and B) mxIHC staining demonstrating iCAFs (αSMAPDGFRβ+ CAFs) and CSCs (CD44+) in chemoresistant bladder cancer and association of Col3 with CD44+ CSCs. (C) Bar graphs showing a significant elevation of digitally deconvoluted iCAFs and hybrid i/myCAFs in chemoresistant cohorts (GSE87304 and GSE124305) (****P < 0.0001; **P < 0.01; *P < 0.05). (D) Kaplan-Meier analysis indicating worse survival in patients with high iCAFs or hybrid i/myCAFs (red) versus low expression (blue). (E) Scatterplot illustrating a positive correlation of COL3A1 with CD44 in patients with chemoresistant bladder cancer (P = 1.22 × 10⁻³). (F) mxIHC staining characterizing colocalization of PDGFRβ (green), αSMA (red), Col3 (white), and CD44 (yellow) in bladder cancer xenografts, illustrating CD44high bladder cancer cells near Col3-rich stroma (region 1), and CD44medium or CD44low bladder cancer cells farther from Col3 area (region 2). (G) Bar graph quantifying the distribution of CD44high/med/low bladder cancer cells and their proximity to stromal Col3 staining, illustrating that CD44high and CD44med cancer cells are in a significantly higher percentage that is closely proximal to Col3-rich stromal areas. ROI, region of interest. (H and I) Flow cytometry assessing the effects of exogenous Col3 or collagen I (Col1) with gemcitabine on CD44+CD49f+ CSCs and CD44CD49f differentiated cancer subpopulations. (J and K) Tumor size (J) and weight (K) of WT T24 xenografts upon GC chemotherapy in the presence or absence of Casp1 inhibitor VX-765, showing that VX-765 significantly improves chemosensitivity. (L and M) mxIHC staining and quantification of Col3 and CD44 in GC versus VX-765 + GC xenografts. * denoted that the cells were CD44 cancer cells in VX-765 + GC xenografts. VX-765 with GC reduces Col3 regions and CD44high cancer cells.
Fig. 7.
Fig. 7.. Schematic summarizing the overall conceptual advance.
Casp1-dependent tumor cell pyroptosis converts αSMAhigh/+ myCAFs and αSMAhigh/+PDGFRβ+ hybrid i/my CAFs into αSMAlow/−PDGFRβ+collagen-IIIhigh iCAFs, which facilitates a feedforward loop fueling CSC expansion in patients with chemoresistant bladder cancer.

References

    1. Lamkanfi M., Dixit V. M., Mechanisms and functions of inflammasomes. Cell 157, 1013–1022 (2014). - PubMed
    1. Hou J., Hsu J. M., Hung M. C., Molecular mechanisms and functions of pyroptosis in inflammation and antitumor immunity. Mol. Cell 81, 4579–4590 (2021). - PMC - PubMed
    1. Shi J., Zhao Y., Wang K., Shi X., Wang Y., Huang H., Zhuang Y., Cai T., Wang F., Shao F., Cleavage of GSDMD by inflammatory caspases determines pyroptotic cell death. Nature 526, 660–665 (2015). - PubMed
    1. Galluzzi L., Vitale I., Aaronson S. A., Abrams J. M., Adam D., Agostinis P., Alnemri E. S., Altucci L., Amelio I., Andrews D. W., Annicchiarico-Petruzzelli M., Antonov A. V., Arama E., Baehrecke E. H., Barlev N. A., Bazan N. G., Bernassola F., Bertrand M. J. M., Bianchi K., Blagosklonny M. V., Blomgren K., Borner C., Boya P., Brenner C., Campanella M., Candi E., Carmona-Gutierrez D., Cecconi F., Chan F. K.-M., Chandel N. S., Cheng E. H., Chipuk J. E., Cidlowski J. A., Ciechanover A., Cohen G. M., Conrad M., Cubillos-Ruiz J. R., Czabotar P. E., D’Angiolella V., Dawson T. M., Dawson V. L., De Laurenzi V., De Maria R., Debatin K.-M., De Berardinis R. J., Deshmukh M., Daniele N. D., Virgilio F. D., Dixit V. M., Dixon S. J., Duckett C. S., Dynlacht B. D., El-Deiry W. S., Elrod J. W., Fimia G. M., Fulda S., García-Sáez A. J., Garg A. D., Garrido C., Gavathiotis E., Golstein P., Gottlieb E., Green D. R., Greene L. A., Gronemeyer H., Gross A., Hajnoczky G., Hardwick J. M., Harris I. S., Hengartner M. O., Hetz C., Ichijo H., Jäättelä M., Joseph B., Jost P. J., Juin P. P., Kaiser W. J., Karin M., Kaufmann T., Kepp O., Kimchi A., Kitsis R. N., Klionsky D. J., Knight R. A., Kumar S., Lee S. W., Lemasters J. J., Levine B., Linkermann A., Lipton S. A., Lockshin R. A., López-Otín C., Lowe S. W., Luedde T., Lugli E., Farlane M. M., Madeo F., Malewicz M., Malorni W., Manic G., Marine J.-C., Martin S. J., Martinou J.-C., Medema J. P., Mehlen P., Meier P., Melino S., Miao E. A., Molkentin J. D., Moll U. M., Muñoz-Pinedo C., Nagata S., Nuñez G., Oberst A., Oren M., Overholtzer M., Pagano M., Panaretakis T., Pasparakis M., Penninger J. M., Pereira D. M., Pervaiz S., Peter M. E., Piacentini M., Pinton P., Prehn J. H. M., Puthalakath H., Rabinovich G. A., Rehm M., Rizzuto R., Rodrigues C. M. P., Rubinsztein D. C., Rudel T., Ryan K. M., Sayan E., Scorrano L., Shao F., Shi Y., Silke J., Simon H.-U., Sistigu A., Stockwell B. R., Strasser A., Szabadkai G., Tait S. W. G., Tang D., Tavernarakis N., Thorburn A., Tsujimoto Y., Turk B., Berghe T. V., Vandenabeele P., Vander Heiden M. G., Villunger A., Virgin H. W., Vousden K. H., Vucic D., Wagner E. F., Walczak H., Wallach D., Wang Y., Wells J. A., Wood W., Yuan J., Zakeri Z., Zhivotovsky B., Zitvogel L., Melino G., Kroemer G., Molecular mechanisms of cell death: Recommendations of the Nomenclature Committee on Cell Death 2018. Cell Death Differ. 25, 486–541 (2018). - PMC - PubMed
    1. Newton K., Strasser A., Kayagaki N., Dixit V. M., Cell death. Cell 187, 235–256 (2024). - PubMed

MeSH terms