. 2025 Jun 13;11(24):eadu3730.
doi: 10.1126/sciadv.adu3730. Epub 2025 Jun 11.

A lipid atlas of the human kidney

Affiliations

A lipid atlas of the human kidney

Melissa A Farrow et al. Sci Adv. .

Abstract

Tissue atlases provide foundational knowledge on the cellular organization and molecular distributions across molecular classes and spatial scales. Here, we construct a comprehensive spatiomolecular lipid atlas of the human kidney from 29 donor tissues using integrated multimodal molecular imaging. Our approach leverages high-spatial-resolution matrix-assisted laser desorption/ionization imaging mass spectrometry for untargeted lipid mapping, stained microscopy for histopathological assessment, and tissue segmentation using autofluorescence microscopy. With a combination of unsupervised, supervised, and interpretable machine learning, the atlas provides multivariate lipid profiles of specific multicellular functional tissue units (FTUs) of the nephron, including the glomerulus, proximal tubules, thick ascending limb, distal tubules, and collecting ducts. In total, the atlas consists of tens of thousands of FTUs and millions of mass spectrometry measurements. Detailed patient, clinical, and histopathologic information allowed molecular data to be mined on the basis of these features. As examples, we highlight the discovery of how lipid profiles are altered with sex and differences in body mass index.


Figures
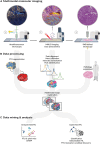
Fig. 1.
Fig. 1.. Construction of the FTU lipid atlas of the human kidney.
Multimodal molecular imaging data were collected from 29 donor kidney tissues. Each tissue section was subjected to AF microscopy, MALDI IMS, and PAS-stained microscopy, in sequential order (A). Each modality is processed individually to provide AF-driven FTU segmentations, to ensure that MALDI IMS measurements are comparable and to remove potential batch effects, and to provide histopathological assessment of each tissue (B). These datasets are then integrated by spatially co-registering them onto the same spatial coordinate system and by performing a combination of unsupervised and cross-modal supervised machine learning (ML) analyses (C). Interpretable machine learning is then used to uncover spatially distinct biomarker candidates for FTUs across the overall data cohort as well as scoped to specific donor metadata such as BMI or sex.
Fig. 2.
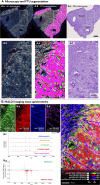
Fig. 2.. Example of multimodal molecular characterization of human kidney tissue.
Whole slide microscopy images from donor VAN0028 (56-year-old white female) were collected using AF (A.a and A.b) before high-spatial-resolution (10-μm pixel size) MALDI IMS measurement, and PAS-stained microscopy (A.c) data were acquired post-IMS. AF microscopy data were automatically segmented into renal FTUs (A.b), including the GLs (green), PTs (magenta), TAL (light green), DTs (brown), and CDs (red). MALDI IMS measurement regions (white boxes) were selected to include a mixture of tissue features. The microscopy data for the MALDI IMS measurement region are highlighted in (A.d) to (A.f). Selected individual molecular distribution images from the negative ion mode MALDI IMS measurement and an overlay image are provided in (B.a) to (B.d) and (B.e), respectively. The selected ions demonstrate unique localizations within the kidney without the need for prior labeling, and these are just four of the hundreds of lipids that make up this molecular atlas. The mean mass spectrum associated with each FTU, obtained by averaging FTU-specific IMS-pixels across all donors, displays subtle differences in the lipids detected and their intensities (B.f). It is noted that full size versions of the spectra can be found in the Supplementary Materials. Variations in intensity profiles of FTUs are more evident using difference spectra, as shown in the comparison between the normalized (between 0 and 1 to allow for direct comparison) average spectrum of PTs subtracted from that of the GLs (B.g).
Fig. 3.
Fig. 3.. Global characteristics of the atlas.
Key donor characteristics such as age and BMI (A) and detailed histopathology (B) are available for 29 donors. Selected measures of tissue normalcy are highlighted in the bar plot, including % global glomerular sclerosis, % interstitial fibrosis tubular atrophy, and % interstitial inflammation. AF microscopy was used to comprehensively segment renal FTUs such as the GL (C.a), PT (C.b), DT (C.c), TAL (C.d), and CD (C.e). The total number of detected instances for each FTU was quantified within the cortex (Co), outer medulla (OM), and inner medulla (IM) of the kidney across all AF whole slide images (dark gray) and specific to the MALDI IMS measurement regions in both negative (light gray) and positive ion (medium gray) modes. The example immunofluorescence data show how markers used to train the AF-based segmentation algorithms were also able to differentiate the broader anatomical zones of the kidney. The integrated MALDI IMS data underwent data preprocessing to address nonbiological variability, including peak alignment, calibration, and intensity normalization. Boxen plots show the variability of the TIC (log10 intensity) for the negative ion mode data following intrasample normalization (D.a) and the consistency after intersample normalization (D.b). (D.c) Mass error in parts per million for selected negative ion mode lipids. The black line represents the mean mass error from all pixels collected from all samples, and the gray dots represent the spread of the data for each m/z. Following preprocessing, m/z features are annotated using mass accuracy to compare to LC-MS/MS–based identifications and on-tissue fragmentation. The provided pie chart summarizes the number of annotations for various lipid classes from the negative ion mode data (D.d). It is noted that 28 of the 29 samples were analyzed in negative ion mode.
Fig. 4.
Fig. 4.. Pixel-level chemical variation of MALDI IMS measurements across 28 of the donors analyzed by negative ion mode.
Two-dimensional visualization of chemical variation in the negative ionization mode experiment cohort using UMAP to cast a matrix of 6,568,017 observations (i.e., IMS pixels across 28 donor tissues) by 212 features (i.e., lipid species) into a table of 6,568,017 observations by two latent variables while retaining neighborhood relationships between observations as captured by a cosine distance measure. (A) Latent space representation of chemical variation after preprocessing, with pixels color coded for donor origin. (C) Same latent space representation as in (A), with pixels color coded for FTU type (as automatically recognized from microscopy). (B) Latent space representation of chemical variation after preprocessing and reduction of donor variation by reComBat, with pixels color coded for donor origin. (D) Same latent space representation as in (B), with pixels color coded for FTU type (as automatically recognized from microscopy). Note that while reComBat has not been optimized for use on MS data, it is applied here to demonstrate that if sample-specific variation can be removed, FTU-related variation becomes more readily discernable in an unsupervised context.
Fig. 5.
Fig. 5.. Pixel-level and FTU instance–level chemical variation in positive ionization mode of IMS measurements across 28 donors.
Note that, for consistency, only the 28 samples that had been analyzed by negative ion mode as well were included in this visualization. (A and C) Two-dimensional visualizations of chemical variation in the positive ionization mode experiment cohort using UMAP to cast a matrix of 6,779,166 observations (i.e., IMS pixels across 28 donor tissues) by 211 features (i.e., lipid species) into a table of 6,779,166 observations by two latent variables while retaining neighborhood relationships between observations as captured by a cosine distance measure. (FTU instance–level column) Two-dimensional visualizations of chemical variation in the positive ionization mode experiment cohort using UMAP to cast a matrix of 75,846 FTU instances (i.e., mean spectrum per FTU instance found across 28 donor tissues) by 211 features (i.e., lipid species) into a table of 74,959 observations by two latent variables while retaining neighborhood relationships between observations as captured by a cosine distance measure. (A) Pixel-level latent space representation of chemical variation after preprocessing and reduction of donor variation by reComBat, with pixels color coded for donor origin. (C) Same pixel-level latent space representation as in (A), with pixels color coded for FTU type (as automatically recognized from microscopy). (B) FTU instance–level latent space representation of chemical variation after preprocessing and reduction of donor variation by reComBat, with pixels color coded for donor origin. (D) Same FTU instance–level latent space representation as in (B), with pixels color coded for FTU type (as automatically recognized from microscopy). Note that while reComBat has not been optimized for use on MS data, it is applied here to demonstrate that if sample-specific variation can be reduced, FTU-related variation becomes more readily discernable in an unsupervised context.
Fig. 6.
Fig. 6.. Summary of biomarker candidates for five FTUs, namely GLs, PTs, DTs, CDs, and the TAL, obtained by applying our SHAP-based workflow to the atlas.
The bubble plot reports both positive ion mode (A) (left) and negative ion mode (B) (right) findings. The columns correspond to a selection of molecular species (in increasing order of m/z ratios) that are biomarker candidates for one (or multiple) of the five FTUs under study. The rows correspond to different donors, each row labeled with its donor ID number and followed by the donor’s age, sex, and BMI. Each bubble marker is informative of the direction (positive or negative correlation) and magnitude (relatively large or small) of a molecular species’ influence on the classification model designed to recognize one of the five FTUs. The marker size represents the magnitude of the molecular species’ influence, as measured by its tissue sample-wide SHAP importance score for a given donor sample. The marker color indicates the direction of the molecular species’ influence, as measured by Spearman’s rank correlation coefficient between the molecular species’ mean-centered ion intensity values and its local pixel-specific SHAP scores. A positive Spearman’s rank correlation coefficient indicates that a high intensity of the molecular species correlates with the FTU. Conversely, a negative Spearman’s rank correlation coefficient indicates that a low intensity of the molecular species correlates with the FTU.
Fig. 7.
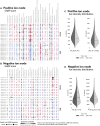
Fig. 7.. Summary of biomarker candidates for sex, obtained by applying our SHAP-based workflow to the atlas.
The bubble plots report positive ion mode (A) and negative ion mode (B) findings. The columns correspond to a selection of molecular species (in increasing order of m/z ratios) that are biomarker candidates for the female sex. The rows correspond to the different donors. Each bubble marker is informative of the direction and magnitude of a molecular species’ influence on the classification model designed to recognize female donor tissue from male donor tissue. A molecular species with a large marker acts as a differentiator between sexes. The marker color indicates the direction of the molecular species’ influence, as measured by the Spearman’s rank correlation coefficient between the molecular species’ mean-centered ion intensity values and its local pixel-specific SHAP scores. Molecular species that are positively correlated with female sex are negatively correlated with male sex, and vice versa. A positive Spearman’s rank correlation coefficient indicates that a high intensity of the molecular species correlates with either the female sex (A/B top) or the male sex (A/B bottom). Conversely, a negative Spearman’s rank correlation coefficient indicates that a low intensity of the molecular species correlates with the female sex (A/B top) or the male sex (A/B bottom). The split violin plots on the right report the ion intensity distributions of select sex biomarker candidates in positive mode (C) and negative mode (D), approximated using kernel density estimation. The violin plots are cropped at the 99th percentile of the distribution of one of the two sexes (whichever is larger) to facilitate visual comparison. The full line of each violin plot indicates the median of each class’ distribution, whereas the dashed lines indicate its interquartile range.
Fig. 8.
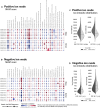
Fig. 8.. Summary of biomarker candidates for BMI, obtained by applying our SHAP-based workflow to the atlas.
The bubble plots report positive ion mode (A) and negative ion mode (B) findings. The columns correspond to a selection of molecular species (in increasing order of m/z ratios) that are biomarker candidates for the characteristic of obesity. The rows correspond to the different donors. Each bubble marker is informative of the direction and magnitude of a molecular species’ influence on the classification model designed to recognize high-BMI donor tissue from normal-BMI donor tissue. A molecular species with a large marker acts as a differentiator between BMI classes. The marker color indicates the direction of the molecular species’ influence, as measured by the Spearman’s rank correlation coefficient between the molecular species’ mean-centered ion intensity values and its local pixel-specific SHAP scores. Molecular species that are positively correlated with high BMI are negatively correlated with normal BMI, and vice versa. A positive Spearman’s rank correlation coefficient indicates that a high intensity of the molecular species correlates with either high BMI (A/B top) or normal BMI (A/B bottom). Conversely, a negative Spearman’s rank correlation coefficient indicates that a low intensity of the molecular species correlates with either high BMI (A/B bottom) or normal BMI (A/B bottom). The split violin plots on the right report the ion intensity distributions of select obesity biomarker candidates in positive mode (C) and negative mode (D), approximated using kernel density estimation. The violin plots are cropped at the 99th percentile of the distribution of one of the BMI categories (whichever is larger) to facilitate visual comparison. The full line of each violin plot indicates the median of each class’ distribution, whereas the dashed lines indicate its interquartile range.

References

    1. Conde C. D., Xu C., Jarvis L. B., Rainbow D. B., Wells S. B., Gomes T., Howlett S. K., Suchanek O., Polanski K., King H. W., Mamanova L., Huang N., Szabo P. A., Richardson L., Bolt L., Fasouli E. S., Mahbubani K. T., Prete M., Tuck L., Richoz N., Tuong Z. K., Campos L., Mousa H. S., Needham E. J., Pritchard S., Li T., Elmentaite R., Park J., Rahmani E., Chen D., Menon D. K., Bayraktar O. A., James L. K., Meyer K. B., Yosef N., Clatworthy M. R., Sims P. A., Farber D. L., Saeb-Parsy K., Jones J. L., Teichmann S. A., Cross-tissue immune cell analysis reveals tissue-specific features in humans. Science 376, eabl5197 (2022). - PMC - PubMed
    1. The Tabula Sapiens Consortium, Jones R. C., Karkanias J., Krasnow M. A., Pisco A. O., Quake S. R., Salzman J., Yosef N., Bulthaup B., Brown P., Harper W., Hemenez M., Ponnusamy R., Salehi A., Sanagavarapu B. A., Spallino E., Aaron K. A., Concepcion W., Gardner J. M., Kelly B., Neidlinger N., Wang Z., Crasta S., Kolluru S., Morri M., Tan S. Y., Travaglini K. J., Xu C., Alcántara-Hernández M., Almanzar N., Antony J., Beyersdorf B., Burhan D., Calcuttawala K., Carter M. M., Chan C. K. F., Chang C. A., Chang S., Colville A., Culver R. N., Cvijović I., D’Amato G., Ezran C., Galdos F. X., Gillich A., Goodyer W. R., Hang Y., Hayashi A., Houshdaran S., Huang X., Irwin J. C., Jang S., Juanico J. V., Kershner A. M., Kim S., Kiss B., Kong W., Kumar M. E., Kuo A. H., Leylek R., Li B., Loeb G. B., Lu W.-J., Mantri S., Markovic M., McAlpine P. L., de Morree A., Mrouj K., Mukherjee S., Muser T., Neuhöfer P., Nguyen T. D., Perez K., Phansalkar R., Puluca N., Qi Z., Rao P., Raquer-McKay H., Schaum N., Scott B., Seddighzadeh B., Segal J., Sen S., Sikandar S., Spencer S. P., Steffes L. C., Subramaniam V. R., Swarup A., Swift M., Van Treuren W., Trimm E., Veizades S., Vijayakumar S., Vo K. C., Vorperian S. K., Wang W., Weinstein H. N. W., Winkler J., Wu T. T. H., Xie J., Yung A. R., Zhang Y., Detweiler A. M., Mekonen H., Neff N. F., Sit R. V., Tan M., Yan J., Bean G. R., Charu V., Forgó E., Martin B. A., Ozawa M. G., Silva O., Toland A., Vemuri V. N. P., Afik S., Awayan K., Botvinnik O. B., Byrne A., Chen M., Dehghannasiri R., Gayoso A., Granados A. A., Li Q., Mahmoudabadi G., McGeever A., Olivieri J. E., Park M., Ravikumar N., Stanley G., Tan W., Tarashansky A. J., Vanheusden R., Wang P., S. Wang, Xing G., Dethlefsen L., Ho P.-Y., Liu S., Maltzman J. S., Metzger R. J., Sasagawa K., Sinha R., Song H., Wang B., Artandi S. E., Beachy P. A., Clarke M. F., Giudice L. C., Huang F. W., Huang K. C., Idoyaga J., Kim S. K., Kuo C. S., Nguyen P., Rando T. A., Red-Horse K., Reiter J., Relman D. A., Sonnenburg J. L., Wu A., Wu S. M., Wyss-Coray T., The Tabula Sapiens: A multiple-organ, single-cell transcriptomic atlas of humans. Science 376, eabl4896 (2022). - PMC - PubMed
    1. Eraslan G., Drokhlyansky E., Anand S., Fiskin E., Subramanian A., Slyper M., Wang J., Van Wittenberghe N., Rouhana J. M., Waldman J., Ashenberg O., Lek M., Dionne D., Win T. S., Cuoco M. S., Kuksenko O., Tsankov A. M., Branton P. A., Marshall J. L., Greka A., Getz G., Segrè A. V., Aguet F., Rozenblatt-Rosen O., Ardlie K. G., Regev A., Single-nucleus cross-tissue molecular reference maps toward understanding disease gene function. Science 376, eabl4290 (2022). - PMC - PubMed
    1. Hansen J., Sealfon R., Menon R., Eadon M. T., Lake B. B., Steck B., Anjani K., Parikh S., Sigdel T. K., Zhang G., Velickovic D., Barwinska D., Alexandrov T., Dobi D., Rashmi P., Otto E. A., Rivera M., Rose M. P., Anderton C. R., Shapiro J. P., Pamreddy A., Winfree S., Xiong Y., He Y., de Boer I. H., Hodgin J. B., Barisoni L., Naik A. S., Sharma K., Sarwal M. M., Zhang K., Himmelfarb J., Rovin B., El-Achkar T. M., Laszik Z., He J. C., Dagher P. C., Valerius M. T., Jain S., Satlin L. M., Troyanskaya O. G., Kretzler M., Iyengar R., Azeloglu E. U., Kidney Precision Medicine Project , A reference tissue atlas for the human kidney. Sci. Adv. 8, eabn4965 (2022). - PMC - PubMed
    1. Lake B. B., Menon R., Winfree S., Hu Q., Ferreira R. M., Kalhor K., Barwinska D., Otto E. A., Ferkowicz M., Diep D., Plongthongkum N., Knoten A., Urata S., Mariani L. H., Naik A. S., Eddy S., Zhang B., Wu Y., Salamon D., Williams J. C., Wang X., Balderrama K. S., Hoover P. J., Murray E., Marshall J. L., Noel T., Vijayan A., Hartman A., Chen F., Waikar S. S., Rosas S. E., Wilson F. P., Palevsky P. M., Kiryluk K., Sedor J. R., Toto R. D., Parikh C. R., Kim E. H., Satija R., Greka A., Macosko E. Z., Kharchenko P. V., Gaut J. P., Hodgin J. B., KPMP Consortium, Eadon M. T., Dagher P. C., El-Achkar T. M., Zhang K., Kretzler M., Jain S., An atlas of healthy and injured cell states and niches in the human kidney. Nature 619, 585–594 (2023). - PMC - PubMed