. 2025 Sep 4;15(9):1905-1926.
doi: 10.1158/2159-8290.CD-24-1230.

Gut Microbiota Modulation through Akkermansia spp. Supplementation Increases CAR T-cell Potency

Affiliations

Gut Microbiota Modulation through Akkermansia spp. Supplementation Increases CAR T-cell Potency

Laura Marcos-Kovandzic et al. Cancer Discov. .

Abstract

This study investigates the clinical relevance of the gut microbiome at taxonomic and metabolic levels in anti-CD19 chimeric antigen receptor (CAR) T-cell therapy, both in patients and in a preclinical syngeneic tumor model. Patients with B-cell lymphoma treated with CD19 CAR T cells exhibited profound intestinal dysbiosis, exacerbated after CAR T-cell infusion. This dysbiosis was characterized by low bacterial richness, low soluble MAdCAM-1, and loss of Akkermansia species, associated with resistance to therapy. Mechanistically, oral Akkermansia massiliensis supplementation increased CAR T-cell infiltration into the bone marrow, inverted the CD4/CD8 CAR T-cell ratio, favored Tc1 CD8+ T-cell polarization, and promoted the release of tryptophan-derived indole metabolites, leading to better tumor control. The clinical benefit of Akkermansia spp. supplementation was abolished when CAR T cells were genetically deficient in the indole receptor, aryl hydrocarbon receptor (AhR). AhR-agonistic indoles alone failed to replicate the bacterium's anticancer effects. These findings suggest that Akkermansia supplementation could improve CAR T-cell potency in patients with intestinal Akkermansia deficiency.

Significance: B-cell lymphoma patients treated with CAR T cells harbor major gut microbiota perturbations and related metabolism that restrain CAR T-cell therapy. Reprogramming the gut microbiota ecosystem by oral A. massiliensis supplementation induces CAR T-cell niching and Tc1 differentiation in the bone marrow, promoting tumor control in an AhR-dependent manner.


Conflict of interest statement

A. Gottschlich reports grants from Tabby Therapeutics and Nanogami and nonfinancial support from Kite/Gilead outside the submitted work. L. Derosa reports being a consultant and scientific advisory board member for Bristol Myers Squibb and EverImmune. G. Kroemer reports grants from Daiichi Sankyo, Kaleido, Lytix Pharma, PharmaMar, Sanofi, Sutro, Tollys, and Vascage; grants and personal fees from Osasuna Therapeutics and Samsara Therapeutics; personal fees from Centenara Labs and Hevolution; and nonfinancial support from Institut Servier outside the submitted work and that he is on the Board of Directors of the Bristol Myers Squibb Foundation France and is a scientific co-founder of EverImmune, Osasuna Therapeutics, Samsara Therapeutics, and Therafast Bio. S. Kobold reports grants and personal fees from Plectonic and Tcr2; grants from Tabby, Arcus, and Catalym; and personal fees from Cymab, Bristol Myers Squibb, Miltenyi Biomedicines, Novartis, and GSK outside the submitted work. C. Castilla Llorente reports personal fees from Gilead/Kite outside the submitted work. H. Sokol reports other support from Exeliom Biosciences outside the submitted work. L. Zitvogel reports personal fees from EverImmune and grants from PiLeJe during the conduct of the study as well as grants from Daiichi Sankyo, personal fees from German Cancer Aid, and nonfinancial support from INCA outside the submitted work and has a patent for EP 23306837.8 pending to EverImmune. C. Bigenwald reports personal fees from Kite/Gilead and Bristol Myers Squibb during the conduct of the study and grants from Janssen outside the submitted work and has a patent for B23-5209QT pending. No disclosures were reported by the other authors.

Figures
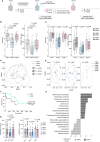
Figure 1.
Figure 1.
Association between gut bacterial composition and response to CAR T-cell therapy. A, Schematic representation of the prospective longitudinal collection of biological samples (fecal material, blood, tumor tissues, and BM aspirations) from patients with B-cell malignancies treated with commercial anti-CD19 CAR T cells. Feces collection occurred at three time points: visit 1 (prior to lymphodepleting chemotherapy), visit 2 (7–15 days after CAR T-cell infusion), and visit 3 (3 months after CAR T-cell infusion). B, α-Diversity analysis using the Shannon index (left) and the species richness index (right) across visits 1, 2, and 3. Data are presented as means ± SEM, with statistical significance evaluated using Wilcoxon signed-rank tests. C, Comparison of bacterial alpha diversity between ORR+ and ORR at visits 1, 2, and 3, calculated using the Shannon index (left) and the species richness index (right). Results are shown as means ± SEM, with statistical analysis by Wilcoxon signed-rank tests. D, β-Diversity analysis using the Bray–Curtis metric to measure microbial community distances, with PERMANOVA tests performed at visits 1, 2, and 3. E, Comparison of bacterial β-diversity between ORR+ and ORR at visits 1, 2, and 3 using PERMANOVA tests. F, PFS curves comparing patients classified as SIG2+ or SIG1+ according to the TOPOSCORE. G, Serum levels of sMAdCAM-1 (ng/mL) in patients with B-cell lymphoma across longitudinal analyses (left) and according to 6-month response status (right). Results are shown as means ± SEM, analyzed using Mann–Whitney tests. H, LEfSe graph generated from baseline (visit 1) metagenomic data, highlighting the most discriminant species between ORR+ and ORR based on linear discriminant analysis scores. MDS, multidimensional scaling.
Figure 2.
Figure 2.
Akkermansia spp. supplementation improves CD19/CD28-ζ CAR T-cell efficacy against B-cell lymphoma. A, Schematic representation of the experimental design for the CD19/CD28-ζ CAR T-cell mouse model. B and C, Tumor growth kinetics and animal survival following CAR T-cell infusion with or without oral live biotherapeutics. B, Tumor sizes monitored by caliper, presented as means ± SEM. A representative experiment from three independent trials is shown, with 15 mice per treatment group. Tumor sizes were analyzed using one-way ANOVA, with specific time points compared using Mann–Whitney tests. C, Survival analysis was performed using the Kaplan–Meier estimator and log-rank test. D, Flow cytometry analysis of the blood compartment on day 14 after CAR T-cell injection. Evaluation of CAR T-cell expansion rate (% CD45.1 EGFR+ cells) and percentage of persistent target cells (% CD19+ cells). Data are presented as means ± SEM, with statistical analysis by Mann–Whitney tests. E, Flow cytometry analysis of the tumor compartment on day 24. Representative contour plots and absolute numbers/percentages of viable CAR T cells across treatment groups. F, Phenotype of tumor-infiltrating CAR T cells, including CD4/CD8 ratio and percentage of IFNγ+ CD8+ CAR T cells. Data are shown as means ± SEM, with statistical analysis by Mann–Whitney tests.
Figure 3.
Figure 3.
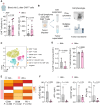
Prevalence of intestinal Akkermansia spp. and lymphoma TME. A, CAR T-cell expansion in the peripheral blood of patients receiving anti-CD19 CAR T cells, stratified by the presence of Akkermansia spp. based on MGS data (n = 6 Akk+; n = 17 Akk). CAR T-cell expansion is represented as a percentage (left) and absolute numbers per mL (right). Data are shown as means ± SEM, with statistical significance determined by Mann–Whitney tests. B, Schematic representation of the experimental workflow. Tumor biopsies obtained shortly after CAR T-cell infusion were analyzed by spectral flow cytometry in patients with available MGS data (n = 3 Akk+; n = 3 Akk). Tumor supernatants were further analyzed using Meso Scale Discovery (MSD) multiplex assays. C, t-Distributed stochastic neighbor embedding (t-SNE) visualization of unsupervised spectral flow cytometry analysis. D, Comparisons of CAR T cells and T-cell frequencies between Akk+ and Akk patients. Data are presented as means ± SEM, with statistical comparisons performed using Mann–Whitney tests. E, Heatmap representation of expression levels [mean fluorescence intensity (MFI)] of CD39, CD38, and PD-1 within the T-cell population. F, Tumor secretome analysis in patients with available metagenomic data (n = 6), focusing on levels of GM-CSF, IFNγ, and LAG-3. Results are shown as means ± SEM, with statistical significance assessed by Mann–Whitney tests.
Figure 4.
Figure 4.
Akkermansia spp. promotes CAR T-cell homing in the BM. A, Flow cytometry analysis of BM on day 7 after treatment, assessing CAR T-cell infiltration across treatment groups. Representative contour plots (left panel) and absolute numbers and percentages of viable CAR T cells (right panel). Data are presented as means ± SEM, with statistical analysis performed using Mann–Whitney tests. B, Quantification of CD4/CD8 CAR T-cell ratio, percentages of effector memory CAR T cells, CD8+ PD-1+ CAR T cells, and CD8+ IFNγ+ CAR T cells. Results are shown as means ± SEM, with statistical significance determined by Mann–Whitney tests. C, Immunofluorescence analysis of BM on day 7 after treatment with quantification of CAR T-cell infiltration (EGFR+ cells/mm2 tissue, top) and quantification of regulatory T cells (CD4+ FoxP3+ cells/mm2 tissue, bottom). Representative images (left) and absolute cell counts (right) are provided. Data are presented as means ± SEM, with statistical comparisons using Mann–Whitney tests. D, Schematic representation of the experimental workflow. BM aspirates collected after CAR T-cell infusion were analyzed by spectral flow cytometry, and BM plasma was assessed by multiplex ELISA from patients with matched MGS data. E, Unsupervised analysis and visualization of cell populations using Uniform Manifold Approximation and Projection for Dimension Reduction (UMAP; n = 9). UMAPs were stratified based on Akkermansia spp. presence in baseline stool samples. F, Quantitative comparison of total T cells and CAR T cells between Akk and Akk+ patients (n = 9). G, Heatmap representation of expression levels [mean fluorescence intensity (MFI)] of LAG-3, PD-1, and ICOS within the CAR T-cell population. H, BM secretome analysis from patients with available metagenomic data (n = 8). Results are presented as means ± SEM, with statistical significance determined by Mann–Whitney tests. BMMC, bone marrow mononuclear cells; DN, double negative.
Figure 5.
Figure 5.
Akkermansia spp. as a proxy for a preserved gut microbiota during CAR T-cell therapy. A, Comparison of bacterial α-diversity between Akk+ and Akk patients at visits 1, 2, and 3, calculated by the Shannon index (left) and the species richness index (right). Wilcoxon signed-rank tests were conducted. B, Bacterial beta diversities at visits 1, 2, and 3 comparing Akk+ and Akk patients, using PERMANOVA tests. C, Serum levels of sMAdCAM-1 (ng/mL) in patients with B-cell lymphoma according to Akkermansia spp. positivity. Results are shown as means ± SEM, using Mann–Whitney tests.
Figure 6.
Figure 6.
Akkermansia spp. systemically releases immunogenic indole metabolites, increasing CAR T-cell efficacy via AhR activation. A, Targeted mass spectrometry-based metabolomic analyses of plasma from patients receiving anti-CD19 CAR T cells at three visits (n = 43 for visit 1; n = 38 for visit 2; n = 29 for visit 3). Heatmaps represent the log2 fold change of normalized metabolite values. B, Correlation between plasma levels of IPA and Akkermansia spp. presence in patients with available MGS data, analyzed longitudinally. Results are shown as means of log2 fold change values ±SEM, with Wilcoxon signed-rank tests applied. C, Spearman correlation between bacteria with the highest relative abundance in ORR+ or ORR patients and metabolites from the indole pathway. Statistical significance was determined using Benjamini–Hochberg FDR–corrected P values for each microorganism across all indoles. D, Schematic representation of CAR T-cell experimental design comparing wild-type and AhR-deficient CAR T cells with or without Akk. p2261 supplementation. E and F, Tumor growth kinetics (E) and cross-sectional tumor size comparisons between treatment arms at day 13 (F). G, Phenotypic characterization comparison of wild-type and AhR-deficient CAR T cells supplemented with supernatant from anaerobic cultures of Akkermansia spp. at 10% (or control media). H, Tumor growth kinetics of lymphoma following CAR T-cell infusion with or without daily oral gavage administration of IPA(n = 10 mice per group). One-way ANOVA was used for tumor growth curve analyses. Data are presented as mean ± SEM; Mann–Whitney tests were performed for specific comparisons. KO, knockout.

References

    1. Kamdar M, Solomon SR, Arnason J, Johnston PB, Glass B, Bachanova V, et al. Lisocabtagene maraleucel versus standard of care with salvage chemotherapy followed by autologous stem cell transplantation as second-line treatment in patients with relapsed or refractory large B-cell lymphoma (TRANSFORM): results from an interim analysis of an open-label, randomised, phase 3 trial. Lancet 2022;399:2294–308. - PubMed
    1. Abramson JS, Palomba ML, Gordon LI, Lunning M, Wang M, Arnason J, et al. Two-year follow-up of lisocabtagene maraleucel in relapsed or refractory large B-cell lymphoma in TRANSCEND NHL 001. Blood 2024;143:404–16. - PubMed
    1. Bachy E, Le Gouill S, Di Blasi R, Sesques P, Manson G, Cartron G, et al. A real-world comparison of tisagenlecleucel and axicabtagene ciloleucel CAR T cells in relapsed or refractory diffuse large B cell lymphoma. Nat Med 2022;28:2145–54. - PMC - PubMed
    1. Locke FL, Miklos DB, Jacobson CA, Perales MA, Kersten MJ, Oluwole OO, et al. Axicabtagene ciloleucel as second-line therapy for large B-cell lymphoma. N Engl J Med 2021;386:640–54. - PubMed
    1. Smith M, Dai A, Ghilardi G, Amelsberg KV, Devlin SM, Pajarillo R, et al. Gut microbiome correlates of response and toxicity following anti-CD19 CAR T cell therapy. Nat Med 2022;28:713–23. - PMC - PubMed

Substances