. 2025 Aug 1;85(15):2921-2938.
doi: 10.1158/0008-5472.CAN-25-0999.

Epigenetic Heritability of Cell Plasticity Drives Cancer Drug Resistance through a One-to-Many Genotype-to-Phenotype Paradigm

Affiliations

Epigenetic Heritability of Cell Plasticity Drives Cancer Drug Resistance through a One-to-Many Genotype-to-Phenotype Paradigm

Erica A Oliveira et al. Cancer Res. .

Abstract

Cancer drug resistance is multifactorial, driven by heritable (epi)genetic changes but also by phenotypic plasticity. In this study, we dissected the drivers of resistance by perturbing organoids derived from patients with colorectal cancer longitudinally with drugs in sequence. Combined longitudinal lineage tracking, single-cell multiomics analysis, evolutionary modeling, and machine learning revealed that different targeted drugs select for distinct subclones, supporting rationally designed drug sequences. The cellular memory of drug resistance was encoded as a heritable epigenetic configuration from which multiple transcriptional programs could run, supporting a one-to-many (epi)genotype-to-phenotype map that explains how clonal expansions and plasticity manifest together. This epigenetic landscape may ensure drug-resistant subclones can exhibit distinct phenotypes in changing environments while still preserving the cellular memory encoding for their selective advantage. Chemotherapy resistance was instead entirely driven by transient phenotypic plasticity rather than stable clonal selection. Inducing further chromosomal instability before drug application changed clonal evolution but not convergent transcriptional programs. Collectively, these data show how genetic and epigenetic alterations are selected to engender a "permissive epigenome" that enables phenotypic plasticity.

Significance: Drug resistance is driven by genetic-epigenetic memory that enables cancer cells to adopt multiple phenotypic states depending on environmental conditions, supporting integration of evolutionary principles into biomarker discovery and personalized treatment strategies. This article is part of a special series: Driving Cancer Discoveries with Computational Research, Data Science, and Machine Learning/AI.


Conflict of interest statement

L. Patruno reports grants from Cancer Research UK–Associazione Italiana per la Ricerca contro il Cancro during the conduct of the study. A. Bertotti reports grants from Associazione Italiana per la Ricerca contro il Cancro—Italian Association for Cancer Research—during the conduct of the study. T.A. Graham reports other support from Genentech and personal fees from DAiNA Therapeutics outside the submitted work and has patents for GB2305655.9, GB2317139.0, and GB2501439.0 pending. No disclosures were reported by the other authors.

Figures

Figure 1.
Figure 1.
Experimental design of long-term drug resistance evolution in colorectal cancer organoids. A, Workflow of lentiviral barcoding in colorectal cancer (CRC) organoid single cells as an evolutionary tracking tool. MOI, multiplicity of infection; RFP, red fluorescent protein. B, Experimental design of long-term drug resistance evolution in an MSS AKT–mutant organoid. Bulk DNA profiling was performed for genomic characterization and barcode measurement, as well as scRNA-seq and corresponding single-cell barcode extraction of five “solid” time points over 5 months: parental, under drug 1, regrowth after drug 1, under drug 2, and regrowth after drug 2. Additionally, floating DNA was collected every 2 days from the supernatant to profile barcodes as a “liquid biopsy.” C, Cells were exposed to four different sequences of drugs with first- and second-line treatments. D, In a second experiment, both organoid lines (MSS and MSI) were exposed to an ERK inhibitor and oxaliplatin. Before drug pressure, CIN was induced with CENP-E inhibitors alone or in combination with the MPS1 inhibitor to assess CIN effects on drug resistance. AKTi, AKT inhibitor; ERKi, ERK inhibitor; MEKi, MEK inhibitor. Created in BioRender. Sottoriva, A. (2025) https://BioRender.com/7toyszr.
Figure 2.
Figure 2.
Tracking evolutionary dynamics. A, Randomly expressed barcodes allow tracking of cellular evolution matched to single-cell transcriptomics. By collecting the floating barcodes in the supernatant of the culture media, we can also profile the clonal composition of the cells without perturbing them with replating. CRC, colorectal cancer. B, Heritable (genetic or epigenetic) preexisting alterations conferring resistance will show as enrichment of the same barcode in different replicas. Heritable de novo alterations may also occur during treatment rather than being preexisting; in that case, we expect enrichment for different barcodes between replicas. Finally, nonheritable mechanisms, such as plasticity, will produce drug resistance without any enrichment of barcodes. Created in BioRender. Sottoriva, A. (2025) https://BioRender.com/hu90cn3.
Figure 3.
Figure 3.
Evolutionary dynamics of barcoded population. A, Lentiviral barcode proportions following first-line treatment in MSS AKT–mutant organoid. For each replicate and drug condition, we quantified barcode proportions from genomic DNA, the only exception being trametinib, for which we used the proportion quantified from 10x scRNA-seq. The top 100 barcodes have a unique color across the whole experiment; all the others (<2% abundance) are shown in gray. All the barcodes are quantified after the regrowth period. Selection is evident when compared with the POT. B, Reconstruction of clonal dynamics using floating barcodes, extracted from culture media every 2 days over the whole length of the experiment. The dynamics show an evident clonal sweep of the blue barcode after second-line treatment with trametinib. The color code is consistent with A. Proportions are smoothed over a rolling average on a window of seven points. C, Lentiviral barcode proportions with the second-line treatment in MSS AKT–mutant organoids. D, Barcode proportions in MSI organoids after being exposed to chemotherapy (oxaliplatin) and ERK inhibition (SCH772984).
Figure 4.
Figure 4.
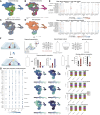
Transcriptional programs show plasticity after drug administration. A–D, UMAP of the 37,000 cells in the experiment after quality check filtering, colored, respectively, by experimental stage, drug, barcode, and cell-cycle phase. Cells for which a valid barcode could not be extracted or those with an abundance of less than 1% are shown in gray. Cells in the drug phase tend to strongly cluster by drug, whereas they tend to mix back with the parental cells during regrowth. E, Z-score distribution of adult colonic cell type markers from ref. shows the presence of distinct differentiation programs inside the organoid. F, AA aims at decomposing the input dataset as a convex combination of extreme points by learning two matrices, A and B, which are representative of the archetype weights for each point in the dataset and the matrix that defines the archetypes starting from the input dataset, respectively. Here, we use a deep learning implementation of AA. G, We then exploit the weights of matrix A to quantify differences in transcriptional programs across conditions and genotypes. The Z-score distribution for the same genes as in E is computed by archetype. H, Archetype weight distribution over UMAP. I, Average archetype weight for different selected barcodes. The trend is consistent with cells going back to the parental phenotype after regrowth. Barcode colors are consistent with Fig. 2.
Figure 5.
Figure 5.
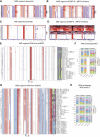
Epigenetic rewiring in resistant populations. A, UMAP plots for multiome samples. In the first row, different dimensionality reductions are shown: UMAP done with latent semantic index (LSI) exploiting just RNA information, LSI with just ATAC, and a combined LSI. In the second row, the combined UMAP is colored by archetypal weight. B, Clonal tree constructed using CNAs inferred from ATAC data. C, Average archetype weights. The blue barcode displays a clear difference in the ATAC profile compared with the others (gray). D and E, Average ATAC archetype weight for copy-number clones, for RNA archetypes (D) and ATAC archetypes (E). We split the tree into two major clades: The top one is more abundant in the trametinib samples, and the bottom one is more represented in the parental- and capivasertib-treated samples. The change in archetypal composition is consistent with previous observations from lentiviral lineage tracing. F and G, Average ATAC archetype weights for the violet and blue barcode in the MSI sample. H, Average ATAC archetype weights for the violet barcode in the AKT organoid under oxaliplatin treatment.
Figure 6.
Figure 6.
Inducing CIN before drug pressure. A and B, Single-cell copy-number profiles for the MSS AKT–mutant organoid untreated and after treatment with CENP-E and MPS1 inhibitors. This organoid seems to be stable and resilient to drug-induced alterations. C and D, Same as A and B but for the MSI organoid. In this case, the situation is different, and CENP-E and MPS1 inhibition causes a massive increase in instability, with a residual bulk of the population similar to the parental one. E and F, Bulk copy-number profile and population structure as recapitulated by barcode composition. Barcode composition matches copy-number clones, particularly evident with the blue trametinib-resistant barcode in the MSS AKT–mutant organoid. It is also clear how CENP-E inhibition induces significant changes in the population structure in the MSI organoid. G and H, RNA archetypes distribution for MSI and MSS organoids. As expected, drug exposure induces a specific transcriptional phenotype, but the induced instability acts only on the population structure, with minimal influence on the transcriptome. lpWGS, low-pass WGS.
Figure 7.
Figure 7.
Heritability and plasticity of cellular phenotypes. A and B, We propose a conceptual model in which genetic mutations and CNAs, together with heritable chromatin accessibility profiles, determine the cellular memory of a certain clone (A), positioning it within a certain heritable fitness landscape (B). However, the clone does not manifest as a single transcriptional phenotype but rather as a set of transcriptional programs that could be represented within a Waddington landscape, similarly to those that regulate development (C). Darwinian selection acts at the phenotypic level, likely exerting selective pressure at the base of the Waddington landscape. This pressure may favor only a subset of a clone’s transcriptional programs, whereas the molecular memory encoding these programs may also retain other plastic phenotypes as a side effect. This may explain the persistent phenotypic heterogeneity and plasticity of cancer clones despite the strong selective pressure of treatments that, instead, should select for a single fittest phenotype. Created in BioRender. Sottoriva, A. (2025) https://BioRender.com/p3al29z.

Similar articles

References

    1. Greaves M, Maley CC. Clonal evolution in cancer. Nature 2012;481:306–13. - PMC - PubMed
    1. Vasan N, Baselga J, Hyman DM. A view on drug resistance in cancer. Nature 2019;575:299–309. - PMC - PubMed
    1. Black JRM, McGranahan N. Genetic and non-genetic clonal diversity in cancer evolution. Nat Rev Cancer 2021;21:379–92. - PubMed
    1. Bell CC, Gilan O. Principles and mechanisms of non-genetic resistance in cancer. Br J Cancer 2020;122:465–72. - PMC - PubMed
    1. Marine J-C, Dawson S-J, Dawson MA. Non-genetic mechanisms of therapeutic resistance in cancer. Nat Rev Cancer 2020;20:743–56. - PubMed