. 2025 Sep:85:103691.
doi: 10.1016/j.redox.2025.103691. Epub 2025 May 24.

Divergent redox responses of macular and peripheral Müller Glia: Implications for retinal vulnerability

Affiliations

Divergent redox responses of macular and peripheral Müller Glia: Implications for retinal vulnerability

Ting Zhang et al. Redox Biol. 2025 Sep.

Abstract

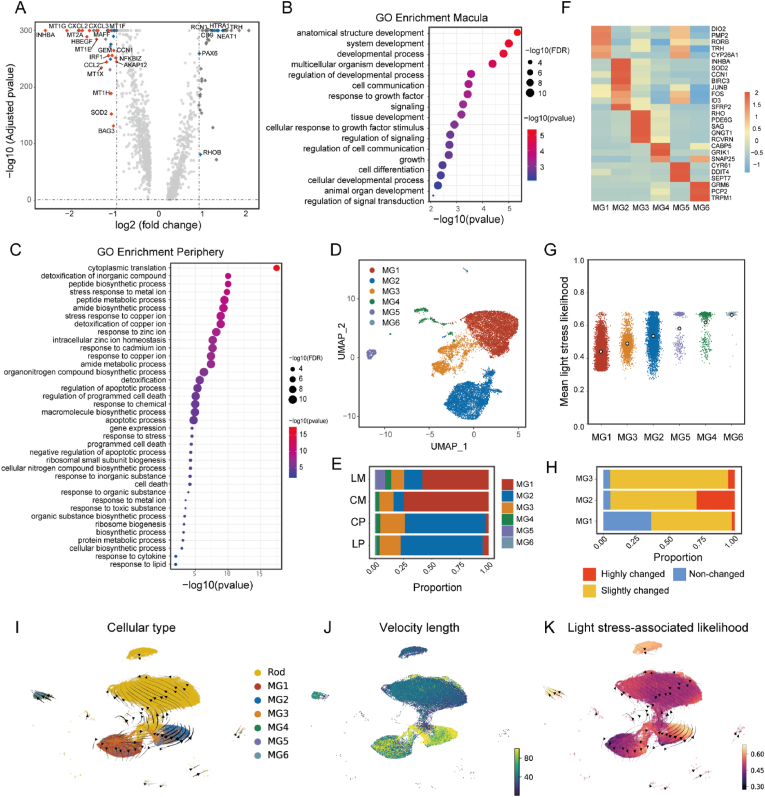
The macula is preferentially affected in some common retinal diseases (such as age-related macular degeneration, diabetic retinopathy and macular telangiectasia type 2), whereas most inherited retinal degenerations (e.g., retinitis pigmentosa) tend to initially affect the peripheral retina. This pattern suggests the macula may have intrinsic vulnerabilities in its oxidative stress defences, compared to the periphery. Profiling of single-cell level transcriptional changes found that the peripheral retina exhibited greater transcriptional alterations than the macula in response to stress. One pronounced change was in a subgroup of Müller glia (MG) that was dominant in the peripheral retina. Genes more abundantly expressed in peripheral MG were mainly associated with redox regulation, oxidative stress responses and cellular detoxification and were more influenced by oxidative insults, such as light-induced stress. In contrast, genes highly expressed in macular MG were primarily involved in cellular homeostasis and neuroprotection, showing less responsiveness to oxidative challenges. Notably, Metallothionein 1 (MT1), A-Kinase Anchor Protein 12 (AKAP12) and MAF BZIP Transcription Factor F (MAFF) were significantly more expressed in peripheral MG than in macular MG, indicating a region-specific redox regulatory mechanism. Knockdown of these genes in primary MG led to decreased viability under oxidative stress, suggesting their role in antioxidant defence. Our findings indicate that macular MG prioritise retinal function over redox adaptation, which may contribute to their vulnerability to degenerative diseases associated with oxidative damage. These insights underscore the importance of region-specific redox homeostasis in retinal health and disease.


Conflict of interest statement

Declaration of competing interest I, Ling Zhu, on behalf of all co-authors, hereby declare that they have no conflicts of interest related to our manuscript titled “Divergent Redox Responses of Macular and Peripheral Müller Glia: Implications for Retinal Vulnerability”. No financial relationships have influenced the research, analysis or conclusions presented in this manuscript.

Figures

Fig. 1
Fig. 1
Schematic workflow for generating single-cell retinal cells and transcriptomic profiles of retinal cells dissociated from the macula and mid-peripheral retina by single-cell RNA sequencing analysis. A. The workflow illustrates the steps involved in generating single cells from human macular and peripheral retinal explants, including exposure to either bright or dim light for 4 h. The process begins with the dissection of human donor eyes to isolate the neural retina, followed by culturing the macula and mid-peripheral retinal explants on transwells. The retinal cells are dissociated from the tissue to create a single-cell suspension. n = 4 donors per treatment group. M: macula, P: peripheral retina, L: light stress, C: dim light, LM: macula with light stress; LP: peripheral retina with light stress; CM: macula with dim light; CP: peripheral retina with dim light. B. Retinal cell clustering using uniform manifold approximation and projection (UMAP) for all detected transcriptomes. C. Heatmap showing the expression of retinal cell markers in identified cell clusters. D. Proportions of retinal cell types in the macula and peripheral neural retinas. E. UMAP for the peripheral retinas (P) and maculas (M) without (C) or with (L) light stress.
Fig. 2
Fig. 2
Regional and cell type-specific alterations in response to stress. A. A Venn diagram illustrates the relationships among LP vs. CP, LM vs. CM and CP vs. CM. B. A heatmap shows the correlations between different treatment groups. High correlation (red) between CM and LM indicates fewer transcriptional changes, while low correlation (orange) between CP and LP suggests significant transcriptomic profile changes. LP: Light-stressed Peripheral retina, CP: Control Peripheral retina, LM: Light-stressed Macula, CM: Control Macula. C & D. Alteration scores for retinal cell types in the peripheral retina (C) and macula (D) in response to light stress. Higher alteration scores indicate more significant changes. In the peripheral retina, significant changes were observed in rods and Müller glia (MG). In the macula, amacrine cells and rods exhibited the most significant changes. E. A scatter plot of all single cells from the macula and peripheral retina showing the distribution of light stress-associated likelihood values. Outlined circles represent average likelihood values. F. Proportions of each cell type among all cells from both the macula and periphery with a light stress-associated relative likelihood value greater than 0.6.
Fig. 3
Fig. 3
Subclusters of human Müller glia from the macula and peripheral retinas. A. Volcano plot of DEGs in Müller glia in the macula and peripheral retinas showing genes that were significantly differentially regulated by light stress. Red dots were upregulated while blue dots were downregulated. B. GO analysis of genes highly expressed in macular Müller glia (m-HXs) revealed significant enrichment in biological processes related to cell function and development. C. GO analysis of genes highly expressed in peripheral Müller glia (p-HXs) identified significant enrichment in various biological processes related to stress responses. D. UMAP of subclusters of human Müller glia identified from the macula and peripheral retinas. E. Proportions of Müller glia subclusters in the macula (M) and periphery (P) with (L) and without (C) light stress. F. Heatmap of the cluster with marker genes highly expressed in various subtypes of Müller glia. G. Scatter plot of six subtypes of Müller glia revealing the likelihood values of transcriptomes upon light stress. Each dot represents one Müller glia. H. Proportions of highly-changed (red), slightly-changed (orange) and non-changed (blue) cells in subtypes of Müller glia in response to light stress. I. UMAP plot of velocity and trajectory analyses revealed transition dynamics from Müller glia to rods. Colours indicate different cell types. J. UMAP plot of velocity length displaying the speed of differentiation. K. UMAP plot of single-cell velocity visualized by the previously calculated light stress-associated likelihood values.
Fig. 4
Fig. 4
Genes involved in the response to light stress in periphery-dominant Müller glia and immunofluorescent (IF) staining of MT1G, AKAP12 and MAFF in human peripheral retina. A. Dot plot illustrating the top ten DEGs between MG1 and MG2 cells in response to light stress. B. Violin plot showing the expression levels of MAFF, AKAP12, MT1G and MT1E in subtypes of Müller glia. C. Line chart showing the average expression levels of MT1G, MT1E, AKAP12 and MAFF in MG2 cells in response to light stress. D. IF staining of MT1G (green) in human peripheral retina. E. IF staining of CRALBP (red), a Müller glia marker. F. Co-localization of MT1G and CRALBP. G. IF staining of AKAP12 (green) in human peripheral retina. H. IF staining of CRALBP (red). I. Co-localization of AKAP12 and CRALBP. J. IF staining of MAFF (green) in human peripheral retina. K. IF staining of CRALBP (red). L. Co-localization of MAFF and CRALBP. Scale bar = 50 μM. GCL: Ganglion Cell Layer; IPL: Inner Plexiform Layer; INL: Inner Nuclear Layer; OPL: Outer Plexiform Layer; ONL: Outer Nuclear Layer.
Fig. 5
Fig. 5
Knockdown of MT1G, AKAP12 and MAFF in human primary Müller glia. A.MT1G, AKAP12 and MAFF siRNA knockdown in primary Müller glia exposed to light stress. B & C. AlamarBlue cell viability assay on primary Müller glia with or without MT1G, AKAP12 and MAFF siRNA treatment in response to light stress. n = 6 biological replicates per group. Statistical analysis was performed using Welch's t-test (two-sided) between the control group (used consistently across all pairwise comparisons) and the respective knockdown groups. Data are presented as means ± standard error of the mean (SEM). D & E. JC1 assay on primary Müller glia with or without MT1G, AKAP12 and MAFF siRNA knockdown in response to light stress. n = 8 biological replicates per group. Statistical analysis was performed using Welch's t-test (two-sided) between the control group (used consistently across all pairwise comparisons) and the respective knockdown groups. FH. Volcano plots of differential gene expression (p < 0.05, FC > 1.5) in MT1G, AKAP12 and MAFF siRNA knockdown vs. control groups. IK. IPA of differential gene expression in human primary Müller glia with MT1G, AKAP12 and MAFF siRNA knockdown compared to the control group in response to light stress.
Fig. 6
Fig. 6
Dysregulation of MT1G, AKAP12 and MAFF in human retinas with dry AMD and DR. A-D. IF staining of MT1G (green) and CRALBP (red) on the donor retina with dry AMD. A. IF staining of MT1G. B. IF staining of CRALBP and Hoechst (blue). C. Co-localization of MT1G and CRALBP. D. Magnified image of the dotted box in C. E-H. IF staining of AKAP12 (green) and CRALBP (red) on the donor retina with dry AMD. E. IF staining of AKAP12. F. IF staining of CRALBP and Hoechst (blue). G. Co-localization of AKAP12 and CRALBP. H. Magnified image of the dotted box in G. I–K. IF staining of MAFF (green) and CRALBP (red) on the donor retina with dry AMD. I. IF staining of MAFF. J. IF staining of CRALBP and Hoechst (blue). K. Co-localization of MAFF and CRALBP. L-O. IF staining of MT1G (green) and CRALBP (red) on the donor retina with DR. L. IF staining of MT1G. M. IF staining of CRALBP and Hoechst (blue). N. Co-localization of MT1G and CRALBP. O. Magnified image of the dotted box in N. P–S. IF staining of AKAP12 (green) and CRALBP (red) on the donor retina with DR. P. IF staining of AKAP12. Q. IF staining of CRALBP and Hoechst (blue). R. Co-localization of AKAP12 and CRALBP. S. Magnified image of the dotted box in R. T-W. IF staining of MAFF (green) and CRALBP (red) on the donor retina with DR. T. IF staining of MAFF. U. IF staining of CRALBP and Hoechst (blue). V. Co-localization of MAFF and CRALBP. W. Magnified image of the dotted box in V. Scale bar = 50 μM.
Fig. 7
Fig. 7
Dysregulation of MT1G, AKAP12 and MAFF in JR55558 mice mimicking subretinal neovascularisation. A. fundus photos (A), OCT (B) and FFA (C) images of the C57BL/6J control and JR5558 mice at 4 and 8 weeks of age. D & E. Images of representative protein bands and the corresponding densitometry analysis of Western Blot against MT1G, AKAP12 and MAFF in the retinas of both control and JR5558 mice at the ages of 4 and 8 weeks of age. n = 3 mouse retinas per group. Statistical analysis was performed using Welch's t-test (two-sided) between the control and the 4 weeks or 8 weeks old groups, respectively.
figs1
figs1

Similar articles

References

    1. Ruan Y., et al. Oxidative stress and vascular dysfunction in the retina: therapeutic strategies. Antioxidants. 2020;9(8) - PMC - PubMed
    1. Zwanzig A., et al. Neuroprotective effects of glial mediators in interactions between retinal neurons and Muller cells. Exp. Eye Res. 2021;209 - PubMed
    1. Vecino E., et al. Glia-neuron interactions in the mammalian retina. Prog. Retin. Eye Res. 2016;51:1–40. - PubMed
    1. Reichenbach A., Bringmann A. New functions of Muller cells. GLIA (New York, N. Y.) 2013;61(5):651–678. - PubMed
    1. Jorstad N.L., et al. Stimulation of functional neuronal regeneration from Muller glia in adult mice. Nature. 2017;548(7665):103–107. - PMC - PubMed

LinkOut - more resources