. 2025 Jun 16;5(6):101078.
doi: 10.1016/j.crmeth.2025.101078. Epub 2025 Jun 10.

CRISPR GENome and epigenome engineering improves loss-of-function genetic-screening approaches

Affiliations

CRISPR GENome and epigenome engineering improves loss-of-function genetic-screening approaches

Jannis Stadager et al. Cell Rep Methods. .

Abstract

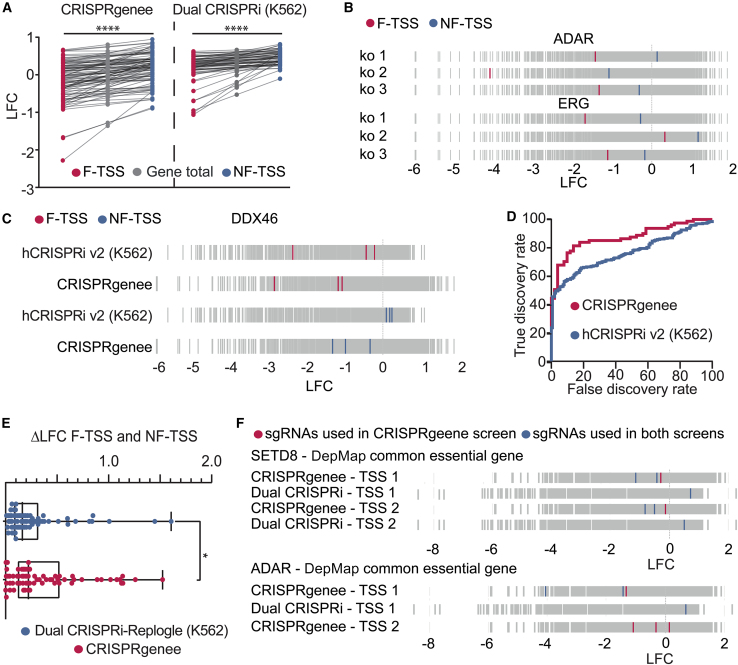
CRISPR-Cas9 technology has revolutionized genotype-to-phenotype assignments through large-scale loss-of-function (LOF) screens. However, limitations like editing inefficiencies and unperturbed genes cause significant noise in data collection. To address this, we introduce CRISPR gene and epigenome engineering (CRISPRgenee), which uses two specific single guide RNAs (sgRNAs) to simultaneously repress and cleave the target gene within the same cell, increasing LOF efficiencies and reproducibility. CRISPRgenee outperforms conventional CRISPR knockout (CRISPRko), CRISPR interference (CRISPRi), and CRISPRoff systems in suppressing challenging targets and regulators of cell proliferation. Additionally, it efficiently suppresses modulators of epithelial-to-mesenchymal transition (EMT) and impairs neuronal differentiation in a human induced pluripotent stem cell (iPSC) model. CRISPRgenee exhibits improved depletion efficiency, reduced sgRNA performance variance, and accelerated gene depletion compared to individual CRISPRi or CRISPRko screens, ensuring consistency in phenotypic effects and identifying more significant gene hits. By combining CRISPRko and CRISPRi, CRISPRgenee increases LOF rates without increasing genotoxic stress, facilitating library size reduction for advanced LOF screens.

Keywords: CP: biotechnology; CRISPR screening; CRISPR-Cas9; epigenome editing; gene editing; gene loss-of-function studies.


Conflict of interest statement

Declaration of interests J.J. is an employee of Twist Bioscience.

Figures

None
Graphical abstract
Figure 1
Figure 1
Design and validation of the CRISPRgenee concept to improve standard CRISPR LOF approaches (A) Schematic overview of the CRISPRgenee setup. An irreversible DNA DSB is introduced by targeting ZIM3-Cas9 to an exon of the gene of interest using a 20-nt guide RNA. This is combined with a simultaneous recruitment of ZIM3-Cas9 to the promoter region of the target gene using a truncated guide RNA inducing a stable repression of gene expression. (B) Flow-cytometry analysis of the depletion of the non-essential proteins CD13 and CD33 using standard 20-nt-long sgRNAs or truncated 15-nt sgRNAs in TF-1 cells expressing the dCas9-ZIM3 fusion protein. The location of the sgRNA target region is highlighted in red. (n = 3, mean ± SD). (C) Flow-cytometry analysis of the depletion of CD13 and CD33 using standard 20-nt sgRNAs or truncated 15-nt sgRNAs in TF-1 cells expressing either Cas9 or the ZIM3-Cas9 fusion protein. The location of the sgRNA target region is highlighted in black, indicating whether the sgRNA is within 1,000 bp of the nearest transcription start site (TSS) (n = 3, mean ± SEM). (D) Indel frequency of the CD13 and CD33 locus in ZIM3-Cas9+ TF-1 cells treated with control, 15-nt, or 20-nt sgRNAs. (E) Time-resolved quantification of CD13 and CD33 negative TF-1 cells expressing the indicated sgRNAs after induction of ZIM3-Cas9. A total of eight CRISPRko (ko) and seven CRISPRi (i) sgRNA designs were combined in 22 CRISPRgenee (g) constructs for comparison. Data are displayed as a single datapoint for each sgRNA or sgRNA combination and replicate summarized in a boxplot (n = 3, mean, box, and whiskers minimum to maximum); ∗p ≤ 0.05, ∗∗p ≤ 0.01, ∗∗∗p ≤ 0.001; n.s., non-significant. Significance was determined using a one-way ANOVA for (D) and a two-way ANOVA for (B), (C), and (E). See also Figures S1 and S2.
Figure 2
Figure 2
Off-target analysis of 15- and 20-nt-long sgRNAs does not reveal significant differences (A) Principal-component analysis (PCA) of the RNA-seq data for two full-length (shades of blue) and truncated (shades of red) CD33-targeting sgRNAs, non-targeting control (black), and WT (gray). (B) Correlation of the log2 fold change of sgRNA to control for each transcript between the truncated and full-length sgRNA was assessed using Spearman correlation analysis. (C) Log2 fold change of 15- and 20-nt sgRNAs targeting the TSS of CD33. Off-targets toward TSSs of other genes were predicted in silico for up to three mismatches for the 15-nt sgRNA and are indicated by color. (D) Log2 fold change of the 15- or 20-nt CD33-targeting sgRNA and the sgRNA control for all potential off-targets identified in silico. (E) Log2 fold change of identified off-targets for the 15-nt sgRNA calculated for both sgRNA variations with the DNA base mismatches indicated in red. See also Figure S3.
Figure 3
Figure 3
CRISPRgenee outperforms standard CRISPR LOF methods and validates the essential role of BUB1 in cell-cycle progression (A) Competitive proliferation assays of TF-1 cells expressing the indicated sgRNAs (gray scale) targeting BUB1. The data show the mean relative fraction of GFP+/sgRNA+ cells for three CRISPRi (i) and CRISPRko (ko) sgRNAs, and the respective CRISPRgenee (g) sgRNA combination, relative to the initial measurement over a 21-day period (n = 3, mean ± SD). (B) Competitive proliferation assays of HEK293 cells expressing ZIM3-Cas9 or the CRISPRoff construct and the indicated sgRNAs (dual- or single-sgRNA setup) targeting BUB1 to validate the improved CRISPRgenee effect observed in TF-1 cells (n = 3, mean ± SEM). (C) Inferred distribution of cell-cycle phases of HEK cells harvested at day 5 of BUB1 depletion as indicated in (B). Percentages in each phase of the cell cycle were automatically assigned using FlowJo (n = 3, mean ± SEM). (D) EMT was induced in MCF10A cells expressing either dCas9-ZIM3 or ZIM3-Cas9 and scr (ctrl) or SMAD2-targeting sgRNAs using TGFβ. The fold change of cells detected in the epithelial and mesenchymal population was calculated in SMAD2-depleted cells relative to the control (n = 3, mean ± SEM). (E) Schematic overview of the experimental setup used to validate the tolerability of CRISPRgenee in iPSCs. (F) Differentiation of iPSCs expressing CRISPRgenee and an ART1-targeting sgRNA was monitored for 3 days by assessing cell morphology and expression of Syn1. (G) Relative TRA-1/60 signal (a marker for pluripotency) of ZIM3-Cas9-positive and ZIM3-Cas9-negative Dox-stimulated iPSCs either expressing an sgRNA targeting ART1 or the transgene Ngn2 responsible for neuronal differentiation. ∗p ≤ 0.05, ∗∗p ≤ 0.01, ∗∗∗p ≤ 0.001; n.s., non-significant. Significance was determined using a two-way ANOVA for (A)–(C) and a one-way ANOVA for (D). See also Figures S4 and S5.
Figure 4
Figure 4
CRISPRgenee outperforms published LOF dropout screens with improved sgRNA consistency (A) Schematic overview of the screening setup used for the CRISPRgenee screen. A library composed of 3,686 sgRNAs targeting 1,137 chromatin-related genes was virally transduced into TF-1 erythroleukemia cells expressing ZIM3-Cas9. After antibiotic selection, cells were treated with Dox for 14 days. (B) Performance of individual sgRNAs. The log fold change (LFC) of all sgRNAs targeting internal positive (red) and neutral controls (blue) as well as sgRNAs targeting known essential (red) and non-essential genes (blue) is depicted. Data are averaged across three individual replicates. (C) Scatterplot depicting all genes ranked by the average LFC of all sgRNAs per gene across all three replicates. Internal positive (red) and neutral (blue) control genes (top), as well as essential (red) and non-essential genes (blue) are highlighted (bottom). (D) Spearman correlation r was calculated for the replicates of the CRISPRgenee screen and replicates of published screen datasets on read count, sgRNA LFC, and gene LFC level. (E) Violin plots comparing the CRISPRgenee system with a set of published CRISPR screening approaches. Left: comparison of the ΔLFC (maximum LFC – minimum LFC) of sgRNAs targeting the same gene depicted for essential genes and all genes investigated in the screen. Right: comparison of the −log 10 adjusted p-value distribution at the sgRNA and gene level. The black vertical lines depict the median for each screen and the red dashed line is the median of the CRISPRgenee screen (∗p ≤ 0.05, ∗∗∗p ≤ 0.001, ∗∗∗∗p ≤ 0.0001; one-way ANOVA with a Dunnett post hoc test). See also Figures S6–S11.
Figure 5
Figure 5
Combination of CRISPRi and CRISPRko has a highly additive effect in a multiplexed LOF screening setup (A) Differential depletion effect when targeting the functional (F) and non-functional (NF) TSS in the CRISPRgenee screening approach to the effect observed in a published screening dataset using the same sgRNAs. (B) Performance of individual sgRNA combinations demonstrating that CRISPRgenee improves the KO effect observed when targeting the NF-TSS compared to when targeting the F-TSS of essential genes. (C) CRISPRgenee rescues nonfunctioning CRISPRi indicated by the depletion observed when the NF-TSS is targeted compared to a published CRISPRi screen using the same sgRNAs. (D) ROC sensitivity curve of the CRISPRgenee screen compared to a published CRISPRi screen that utilized the same CRISPRi sgRNAs based on sgRNAs targeting essential and non-essential genes. (E) Individual sgRNA performance comparison of CRISPRgenee with a published screening approach employing a dual-CRISPRi sgRNA strategy targeting the same TSS. The CRISPRi sgRNAs identical in both screens are highlighted (blue) as well as the CRISPRi sgRNA solely used in the CRISPRgenee screen (red). (F) Boxplot depicting the ΔLFC difference when targeting the F and NF-TSS comparing CRISPRgenee with a published dual-CRISPRi screening dataset (∗p ≤ 0.05; non-parametric Wilcoxon test). See also Figure S12.
Figure 6
Figure 6
CRISPRgenee can identify novel dependencies in multiplexed LOF screening approaches (A) Heatmap showing the LFC of genes targeted in the CRISPRgenee screen compared to the dependency score of TF-1 cells from DepMap and clustered into four distinct groups using k-means clustering. (B) Scatterplot showing the CRISPRgenee gene-level depletion compared to the dependency score from the DepMap portal (https://depmap.org/portal/) for TF-1 cells. Cluster 4 is depicted in red and the differential genes selected for validation of the improved CRISPRgenee effect are highlighted with a black circle. (C) Individual sgRNA performance of sgRNAs targeting the indicated differential genes. (D) Competitive proliferation assays in TF-1 cells expressing ZIM3-Cas9 and the indicated sgRNAs. For the validation, the highest-performing CRISPRgenee combination and the resulting single sgRNA controls as well as the best in silico predicted CRISPRko sgRNA from the Avana library used to contribute to the DepMap dependency score and a CRISPRgenee combination using this KO sgRNA was used (n = 3, mean ± SEM). See also Figure S12.

References

    1. Bock C., Datlinger P., Chardon F., Coelho M.A., Dong M.B., Lawson K.A., Lu T., Maroc L., Norman T.M., Song B., et al. High-content CRISPR screening. Nat. Rev. Methods Primers. 2022;2 doi: 10.1038/s43586-022-00098-7. - DOI - PMC - PubMed
    1. Smits A.H., Ziebell F., Joberty G., Zinn N., Mueller W.F., Clauder-Münster S., Eberhard D., Fälth Savitski M., Grandi P., Jakob P., et al. Biological plasticity rescues target activity in CRISPR knock outs. Nat. Methods. 2019;16:1087–1093. doi: 10.1038/s41592-019-0614-5. - DOI - PubMed
    1. Mou H., Smith J.L., Peng L., Yin H., Moore J., Zhang X.O., Song C.Q., Sheel A., Wu Q., Ozata D.M., et al. CRISPR/Cas9-mediated genome editing induces exon skipping by alternative splicing or exon deletion. Genome Biol. 2017;18:108. doi: 10.1186/s13059-017-1237-8. - DOI - PMC - PubMed
    1. van Overbeek M., Capurso D., Carter M.M., Thompson M.S., Frias E., Russ C., Reece-Hoyes J.S., Nye C., Gradia S., Vidal B., et al. DNA Repair Profiling Reveals Nonrandom Outcomes at Cas9-Mediated Breaks. Mol. Cell. 2016;63:633–646. doi: 10.1016/j.molcel.2016.06.037. - DOI - PubMed
    1. Allen F., Crepaldi L., Alsinet C., Strong A.J., Kleshchevnikov V., De Angeli P., Páleníková P., Khodak A., Kiselev V., Kosicki M., et al. Predicting the mutations generated by repair of Cas9-induced double-strand breaks. Nat. Biotechnol. 2018;37:64–72. doi: 10.1038/nbt.4317. - DOI - PMC - PubMed

MeSH terms

Substances