

Reduced JAG1 Expression Through miR-200 Overexpression or Crispr-Cas Mediated Knockout Impairs TNBC Growth and Metastasis
- PMID: 40499559
- PMCID: PMC12272820
- DOI: 10.1002/mc.23937
Reduced JAG1 Expression Through miR-200 Overexpression or Crispr-Cas Mediated Knockout Impairs TNBC Growth and Metastasis
Abstract
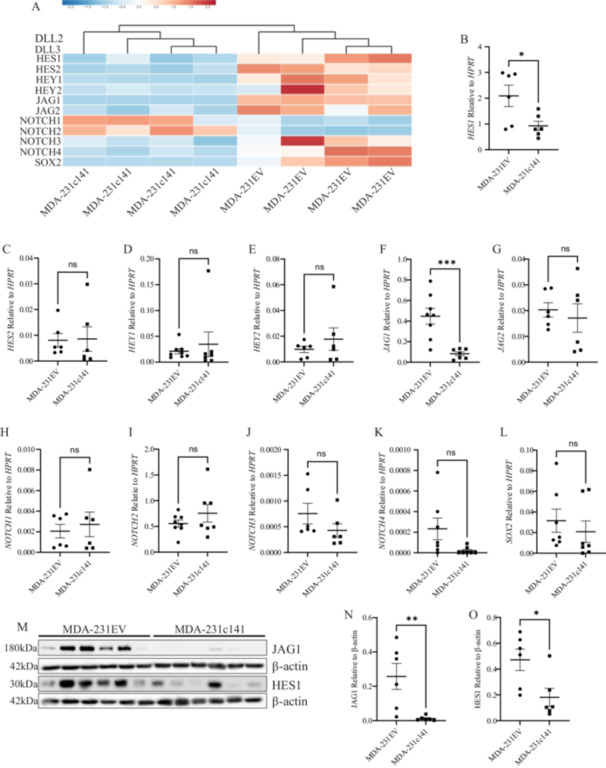
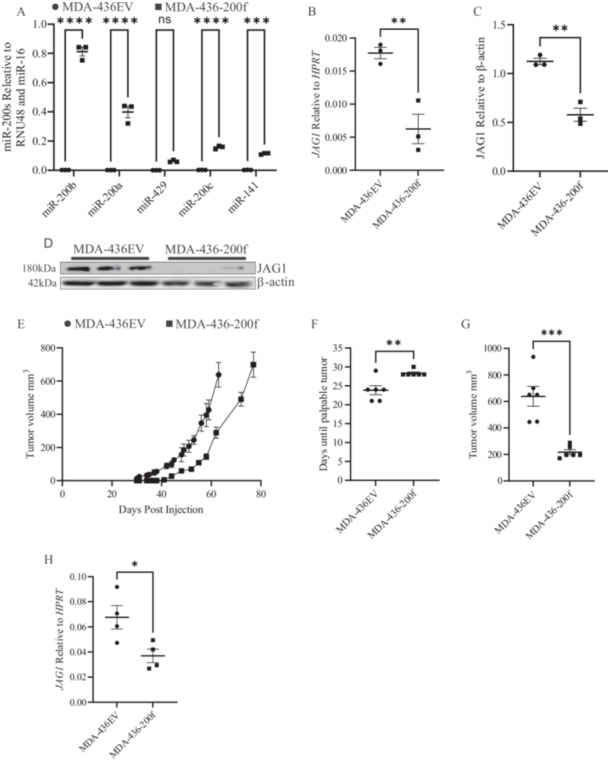
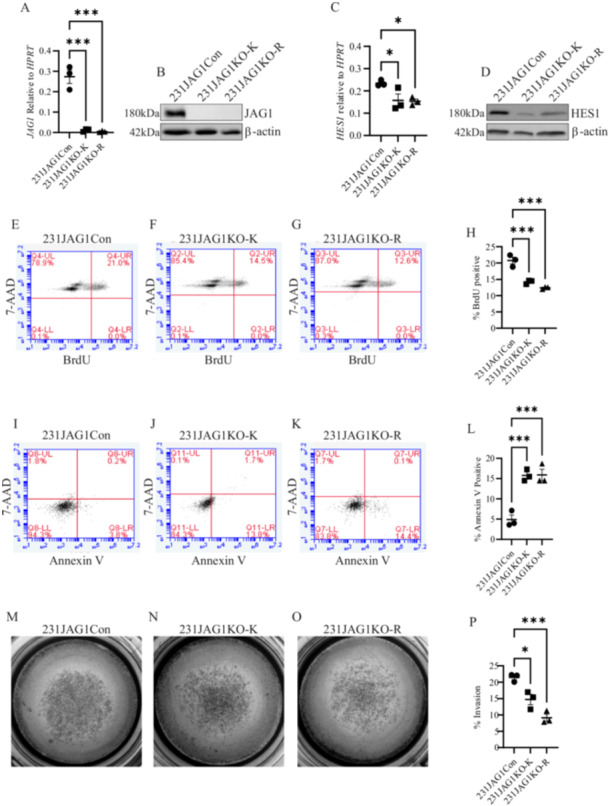
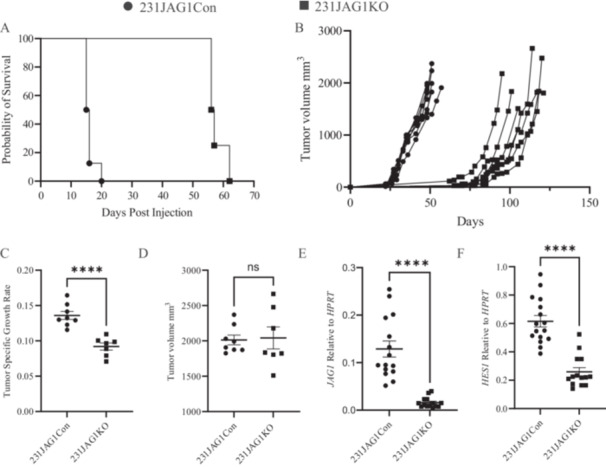
Studies from our lab demonstrated that increasing miR-200 expression in human triple negative breast cancer (TNBC) reduced tumor growth and metastasis In Vivo. In this study, we found that overexpression of miR-200s in TNBC cells significantly reduced the expression of JAG1. When JAG1 was knocked out in MDA-MB-231 cells proliferation and invasion were significantly reduced In Vitro. Moreover, loss of JAG1 inhibited mammary tumor growth and metastasis In Vivo. RNA sequencing revealed that loss of JAG1 altered the expression of genes associated with the ECM, angiogenesis, and EMT. These results imply that miR-200s may mediate some of their antitumor actions through reducing JAG1 expression and suggest that agents targeting JAG1 should be further evaluated as a therapeutic strategy for TNBC.
Keywords: JAG1; TNBC; breast cancer; metastasis; miR‐200.
© 2025 The Author(s). Molecular Carcinogenesis published by Wiley Periodicals LLC.
Conflict of interest statement
The authors declare no conflicts of interest.
Figures
Similar articles
-
The Antimicrobial Peptide Merecidin Inhibit the Metastasis of Triple-Negative Breast Cancer by Obstructing EMT via miR-30d-5p/Vimentin.Technol Cancer Res Treat. 2024 Jan-Dec;23:15330338241281310. doi: 10.1177/15330338241281310. Technol Cancer Res Treat. 2024. PMID: 39267432 Free PMC article.
-
POC1A induces epithelial-mesenchymal transition to promote growth and metastasis through the STAT3 signaling pathway in triple-negative breast cancer.Mol Med. 2025 Aug 19;31(1):280. doi: 10.1186/s10020-025-01315-1. Mol Med. 2025. PMID: 40830747 Free PMC article.
-
miR-24-2 targets Akt and inhibits cell survival, EMT, and tumour growth in triple-negative breast cancer.Biochem Biophys Res Commun. 2025 Aug 15;775:152182. doi: 10.1016/j.bbrc.2025.152182. Epub 2025 Jun 9. Biochem Biophys Res Commun. 2025. PMID: 40513147
-
Reawakening the master switches in triple-negative breast cancer: A strategic blueprint for confronting metastasis and chemoresistance via microRNA-200/205: A systematic review.Crit Rev Oncol Hematol. 2024 Dec;204:104516. doi: 10.1016/j.critrevonc.2024.104516. Epub 2024 Sep 19. Crit Rev Oncol Hematol. 2024. PMID: 39306311
-
Circular RNAs as novel biomarkers in triple-negative breast cancer: a systematic review.Mol Biol Rep. 2022 Oct;49(10):9825-9840. doi: 10.1007/s11033-022-07502-1. Epub 2022 May 10. Mol Biol Rep. 2022. PMID: 35534586
References
-
- Perou C. M., Sørlie T., Eisen M. B., et al., “Molecular Portraits of Human Breast Tumours,” Nature 406 (2000): 747–752. - PubMed
-
- Simpson K., Conquer‐van Heumen G., Watson K. L., Roth M., Martin C. J., and Moorehead R. A., “Re‐Expression of miR‐200s in Claudin‐Low Mammary Tumor Cells Alters Cell Shape and Reduces Proliferation and Invasion Potentially Through Modulating Other miRNAs and SUZ12 Regulated Genes,” Cancer Cell International 21 (2021): 89. - PMC - PubMed
-
- Bockmeyer C. L., Christgen M., Müller M., et al., “Microrna Profiles of Healthy Basal and Luminal Mammary Epithelial Cells Are Distinct and Reflected in Different Breast Cancer Subtypes,” Breast Cancer Research and Treatment 130 (2011): 735–745. - PubMed
MeSH terms
Substances
Grants and funding
LinkOut - more resources
Full Text Sources
Miscellaneous
