. 2025 Jul;31(7):2306-2316.
doi: 10.1038/s41591-025-03692-w. Epub 2025 Jun 11.

T and B cell responses against Epstein-Barr virus in primary sclerosing cholangitis

Affiliations

T and B cell responses against Epstein-Barr virus in primary sclerosing cholangitis

Hesham ElAbd et al. Nat Med. 2025 Jul.

Abstract

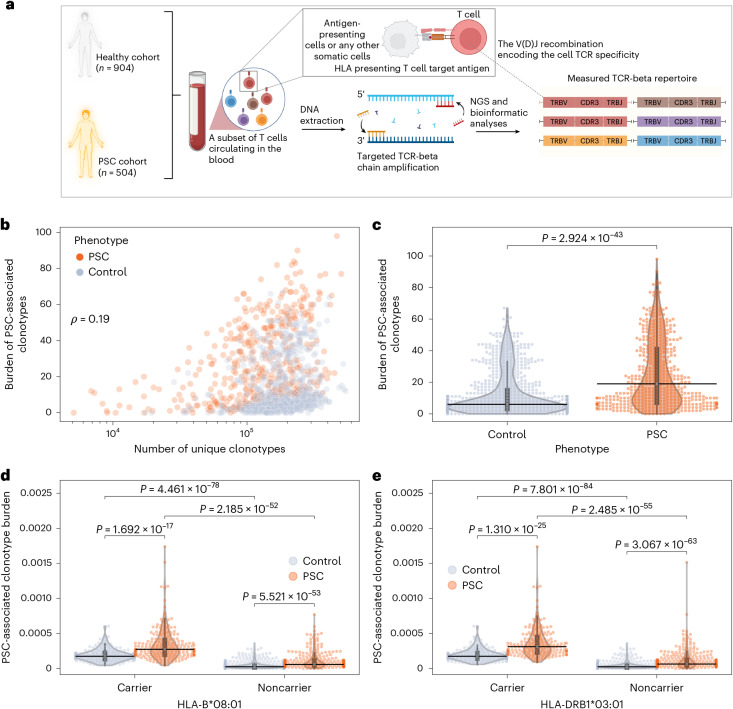
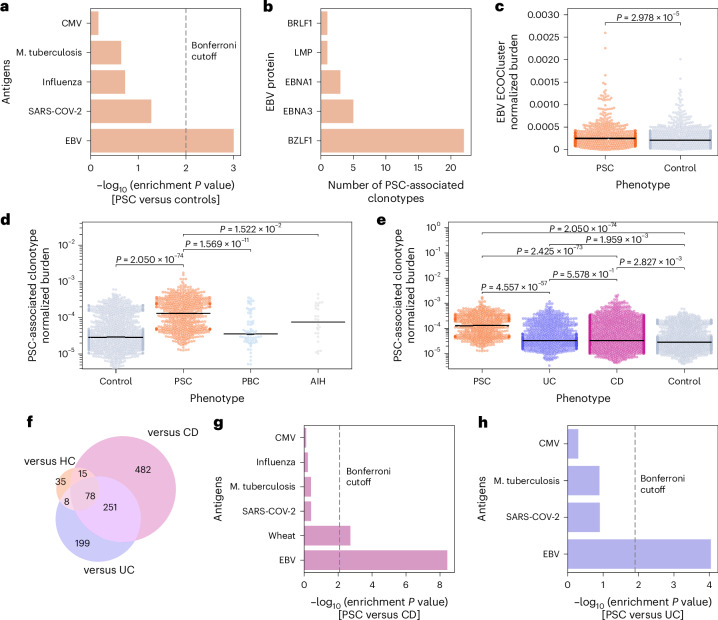
Primary sclerosing cholangitis (PSC) is an idiopathic, progressive and incurable liver disease. Here, we aimed for systematic analyses of adaptive immune responses in PSC. By profiling the T cell repertoires of 504 individuals with PSC and 904 healthy controls, we identified 1,008 clonotypes associated with PSC. A substantial fraction of these clonotypes was restricted to known PSC human leukocyte antigen susceptibility alleles and known to target Epstein-Barr virus (EBV) epitopes. We further utilized phage-immunoprecipitation sequencing to determine antibody epitope repertoires of 120 individuals with PSC and 202 healthy controls, which showed a higher burden of anti-EBV responses in PSC than controls. EBV-specific monoclonal antibodies isolated from B cells in PSC livers corroborated convergent B and T cell responses against EBV. By analyzing electronic health records of >116 million people, we identified an association between infectious mononucleosis and PSC (odds ratio, 12; 95% confidence interval, 6.3-22.9), suggesting a link between EBV and PSC.


Conflict of interest statement

Competing interests: M.P., D.H.M., B.H. and H.S.R. have or had employment and equity ownership with Adaptive Biotechnologies. H.E. did an internship at Adaptive biotechnologies from July 2023 until September 2023. F.T. received speaker’s fees from Abbvie, Bristol-Myers-Squibb, Celltrion Healthcare, Dr Falk Pharma, Eli Lilly, Ferring Pharmaceuticals and Janssen, and funding from Sanofi/Regeneron. T.H.K. declares consulting fees from Albireo, Boehringer Ingelheim, MSD, Gilead and Falk Pharma unrelated to the present work. A.-K.P. (institution) has received speaker, consulting or travel honoraria from Novartis, Biogen, Roche and UCB all used for research support and unrelated to the present work. The other authors declare no competing interests.

Figures

Fig. 1
Fig. 1. Burden of PSC-associated meta-clonotypes and associations with alleles of the ancestral HLA haplotype 8.1.
a, Schematic overview of the TCR sequencing (TCR-seq) pipeline used, starting with the collection of peripheral blood, followed by DNA extraction, then targeted amplification using PCR and then sequencing. Finally, different bioinformatic pipelines were used to identify T cell clonotypes and to quantify their expansion from the generated sequencing reads. b, Weak correlation between the burden of primary sclerosing cholangitis (PSC)-associated meta-clonotypes (n = 1,008 clonotypes) and repertoire size as measured by Spearman correlation (ρ) across all repertoires (n = 1,408 people). Burden is defined as the number of unique PSC-associated clonotypes identified in the repertoire of each person (y axis). The x axis shows the total number of unique clonotypes, defined as unique V and J genes combinations in addition to the amino acid sequence of the CDR3 region. c, Average difference in the burden of PSC-associated meta-clonotypes in people with PSC (n = 504) and controls (n = 904). d, Normalized burden in HLA-B*08:01 carrier individuals with (n = 205) and without (n = 167) PSC relative to noncarrier individuals with (n = 299) and without (n = 737) PSC. e, The same observations for HLA-DRB1*03:01 carrier individuals with (n = 179) and without (n = 173) PSC in comparison with noncarrier individuals with (n = 325) and without (n = 731) PSC. In be each dot represents the repertoire of an individual with or without PSC; black lines represent the median across different individuals; boxplot, interquartile range (IQR); whiskers represent datapoints within the 1.5 times the IQR range. In ce, a two-sided Mann–Whitney–Wilcoxon test was used to compare the burden or the normalized burden between the different groups included in the study. Panel a was created using BioRender.com.
Fig. 2
Fig. 2. PSC-associated clonotypes are restricted to PSC risk HLA alleles.
a, Arrangement of primary sclerosing cholangitis (PSC)-associated clonotypes into several clusters. To build these clusters, we established an edge between two clonotypes (nodes in the graphic above) if the two clonotypes share the same V and J genes and differ in their complementarity-determining region 3 (CDR3) sequence by one amino acid only. b,c, The CDR3 motifs of the two main clusters associated with the HLA-DRB1*03:01 allele. Each of these clusters is derived from a different V/J gene combination and exhibits different CDR3 sequence motif depicted in (b) and (c). d,e, Two main CDR3 motifs associated with the HLA-B*08:01 allele each with a distinct V/J gene usage and a CDR3 sequence. f, Motif derived from the largest cluster without a known HLA restriction. In bf, amino acids are colored according to their physiochemical properties, whereas the height of each amino acid representation can be interpreted as the degree of conservation of a specific amino acid at a specific position within a CDR3 motif.
Fig. 3
Fig. 3. Pathogen enrichment analysis of PSC-associated clonotypes.
a, Enrichment of primary sclerosing cholangitis (PSC)-associated clonotypes identified by comparing the TCR beta (TRB) repertoires of people with PSC relative to controls. This enrichment analysis is based on the number of overlapping clonotypes, for example Epstein-Barr virus (EBV; n = 6 clonotypes), cytomegalovirus (CMV; n = 3 clonotypes) and M. tuberculosis (Mtb; n = 1 clonotypes) and the number of pathogens-specific clonotypes in the public datasets. b, The strong response against the lytic phase master regulator BZLF1 protein of EBV obtained by searching the list of 1,008 PSC-associated clonotypes in the MIRA-generated annotation database (MIRA database); y axis, different EBV proteins; x axis, number of PSC-associated clonotypes that recognize peptides derived from these proteins. c, Burden of the EBV ECOCluster in people with PSC (n = 504) and healthy controls (n = 904). This burden was calculated by dividing the number of clonotypes overlapping with the EBV ECOCluster by the total number of clonotypes identified in a sample’s repertoire. d, Difference in the normalized burden of PSC-associated clonotypes (n = 1,008) in PSC relative to controls as well as two autoimmune liver diseases, namely primary biliary cholangitis (PBC; n = 63) and autoimmune hepatitis (AIH; n = 28). e, Burden of PSC-associated clonotypes in PSC relative to controls, people with Crohn’s disease (CD; n = 2,037) and people with ulcerative colitis (UC;n = 844). f, Overlap in the sets of PSC-associated clonotypes identified by comparing the TRB repertoire of people with PSC with healthy controls (versus HC), people with UC (versus UC) and people with CD (versus CD). These sets of clonotypes were derived by comparing the different phenotypes, that is, CD, UC and controls with PSC. g,h, Pathogen enrichment analysis of PSC-associated clonotypes identified by comparing the TRB repertoire of people with PSC relative to people with CD (g) or UC (h). In c–e, each dot represents an individual, that is, the repertoire of a study participant, and black lines represent the median. All statistical comparisons were conducted using the two-sided Mann–Whitney–Wilcoxon test without correction for multiple testing.
Fig. 4
Fig. 4. The antibody repertoire of people with PSC is marked by a higher burden of anti-EBV responses.
a, Overview of the framework used to decode the exposure history of people with primary sclerosing cholangitis (PSC) and healthy controls using phage-immunoprecipitation sequencing (PhIP–seq). Briefly, sera were incubated with a bacteriophage library containing 357,000 peptides expressed on the capsids of the library bacteriophages. Subsequently, immunoprecipitation was conducted to pulldown antibody–bacteriophage complexes. After washing away unbound bacteriophages, DNA was extracted, and the inserted peptide sequences were amplified using PCR and then sequenced to identify target antigens that were recognized by the antibodies in the sera. b, Reduction in the number of bound antigens by the PSC cohort (n = 115) relative to controls (n = 201). c, Number of individuals binding to a particular antigen across all antigens included in the library. d, Number of antigens identified only in controls, in people with PSC or in both cohorts. e, Incidence analysis of antigens bound by the PSC and healthy cohorts; before the analysis, we calculated the prevalence of each bound antigen in the PSC and healthy cohorts, and we restricted our analysis to antigens with an absolute difference in prevalence between the two cohorts of more than 0.05 (that is, 5% differences in prevalence between the two cohorts). f, Burden of anti-Epstein-Barr virus (EBV) responses in the PSC cohort (n = 115) relative to the healthy control cohort (n = 201). The immune response burden was calculated by dividing the number of bound EBV antigens by the total number of antigens identified in the functional antibody repertoire. g, The antigenic region of BMRF1, which is covered by three independent peptides identified from the incidence analysis shown in e. In g, the color scheme reflects the physicochemical properties of the amino acids. In b and f, each dot represents an individual, that is, the repertoire of a study participant, and black lines represent the median. Additionally, the two-sided Mann–Whitney–Wilcoxon test was used to compare the functional antibody repertoire of people with PSC and healthy controls. Panel a was created using BioRender.com.
Fig. 5
Fig. 5. Expansion of immune responses toward different EBV antigens in PSC and controls as inferred from PhIP–seq data.
In all panels, the burden of a particular protein in a sample refers to the number of antigens derived from this protein divided by the total number of antigens recognized in this sample, which was calculated for people with (n = 115) or without (n = 201) primary sclerosing cholangitis (PSC). ad, Burden of capsid and structural Epstein-Barr virus (EBV) antigens, namely, BFRF3 (a), BLLF1 (b), BALF4 (c) and BLRF2 (d). eh, Burden of lytic phase proteins, namely, BMRF1 (e), BZLF1 (f), BOLF1 (g) and LMP1 (h). il Burden of different latency program antigens, namely EBNA1 (i), EBNA2 (j), EBNA3A (k) and EBNA3C (l). In all panels, each dot represents the burden of response against a particular EBV protein in an individual and black lines represent the median across different people, the boxplots represent the IQR and the whiskers represent datapoints within the 1.5 times the IQR range. All statistical comparisons were conducted using the two-sided Mann–Whitney–Wilcoxon test.
Fig. 6
Fig. 6. Expanded liver-resident B cells in people with PSC show a higher anti-EBV response burden relative to PBC.
a, Steps used to generate monoclonal antibodies from liver-derived B cells and to decode their antigenic specificities. Briefly, single-cell B cell receptor sequencing was conducted on B cells isolated from liver biopsies. Subsequently, expanded B cell clonotypes were cloned into a mammalian expression system to produce monoclonal antibodies. The antigenic specificities of these monoclonal antibodies was identified using phage-immunoprecipitation sequencing (PhIP–seq). b, Frequency of anti-EBV monoclonal antibodies generated from expanded B cells in the liver of three PSC (n = 9 total antibodies) and three PBC liver biopsies (n = 15 total antibodies). Frequency was calculated across the produced monoclonal antibodies and not the number of samples. c, The antigenic region of BOLF1 to which monoclonal antibodies from the liver of people with PSC bind. d, Three-dimensional location of BFRF3 (blue) on the surface of the EBV capsid structure. The capsid is composed of 11 pentons and 150 surrounding hexons, which are complexes of several different proteins, among which a multimer of the main capsid protein (MCP, light and dark gray cartoons) provides for the main structural basis together with BFRF3 cross-linking on the top. BFRF3 also mediates Tegument binding through the flexible C terminus. The antigenic peptide ranges from 69 to 122 and is partly structured (red helices, positions 69–77) but mostly disordered (indicated schematically as a thin red line). e, Association of different autoimmune and immune-mediated inflammatory diseases, including primary sclerosing cholangitis (PSC), Crohn's disease (CD), ulcerative colitis (UC) and multiple sclerosis (MS) with infectious mononucleosis (IM), with filled diamonds representing the association odds ratio (OR) and error bars representing the 95% CI. Panel a was created using BioRender.com.
Extended Data Fig. 1
Extended Data Fig. 1. The expansion of the 1,008 PSC-associated clonotypes identified in the current study in two independent validation cohorts.
(a) The expansion of the PSC-associated clonotypes in the US-based SPARC IBD cohort containing 2,487 individuals with IBD and 73 individuals with PSC-IBD. (b) The expansion of PSC-associated clonotypes in 154 individuals with PSC and 64 healthy controls from Norway. Each dot represents the cumulative expansion of all PSC-associated clonotypes in the repertoire of an individual, and the black lines represent the median. In both panels, a two-sided Mann-Whitney-Wilcoxon test was used to compare the expansion of PSC-associated clonotypes.
Extended Data Fig. 2
Extended Data Fig. 2. The identified 1,008 PSC-associated clonotypes are detected and expanded in PSC livers.
(a) The number of PSC-associated clonotypes that were detected in different PSC-liver repertoires. The PSC liver TRB repertoires were obtained from Liaskou et al.. (b) shows the number of PSC-associated clonotypes that were detected in the blood and liver repertoires of individuals with PSC. (c) depicts the total number of unique clonotypes identified in the blood and liver of each individual in the utilized dataset. (d) illustrates the normalized burden of PSC-associated clonotypes in the liver as well as blood of people with PSC. The dataset used in (b), (c), and (d) is derived from Henriksen et al..
Extended Data Fig. 3
Extended Data Fig. 3. The normalized burden of PSC-associated clonotypes is not associated with biological sex.
(a) The lack of difference in the normalized burden in females (n = 471 individuals) relative to males (n = 937 individuals) irrespective of the underlying disease across the entire cohort of PSC and healthy controls. (b) The burden of PSC-associated clonotypes was significantly higher in individuals with PSC relative to healthy controls independent of the biological sex. This analysis was performed across the entire cohort which contains 304 females without PSC, 167 females with PSC, 600 males without PSC and 337 males with PSC. In both panels, each dot represents the cumulative expansion of all PSC-associated clonotypes in the repertoire of an individual, black lines represent the median across different individuals, the boxplots represent the interquartile range (IQR) and the whiskers represent datapoints within the 1.5 times the IQR range. Lastly, a two-sided Mann-Whitney-Wilcoxon test was used to compare the normalized burden across the different groups included in the study.
Extended Data Fig. 4
Extended Data Fig. 4. The relationship between the burden of PSC-associated clonotypes and years since PSC-diagnosis.
(a) The distribution of years since diagnosis across the cohort. (b) The correlation between years since PSC diagnosis and the normalized burden of PSC-associated clonotypes. In both panels, the TRB repertoires of 289 individuals with PSC was included in the analysis.
Extended Data Fig. 5
Extended Data Fig. 5. The frequency of different HLA alleles in the discovery cohort of individuals with PSC and healthy controls.
(a) The frequency of HLA-A alleles in the PSC cohort and the healthy cohort. (b), (c), (d), (e), (f), (g) and (h), The frequency of HLA-B alleles, HLA-C alleles, HLA-DRB1 alleles, HLA-DQA1 alleles, HLA-DQB1 alleles, HLA-DPA1 alleles and HLA-DPB1 alleles in the PSC cohort and the healthy cohort, respectively. In all panels, the imputed HLA alleles from genotyping arrays for 431 individuals with PSC and 773 individuals without PSC were analyzed.
Extended Data Fig. 6
Extended Data Fig. 6. EBV-specific response of expanded T cell lines against EBV-LCLs and non-transformed B cells in IFN-gamma ELISpot.
Response of T cell lines from individuals with PSC (n = 4) towards autologous Epstein–Barr virus lymphoblastoid cell lines (EBV-LCLs) in an effector:target (E:T) ratio of 1:1 (a) or against EBV-LCLs and non-transformed B cells in E:T ratio of 5:1 from two partially HLA-matched allogenic donors (b). Plotted values represent the mean and standard deviation of the spot-forming colonies (SFC) per 106 cells subtracted by the spot-forming colonies (SFC) per 106 cells of the unstimulated T cell controls (negative controls ranging from 0–7 SFC/106 cells) of two technical replicates.

References

    1. Karlsen, T. H., Folseraas, T., Thorburn, D. & Vesterhus, M. Primary sclerosing cholangitis; a comprehensive review. J. Hepatol.67, 1298–1323 (2017). - PubMed
    1. Carbone, M. et al. Liver transplantation for primary sclerosing cholangitis (PSC) with or without inflammatory bowel disease (IBD)—a European Society of Organ Transplantation (ESOT) consensus statement. Transpl. Int.36, 11729 (2023). - PMC - PubMed
    1. Chazouilleres, O. et al. EASL clinical practice guidelines on sclerosing cholangitis. J. Hepatol.77, 761–806 (2022). - PubMed
    1. van Munster, K. N. et al. Disease burden in primary sclerosing cholangitis in the Netherlands: a long-term follow-up study. Liver Int.43, 639–648 (2023). - PubMed
    1. Ji, S.-G. et al. Genome-wide association study of primary sclerosing cholangitis identifies new risk loci and quantifies the genetic relationship with inflammatory bowel disease. Nat. Genet.49, 269–273 (2017). - PMC - PubMed

LinkOut - more resources