. 2025 Jul;57(7):1628-1637.
doi: 10.1038/s41588-025-02223-0. Epub 2025 Jun 11.

A map of blood regulatory variation in South Africans enables GWAS interpretation

Affiliations

A map of blood regulatory variation in South Africans enables GWAS interpretation

Stephane E Castel et al. Nat Genet. 2025 Jul.

Abstract

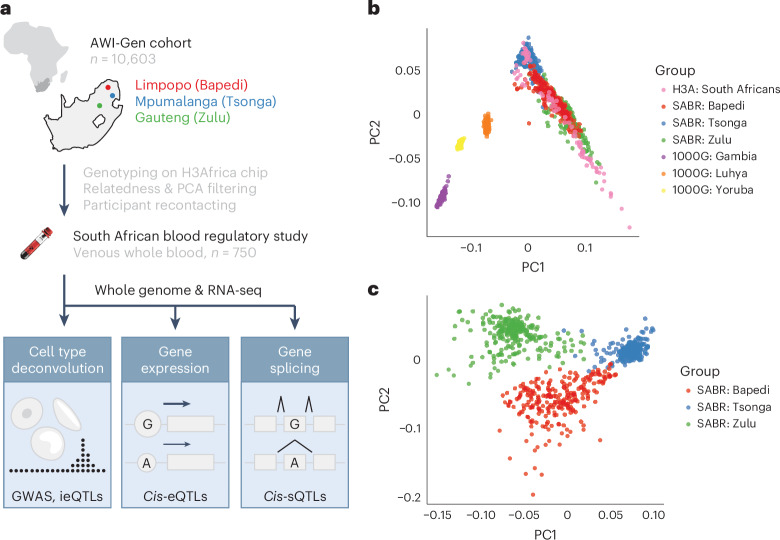
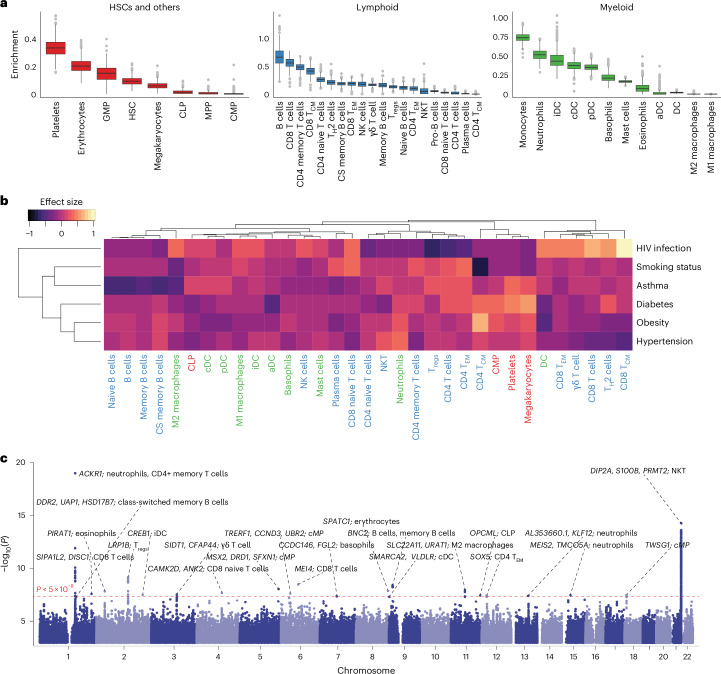
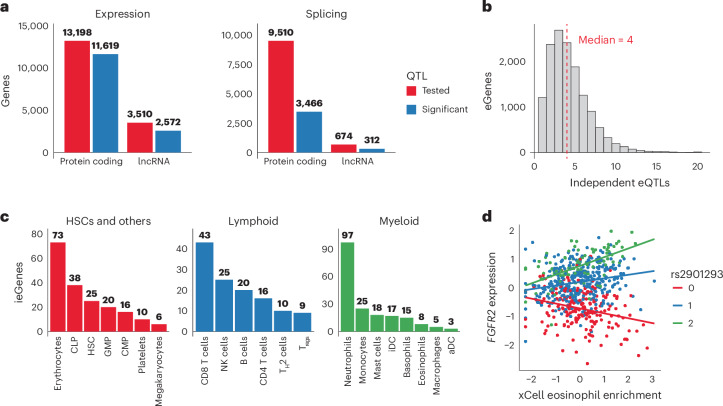
Functional genomics resources are critical for interpreting human genetic studies, but currently they are predominantly from European-ancestry individuals. Here we present the South African Blood Regulatory (SABR) resource, a map of blood regulatory variation that includes three South Eastern Bantu-speaking groups. Using paired whole-genome and blood transcriptome data from over 600 individuals, we map the genetic architecture of 40 blood cell traits derived from deconvolution analysis, as well as expression, splice and cell-type interaction quantitative trait loci. We comprehensively compare SABR to the Genotype Tissue Expression Project and characterize thousands of regulatory variants only observed in African-ancestry individuals. Finally, we demonstrate the increased utility of SABR for interpreting African-ancestry association studies by identifying putatively causal genes and molecular mechanisms through colocalization analysis of blood-relevant traits from the Pan-UK Biobank. Importantly, we make full SABR summary statistics publicly available to support the African genomics community.


Conflict of interest statement

Competing interests: S.E.C., A.K.-E., M.K., O.A.G., M.H., S.L.v.B., E.E.B., S.K., K.-D.H.N., K.A.W. and L.Y.-A. were or are employees and/or equity owners at Variant Bio. All other authors declare no competing interests.

Figures

Fig. 1
Fig. 1. The SABR study includes diverse genetics across three SEB groups.
a, SABR blood transcriptome QTL study design. b, Principal component analysis of SABR participants and African-ancestry reference groups (1000 Genomes (1000G) and H3A). c, Principal component analysis of SABR participants without reference groups included.
Fig. 2
Fig. 2. Cell-type deconvolution analyses of whole-blood transcriptome data.
a, Distribution of cell-type enrichment scores calculated using xCell for 40 blood-relevant cell types stratified by lineage—HSCs (red), lymphoid cells (blue) and myeloid cells (green). b, Heatmap of effect estimates from a logistic regression model of disease and cell-type enrichment with cell types labeled by lineage. c, Combined Manhattan plot of 19 cell-type enrichment GWAS with at least one genome-wide significant hit (two-sided nominal P < 5 × 10−8 from linear regression model, dotted red line), with nearest genes and cell types listed for each locus. For each variant, the most significant association is plotted. For boxplots—bottom whisker, Q1–1.5× interquartile range (IQR); top whisker, Q3 + 1.5× IQR; box, IQR; center, median. HSCs, hematopoietic stem cells. CLP, common lymphoid progenitors; GMP, granulocyte-monocyte progenitors; CMP, common myeloid progenitors; iDC, immature dendritic cells; aDC, activated dendritic cells; MPP, multipotent progenitors; NKT, natural killer T cell.
Fig. 3
Fig. 3. Expression, splice and cell-type interaction cis-QTL mapping in whole blood.
a, Number of genes tested (red) and significant (blue, FDR < 5%) for expression and splice cis-QTLs, stratified by gene type. b, Number of conditionally independent cis-eQTLs mapped per eGene. c, Number of significant cis-ieQTLs mapped across 21 different cell types stratified by lineage (CLP, HSC, GMP, CMP, iDC and aDC). d, Example of a cis-ieQTL for FGFR2 that is dependent on eosinophil enrichment levels (interaction term two-sided P = 2.22 × 10−13 from linear regression model).
Fig. 4
Fig. 4. A South African map of blood regulatory variation.
a, Proportion of lead cis-QTL variants that are unobserved in 1000 Genomes continental ancestries. The number of unique QTL variants is listed for each QTL type. b, Example of a predicted stop-gain eQTL for NIPSNAP3A unobserved in non-African ancestries (rs34856872, MAF 1000G African ancestry = 3.9%). c, Example of a predicted splice donor variant sQTL for KIF16B unobserved in 1000 Genomes (rs138620712, MAF SABR = 2.1%). Participant counts are listed in parentheses under genotype classes (0:C/C, 1:C/T, 2:T/T, 1:C/A). d, Proportion of conditionally independent cis-eQTLs stratified by index that are unobserved in either non-African or African 1000 Genomes ancestries. The significance of the difference in proportion of unobserved alleles between index 1 and 5+ eQTLs was calculated using a two-sided Fisher’s exact test. Non-African refers to East Asian, South Asian and European ancestry 1000 Genomes individuals. For boxplots—bottom whisker, Q1 − 1.5× IQR; top whisker, Q3 + 1.5× IQR; box, IQR; center, median. The P values shown for QTLs are two-sided from the linear regression model.
Fig. 5
Fig. 5. Colocalization of SABR QTLs with Pan-UKBB African-ancestry GWAS.
a, Number of colocalizations per QTL type. b, Number of colocalizations flattening at the gene-level across QTL types and summarizing based on GWAS trait category. c, Number of lead colocalization variants with MAF < 1% in 1000 Genomes continental ancestries. d,e, Locus plot of colocalization between SUSD6 eQTL and lipid disease (d; lead variant rs10140437, PP4 = 0.85), and LPIN1 sQTL and waist circumference (e; rs59909741, PP4 = 1.00). In d and e, SABR QTL is shown on top and GWAS on bottom, and lead variant from colocalization analysis is indicated with rsID and set to reference with LD calculated using 1000 Genomes African-ancestry individuals. Two thresholds for colocalization were used—lenient (red, PP4 > 0.50 and PP4/(posterior probability of colocalization hypothesis three (PP3) + PP4) > 0.80) and strict (blue, PP4 > 0.80). The P values in GWAS and QTL locus plots are two-sided from linear regression models.

References

    1. Uffelmann, E. et al. Genome-wide association studies. Nat. Rev. Methods Primers1, 59 (2021).
    1. Minikel, E. V., Painter, J. L., Dong, C. C. & Nelson, M. R. Refining the impact of genetic evidence on clinical success. Nature629, 624–629 (2024). - PMC - PubMed
    1. Maurano, M. T. et al. Systematic localization of common disease-associated variation in regulatory DNA. Science337, 1190–1195 (2012). - PMC - PubMed
    1. Lappalainen, T., Li, Y. I., Ramachandran, S. & Gusev, A. Genetic and molecular architecture of complex traits. Cell187, 1059–1075 (2024). - PMC - PubMed
    1. Gamazon, E. R. et al. Using an atlas of gene regulation across 44 human tissues to inform complex disease- and trait-associated variation. Nat. Genet.50, 956–967 (2018). - PMC - PubMed

LinkOut - more resources