. 2025 Aug;644(8077):759-768.
doi: 10.1038/s41586-025-09098-5. Epub 2025 Jun 11.

Early life high fructose impairs microglial phagocytosis and neurodevelopment

Affiliations

Early life high fructose impairs microglial phagocytosis and neurodevelopment

Zhaoquan Wang et al. Nature. 2025 Aug.

Abstract

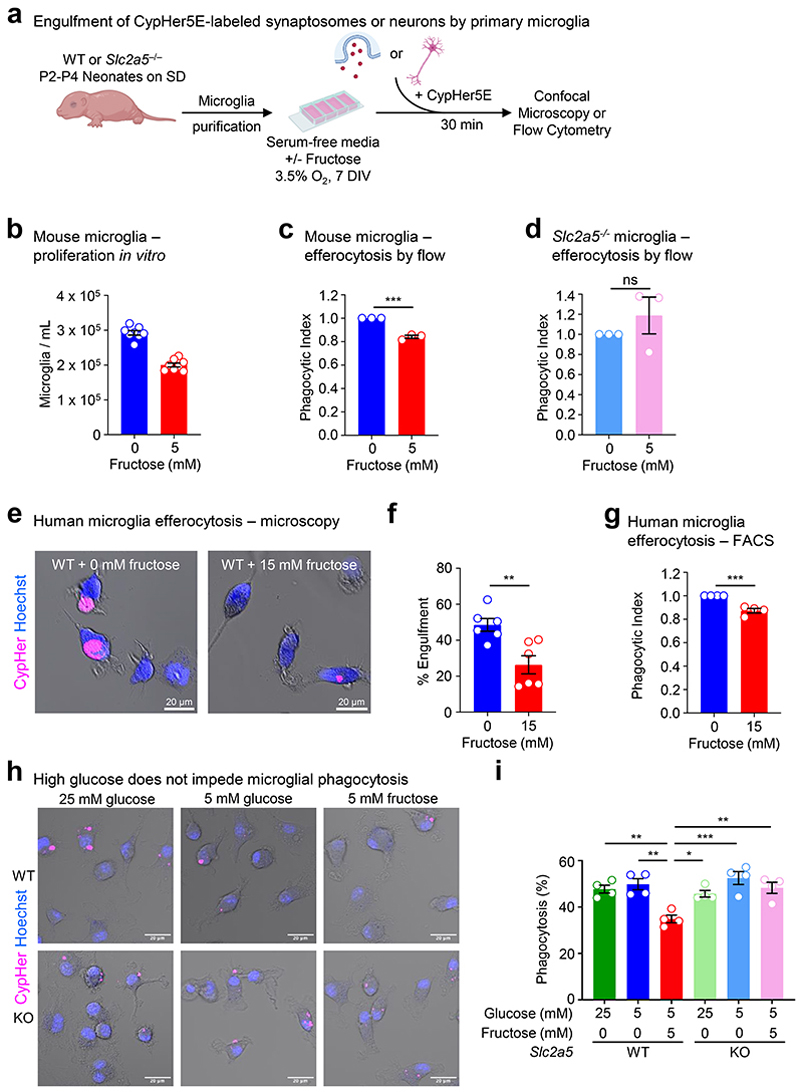
Despite the success of fructose as a low-cost food additive, epidemiological evidence suggests that high fructose consumption during pregnancy or adolescence is associated with disrupted neurodevelopment1-3. An essential step in appropriate mammalian neurodevelopment is the phagocytic elimination of newly formed neurons by microglia, the resident professional phagocyte of the central nervous system4. Whether high fructose consumption in early life affects microglial phagocytosis and whether this directly affects neurodevelopment remains unknown. Here we show that offspring born to female mice fed a high-fructose diet and neonates exposed to high fructose exhibit decreased phagocytic activity in vivo. Notably, deletion of the high-affinity fructose transporter GLUT5 (also known as SLC2A5) in neonatal microglia completely reversed microglia phagocytic dysfunction, suggesting that high fructose directly affects neonatal development by suppressing microglial phagocytosis. Mechanistically, we found that high-fructose treatment of mouse and human microglia suppresses phagocytosis capacity, which is rescued in GLUT5-deficient microglia. Additionally, we found that high fructose drives significant GLUT5-dependent fructose uptake and catabolism to fructose 6-phosphate, rewiring microglial metabolism towards a hypo-phagocytic state in part by enforcing mitochondrial localization of the enzyme hexokinase 2. Mice exposed to high fructose as neonates develop anxiety-like behaviour as adolescents-an effect that is rescued in GLUT5-deficient mice. Our findings provide a mechanistic explanation for the epidemiological observation that high-fructose exposure during early life is associated with increased prevalence of adolescent anxiety disorders.


Conflict of interest statement

Competing interests: J.S.A.P. and K.R.K. are co-founders of Atish Technologies. K.R.K. serves on the scientific advisory board of NVision Imaging Technologies. J.S.A.P. and K.R.K. hold patents related to imaging and modulation of cellular metabolism. The other authors declare no competing interests.

Figures

Extended Data Fig. 1
Extended Data Fig. 1. The effect of high fructose or glucose on neonatal microglia numbers and function in vivo.
(a-d) Intragastric delivery of fructose to neonates leads to decreased microglia numbers and increased uncleared apoptotic cells. (a) Neonatal wildtype (WT) and Slc2a5–/– (KO) mice were injected daily into the visible milk spot from P1 to P7 with fructose (45 mg per mouse) or sterile water control. Brains were then collected and analyzed by confocal microscopy (20x objective, 20 μm thick image stacks with 2 μm step-size). (b) Microglial cell count was quantified from four fields of view (FOVs) per mouse for each condition from (a) and each dot represents the mean for one mouse, with N = 7 for WT CD, N = 7 for WT HF, N = 3 for KO CD, and N = 5 for KO HF. Data are shown as mean ± SEM. Significance was determined by two-way ANOVA with Tukey’s multiple comparisons test. ns = not significant, *p < .05. Representative images (c) and (d) quantitation of uncleared (free) apoptotic cells (pyknotic nuclei) from (a), determined using Iba1 staining of microglia and Hoechst staining of nuclei. Arrows denote condensed chromatin (pyknotic nuclei) which is a hallmark indicator of apoptosis. Scale bars, 100 µm (inlay, 20 µm). Quantitation of free pyknotic nuclei in (c) is based on four FOVs per mouse and each dot represents the mean for one mouse, with N = 7 for WT CD, N = 7 for WT HF, N = 3 for KO CD, and N = 5 for KO HF. Data are shown as mean ± SEM. Significance was determined by two-way ANOVA with Tukey’s multiple comparisons test. *p < .05, **p < .01. (e) Early life dietary high glucose exposure in WT and Slc2a5-/- mice. Schematic of wildtype (WT) and Slc2a5-/- (KO) dams placed on a third isocaloric diet, 15% kcal% glucose diet (HG), for at least one week prior to pregnancy and maintained through gestation and lactation. Brains from postnatal day 7 (P7) mice were collected and analyzed using confocal microscopy. For weight measurements shown in Extended Data Fig. 4b, 8-10-week-old adults separated by sex were placed on all three isocaloric diets in Fig. 1a and here for 3 weeks and weighed daily. (f, g) Maternal high fructose diet decreases microglia density. Representative images (f) and quantitation (g) of microglia (Iba1+) numbers in the prefrontal cortex from P7 WT and KO mice exposed to CD or HF. Confocal microscopy (20x objective, 20 μm thick image stacks with 2 μm step-size) was used to obtain imaging data. Number of microglia were counted in four FOVs (fields of view) across two tissue sections per mouse for each condition in Fiji, and each dot represents the mean for one animal, with N = 11 for WT CD, N = 17 for WT HF, N = 18 for KO CD, and N = 13 for KO HF. Scale bar, 100 µm. Data are shown as mean ± SEM. Significance was determined using two-way ANOVA with Tukey’s multiple comparisons test. **p < .01, ***p < 0.001, ****p < .0001.
Extended Data Fig. 2
Extended Data Fig. 2. The effect of high fructose on neonatal microglia morphology in vivo.
(a) Schematics of microglial morphological features analyzed. Five features shown are highlighted in red. (b) High fructose diet does not affect branch number or length. Quantitation of branch number (4) and branch length (5) of microglia in the prefrontal cortex of P7 wildtype (WT) and Slc2a5–/– (KO) neonates born to dams on control diet (CD) or high fructose diet (HF) based on analysis of all cells from four fields of view (FOVs) per mouse obtained by confocal microscopy as in Fig. 1b. N = 24 for WT CD, N = 36 for WT HF, N = 32 for KO CD, and N = 20 for KO HF with n = 1056 to 1907 cells per condition. Each dot represents one cell whose morphological features were analyzed in a semi-automated process described in the Methods. Data are shown as mean ± SEM. Significance was determined by two-way ANOVA with Tukey’s multiple comparisons test. ns = not significant. (c) Maternal high fructose diet induces quiescent microglia morphology. Representative max intensity z-stack projections (left) of microglia in the prefrontal cortex from WT and KO P7 mice exposed to maternal CD or HF used to analyze microglia morphology. Quantitation of soma area (left graph), soma major axis length (middle), and soma roundness (right) from microglial morphological analysis of all cells from four FOVs per animal obtained by confocal microscopy as in Fig. 1b. N = 24 for WT CD, N = 36 for WT HF, N = 32 for KO CD, and N = 20 for KO HF with 1056 to 1907 cells per condition. Each dot represents one cell whose morphological features were analyzed in a semi-automated process described in the Methods. Data are shown as mean ± SEM. Significance was determined by two-way ANOVA with Tukey’s multiple comparisons test. ****p < .0001. Scale bar, 10 µm.
Extended Data Fig. 3
Extended Data Fig. 3. Additional assessments of microglia phagocytosis under high fructose exposure in vivo.
(a, b) High fructose diet causes accumulation of uncleared pyknotic nuclei. Representative images (a) and quantitation (b) of the prefrontal cortex from wildtype (WT) and Slc2a5–/– (KO) P7 neonates exposed to maternal CD or HF in Fig. 1b showing Iba1 staining of microglia and Hoechst staining of nuclei. Arrows denote condensed chromatin of apoptotic cells by pyknotic nuclei accumulation. Scale bars, 100 µm (inlay, 20 µm). (b) Quantitation of average number of free pyknotic nuclei in (a), from four FOVs per mouse, with each dot representing the mean for one mouse, with N = 5 for WT CD, N = 8 for WT HF, N = 10 for KO CD, and N = 8 for KO HF. Data are shown as mean ± SEM. Significance was determined by two-way ANOVA with Tukey’s multiple comparisons test. *p < .05, **p < .01, ***p < .001. (c) Distinguishing bound or internalized versus free TUNEL. Representative images of both Iba1+ microglia associated with TUNEL (bound or internalized) and free TUNEL+ puncta from experiments performed in Fig. 1. (d) High fructose diet does not significantly affect engulfment of VGLUT1 material. Representative max intensity z-projections (left) corresponding to 3D surface reconstruction performed in Fig. 1e-f using Imaris, and quantitation (right) of Iba1+ microglia (green) containing engulfed VGLUT1 puncta (white) within CD68+ phagolysosomal structures (blue), from the prefrontal cortex of P7 WT and KO mice exposed to CD or HF. Confocal microscopy (63x oil immersion objective, 20 μm thick image stacks with 0.3 μm step-size) was used to obtain imaging data for Imaris. For quantitation, engulfed VGLUT1 material (e) was normalized to Iba+ cell volume using Imaris. Data are from N=4 WT CD, N=5 WT HF, N=5 KO CD, N=5 KO HF mice with points representing individual cells (n = 21, 25, 21, and 21, respectively). Data are shown as mean ± SEM. Significance was determined using two-way ANOVA with Tukey’s multiple comparisons test. ns = not significant, *p < .05, **p < .01. Scale bar, 10μm with 4x digital zoom.
Extended Data Fig. 4
Extended Data Fig. 4. Additional analyses of microglia numbers and function at different times post-birth and brain regions.
(a) Schematic of cross-fostering experiments. Timed matings were used for cross-fostering experiments, in which litters born to WT dams on high fructose diet were switched with litters born to dams on control diet on P0. These litters were either exposed to high fructose during gestation (~3 weeks) but control diet during lactation (1 week) or were exposed to control diet during gestation but high fructose diet during lactation. (b) High fructose diet marginally increases the weight of both WT and KO mice. For weight measurements, 8–10-week-old adults separated by sex were placed on one of three isocaloric diets (CD = control diet, HG = high glucose, HF = high fructose) for 3 weeks and weighed daily, with N = 6 for WT CD, N = 7 for WT HF, N = 3 for KO CD, N = 3 for KO HF, and N = 6 for WT HG. Data are shown as mean ± SEM. Significance was determined using two-way ANOVA with Tukey’s multiple comparisons test of area under the curve (AUC) for each cohort. *p < .05, **p < .01. (c) Maternal high glucose diet does not affect the number of TUNEL+ cells. Representative images (left) and quantitation (right) of uncleared (‘free’) TUNEL+ puncta in the prefrontal cortex of P7 WT and KO mice exposed to CD or HG as shown in Extended Data Fig. 1e. Confocal microscopy (20x objective, 20 μm thick image stacks with 2 μm step-size) was used to obtain imaging data. Free and bound/internalized TUNEL+ puncta (see Extended Data Fig. 3c) were identified in four FOVs (fields of view) across two tissue sections per mouse for each condition, and each dot represents the mean for one mouse, with N = 6 mice per condition. Data are shown as mean ± SEM. Significance was determined using an unpaired t-test. ns = not significant. Scale bar, 50 μm. (d) Maternal high fructose diet decreases microglia density at postnatal day 7. Representative images (left) and quantitation (right) of Iba1+ microglia in the prefrontal cortex of P7 WT mice exposed to CD or HF, obtained before Extended Data Fig 1f which includes genetic deletion of GLUT5. Confocal microscopy (20x objective, 20 μm thick image stacks with 2 μm step-size) was used to obtain imaging data. Number of microglia were counted in four FOVs (fields of view) across two tissue sections per mouse for each condition in Fiji, and each dot represents the mean for one mouse, with N = 4 for WT CD and N = 5 for WT HF. Data are shown as mean ± SEM. Significance was determined using an unpaired t-test. ****p < .0001. Scale bar, 100 μm. (e) Maternal high fructose slightly increases microglia density at postnatal day 14. Representative images (left) and quantitation (right) of Iba1+ microglia in the prefrontal cortex of P14 WT mice exposed to CD or HF. Confocal microscopy (20x objective, 20 μm thick image stacks with 2 μm step-size) was used to obtain imaging data. Number of microglia were counted in four FOVs (fields of view) across two tissue sections per mouse for each condition in Fiji, and each dot represents the mean for one mouse, with N = 3 for WT CD and N = 4 for WT HF. Data are shown as mean ± SEM. Significance was determined using an unpaired t-test. **p < .01. Scale bar, 100 μm. (f) Maternal high fructose has no effect on microglia density at postnatal day 21. Representative images (left) and quantitation (right) of Iba1+ microglia in the prefrontal cortex of P21 WT mice exposed to CD or HF. Confocal microscopy (20x objective, 20 μm thick image stacks with 2 μm step-size) was used to obtain imaging data. Number of microglia were counted in four FOVs (fields of view) across two tissue sections per mouse for each condition in Fiji, and each dot represents the mean for one mouse, with N = 4 mice per condition. Data are shown as mean ± SEM. Significance was determined using an unpaired t-test. ns = not significant. Scale bar, 100 μm. (g) Maternal high fructose does not impact TUNEL+ cell numbers at postnatal day P14. Representative images (left) and quantitation (right) of uncleared (‘free’) TUNEL+ puncta in the prefrontal cortex of P14 WT and KO mice exposed to CD or HF. Confocal microscopy (20x objective, 20 μm thick image stacks with 2 μm step-size) was used to obtain imaging data. Free and bound/internalized TUNEL+ puncta (see Extended Data Fig. 3c) were identified in four FOVs (fields of view) across two tissue sections per mouse for each condition, and each dot represents the mean for one mouse, with N = 6 for WT CD, N = 7 for WT HF, N = 7 for KO CD, and N = 6 for KO HF. Data are shown as mean ± SEM. Significance was determined using two-way ANOVA with Tukey’s multiple comparisons test. ns = not significant. Scale bar, 25 μm. (h) Maternal high fructose does not impact TUNEL+ cell numbers in the hippocampus at postnatal day P7. Representative images (left) and quantitation (right) of uncleared (‘free’) TUNEL+ puncta in the hippocampus of P14 WT and KO mice exposed to CD or HF. Confocal microscopy (10x objective) was used to obtain images encompassing the CA1, CA2, and CA3 regions within one FOV, with free TUNEL+ puncta identified in one hippocampal region per mouse (further magnification and z-axis movement was performed as necessary for resolution purposes). Each dot represents the quantification of one mouse’s hippocampal region, with N = 4 for WT CD, N = 11 for WT HF, N = 7 for KO CD, and N = 11 for KO HF. Data are shown as mean ± SEM. Significance was determined using two-way ANOVA with Tukey’s multiple comparisons test. ns = not significant. Scale bar, 200 μm.
Extended Data Fig. 5
Extended Data Fig. 5. Secondary data analysis of mouse and human microglia RNA-seq datasets.
(a-g) Unique expression of Slc2a5 in the mouse CNS and SLC2A5 in the human CNS. Slc2a5/SLC2A5 expression plotted using data in published and publicly available mouse and human datasets from the following references (see references section for full details). (a) Immgen.org, 2020 – Slc2a5 expression in all immune cell types (left) and in macrophages and monocytes (right). (b) Zhang et al., J. Neurosci., 2014 (left) and Zhang et al., Neuron, 2016 (right) – Slc2a5/SLC2A5 expression in microglia compared to other CNS cells in mouse (left) and human (right). Data are shown as mean ± SD. (c) The Tabula Muris Consortium, Nature, 2018 – SLC2A5 expression in human microglia and non-microglia cells in the CNS. (d) Li et al., Neuron, 2019 – Slc2a5 expression in microglia at different stages. (e) Matcovitch-Natan et al., Science, 2016 (left) and Bennett et al., PNAS, 2016 (right) – Slc2a5 expression in the mouse CNS during development (left) and in TMEM119+ microglia at P7, P14, P21, and P60 (right). Data are shown as mean ± SD. (f) adapted from Han et al., Immunity, 2023 – Enhanced SLC2A5 expression in human microglia at postnatal timepoints compared to fetal timepoints. (g) Immgen.org, 2020 (left) and Saunders et al., Cell, 2018 (right) – regional expression of Slc2a5 in mouse microglia.
Extended Data Fig. 6
Extended Data Fig. 6. Evaluation of Slc2a5/SLC2A5 transcription and SLC2A5 protein levels in microglia.
(a) Absence of Slc2a5 in murine microglia confirmed by RT-qPCR. All commercially available TaqMan probes were tested using P2-P4 neonatal microglia isolated from WT and Slc2a5-/- (KO) mice. Each dot represents one mouse. Data are shown as mean ± SEM. Significance was determined using a two-tailed, unpaired t-test. ****p < .0001. (b) Coverage of murine Slc2a5 TaqMan probes spanning all 14 exons. The first four exons of Slc2a5 are deleted in Slc2a5–/– (KO) mice and exon 6 is flanked by loxP sites in Slc2a5fl/fl CSF1R-Cre (cKO) mice. Indicated probes (*) were further validated in Fig. 2a and Extended Data Fig. 6c using P2-P4 neonatal microglia isolated from WT and KO mice exposed to CD or HF. (c) High fructose exposure enhances Slc2a5 expression in neonatal microglia. Microglia from P7 wildtype (WT) and Slc2a5–/– (KO) neonates born to and nursed by dams on control diet (CD) or high fructose diet (HF) as in Fig. 1 were isolated for analysis of Slc2a5 expression via RT-qPCR using the probes Mm00600309_g1 and Mm01258575_m1, then normalized to 18s. Each dot represents one mouse (n=3 per condition). Data are shown as mean ± SEM. Significance was determined using two-way ANOVA with Tukey’s multiple comparisons test. ****p < .0001. (d) High fructose exposure enhances SLC2A5 protein levels in neonatal microglia. Experiments were performed as in (c) but microglia from 4 mice were pooled per lane and processed for analysis via western blot. Expression of SLC2A5 with GAPDH as a loading control is shown, representative of two independent experiments. For gel source data, see Supplementary Figure 1. (e) High fructose exposure enhances SLC2A5 expression in human pluripotent stem cell (PSC)-derived microglia. Human PSC-derived microglia were cultured in complete RPMI containing 10 mM glucose with either 0 mM fructose and 20 mM mannitol, 5 mM fructose and 15 mM mannitol, or 15 mM fructose and 5 mM mannitol for 6 d and were then harvested for analysis of SLC2A5 expression via RT-qPCR. Data is from three independent experiments, with expression normalized to 18s. Significance was determined using one-way ANOVA with Tukey’s multiple comparisons test. ****p < .0001.
Extended Data Fig. 7
Extended Data Fig. 7. Additional analyses of mouse and human microglia phagocytosis in vitro.
(a) Schematic of assays performed to assess microglia phagocytosis in Fig. 2b-i. Microglia were isolated from P2-P4 WT and KO mice and cultured at physiological oxygen (3.5%) in serum-free TIC media containing 5 mM glucose with either 0 mM fructose and 20 mM mannitol, 1 mM fructose and 19 mM mannitol, or 5mM fructose and 15 mM mannitol for one week. Synaptosomes or apoptotic neural cells were labeled with CypHer5E and then cultured with conditioned microglia for 30 min. Phagocytosis was subsequently analyzed via flow cytometry and/or confocal microscopy. (b) High fructose inhibits primary microglial expansion in mixed glial cultures. Mixed glial cultures were generated using dissected cortices from 2 WT P2-P4 neonates to seed each T75 flask. Cultures were grown in 20 mM glucose in the presence or absence of 5 mM fructose. Microglia yield was quantified after 18 d of culture. Each dot represents a culture (mouse), and all 8 cultures from 2 independent experiments are plotted. Data are shown as mean ± SEM. Significance was determined using a two-tailed, unpaired t-test. ****p < .0001. (c,) High fructose impairs mouse primary microglia efferocytosis. Apoptotic neural cells were generated by treating the neural cell line N2A with 0.25μM staurosporine for 12-14 h and then labeling with CypHer5E. These cells were then incubated with WT primary microglia as described in (a) at a 1:1 target:phagocyte ratio for 30 min. Microglia were collected and analyzed via flow cytometry. Data are presented as phagocytic index (percent phagocytosis in experimental microglia divided by percent phagocytosis in control microglia) and encompasses three independent experiments each with three technical replicates per condition. Data are shown as mean ± SEM. Significance was determined using a two-tailed, unpaired t-test. ***p < .001. (d) Slc2a5 deletion rescues impaired phagocytosis of apoptotic neural cells by primary microglia. Experiments were performed similarly to (c), except that primary microglia were isolated from KO mice. Data are presented as phagocytic index and includes three independent experiments with three technical replicates per condition. Data are shown as mean ± SEM. Significance was determined using a two-tailed, unpaired t-test. ns = not significant. (e, f) High fructose impedes phagocytosis of apoptotic neural cells by human PSC-derived microglia. Experiments were performed similarly to (c, d) except with hPSC-derived microglia instead of mouse microglia, and confocal microscopy was used instead of flow cytometry, and the number of hPSC-derived microglia containing CypHer5E+ apoptotic corpses were quantified in Fiji, with each dot representing one of six FOVs per condition. Data is representative of three independent experiments and are shown as mean ± SEM. Significance was determined using a two-tailed, unpaired t-test. **p < .01. Scale bar, 20 μm. (g) hPSC-derived microglia efferocytosis by flow cytometry. Experiments were performed similarly to (c, d) except with hPSC-derived microglia and flow cytometry. Data are presented as phagocytic index and includes four independent experiments with three technical replicates per condition. Data are shown as mean ± SEM. Significance was determined using a two-tailed, unpaired t-test. ***p < .001. (h, i) High glucose does not impede microglial phagocytosis. Experiments were performed similarly to Fig. 2c-i, except with an additional media condition containing high (25 mM) glucose commonly used in commercially available media formulations. Confocal microscopy and Fiji were used to quantify WT or KO microglia that engulfed CypHer5E-labeled synaptosomes under each of the three media conditions, with 4 FOVs per condition. Each dot represents one FOV, and data is representative of two independent experiments. Data are shown as mean ± SEM. Significance was determined using two-way ANOVA with Tukey’s multiple comparisons test. *p < .05, **p < .01. ***p < .001. Scale bar, 20 μm.
Extended Data Fig. 8
Extended Data Fig. 8. Analysis of ManCou14 uptake by microglia in vivo.
(a) Schematic of experiment using the GLUT5-specific fluorescent probe ManCou14. 1mM ManCou14 was obtained by diluting a 10mM stock with PBS. 200μL was injected via tail vein into 8-10-week-old WT and KO mice, and microglia were isolated 30 min later for flow cytometry. (b) Gating strategy to obtain CD45intCX3CR1+CD11b+ microglia. Gating used for both ManCou14 and efferocytosis experiments requiring flow cytometry. (c) Normal expression of CD11b and CX3CR1 by WT and KO microglia. Each dot represents one mouse from the experiment in Fig. 2c, and the gMFI is plotted for each sample, with n = 4 mice per condition. Data are shown as mean ± SEM. Significance was determined using a two-tailed, unpaired t-test. ns = not significant. (d-f) Docking analysis of fructofuranose, the cyclic structure of fructose, and ManCou14 (Mancou-Pyr). (d-e) (d) Docking diagram projection of the major binding interactions of fructofuranose with Glut5out and graphical summary of number of interactions per position in the docked site. (e) Diagram projection of the major binding interactions of ManCou14 with Glut5out and graphical summary of number of interactions per position in the docked site. (f) Overlay of fructofuranose (yellow) and ManCou14 (gray) in the binding site of GLUT5. Molecular Operating Environment (MOE) was used to perform docking and generate images. Energy-refined structures for both fructofuranose and ManCou14 were employed to generate docking poses, which were further refined using a simple scoring function. During the docking process, the GLUT5 structure was kept rigid. For the analysis in (d-f), we evaluated GLUT5 activity in microglia by using GLUT5-specific fluorescent molecular probes. We utilized coumarin conjugates of 2-amino-2,5-anhydro-D-mannitol (ManCous) as high-affinity, GLUT5-specific substrates (Begoyan et al., Chem. Commun., 2018). The fructose-like structure of 2-amino-2,5-anhydro-D-mannitol facilitates key interactions within the active site of the transporter, promoting the effective uptake of these probes. Additionally, the presence of coumarin enhances the GLUT5-ManCou binding (Ainsley et al., Chem. Commun., 2018). Variations in coumarin substitution at the C4 position supported tuning of binding affinity, resulting in analogs with over 200-fold higher affinity for GLUT5 compared to fructose (with a Km for fructose of approximately 11 mM) (Begoyan et al., Chem. Commun., 2018). As a result, ManCous competes with fructose for GLUT5 at physiological concentrations and effectively translocates through the transporter, enabling fluorescence-based monitoring of GLUT5 activity in live cells (Kannan et al., Biosensors, 2018). The ability of ManCous to bind and pass through GLUT5 was validated through previous inhibition studies using competitive and non-competitive substrates for GLUT5 and other GLUTs, as well as through modeling studies of GLUT5-probe complexes. Specifically for the probe used in our study (ManCou14), the overlaid docked structures with fructose within GLUT5 demonstrate both substrates to be positioned within the fructose-binding site, facilitating hydrogen bonding interactions with key residues essential for fructose recognition and uptake via GLUT5 (Gln288, Ser143, Ser392, Gln167) (Nomura et al., Nature, 2015). In addition to the sugar-binding site, ManCou14 interacts with His387— a residue identified as contributing to substrate selection by GLUT5 (Nomura et al., Nature, 2015). The greater number of hydrogen bonding and secondary interactions explains the high affinity of ManCou14, while interaction with specific residues supports the specific recognition by GLUT5.
Extended Data Fig. 9
Extended Data Fig. 9. Additional analyses of 13C-labeled metabolites in primary microglia in vitro.
(a) Relative abundance of indicated fructolysis metabolites. All data from (a-e) was obtained from experiments detailed in Fig. 3d and Extended Data Fig. 9 and are shown as mean ± SEM. Significance was determined using two-way ANOVA with Tukey’s multiple comparisons test. *p < .05, **p < .01, ****p < .0001. D-fructose, lactic acid, and glutamic acid (fractional enrichment far right) are shown. (b) Fractional enrichment and relative abundance of additional intermediates. Data are shown as mean ± SEM. Significance was determined using two-way ANOVA with Tukey’s multiple comparisons test. *p < .05, **p < .01, ****p < .0001. Fructose 6-phosphate (F6P), glyceraldehyde 3-phosphate (G3P), 3-phosphoglyceric acid (3-PG), phosphoenolpyruvic acid (PEP), and nicotinamide adenine dinucleotide (NAD+) are shown. (c) Relative abundance of alanine and TCA cycle intermediate downstream of fructolysis. Data are shown as mean ± SEM. Significance was determined using two-way ANOVA with Tukey’s multiple comparisons test. ns = not significant, *p < .05, **p < .01, ***p < .001, ****p < .0001. Alanine, citric acid, α-ketoglutaric acid, fumaric acid, and malic acid are shown. (d) Relative abundance of Glutathione and Oxidized Glutathione. Data are shown as mean ± SEM. (e) Relative abundance of ATP. Data are shown as mean ± SEM. Significance was determined using two-way ANOVA with Tukey’s multiple comparisons test. **p < .01, ***p < .001.
Extended Data Fig. 10
Extended Data Fig. 10. Determination of the HK2 relevance for microglia phagocytosis.
(a) Inhibition of HK2 activity rescues high fructose-induced suppression of microglia phagocytic activity. Microglia were plated and conditioned as in Fig. 2c, but with the inclusion of the HK2-specific inhibitor 3-BP. Conditioned microglia were cultured with CypHer5E-labeled apoptotic neurons for 1 h at a 0.5:1 target-to-phagocyte ratio, then isolated and analyzed for phagocytosis via flow cytometry. Shown is the phagocytic index (percent phagocytosis in experimental microglia divided by percent phagocytosis in control microglia) calculated from three independent experiments. Data are shown as mean ± SEM. Significant was calculated by two-way ANOVA with Tukey’s multiple comparisons test. **p < .01. (b) High fructose enhances HK2 expression. Microglia were treated identically to cells in (a), but pooled from multiple independent wells for western blot analysis. Data is representative of two independent experiments. For gel source data, see Supplementary Figure 1. (c, d) High fructose increases mitochondrial HK2 colocalization in a GLUT5-dependent manner. Primary microglia from WT and KO mice were cultured with 5 mM glucose or 5 mM glucose and 5 mM fructose with mannitol as a control for osmolarity. Mitotracker Red CMXRos-labeled microglia were cultured with CypHer5E-labeled apoptotic neurons at a 1:1 ratio for 30 min, then fixed and analyzed via confocal microscopy. (c) Representative images were taken using confocal microscopy (63x oil immersion objective, 7 μm thick image stacks with 0.5 μm step-size), and max-intensity z-projections were used to analyze colocalization between HK2 and Mitotracker. (d) Pearson’s coefficients were calculated in Fiji, with 1 denoting perfect colocalization and 0 denoting no colocalization. Data shown is representative of two independent experiments, with n = 37 to 40 cells per condition. Scale bar, 10μm.
Extended Data Fig. 11
Extended Data Fig. 11. Analysis of Barnes Maze results.
(a, b) Evaluation of spatial learning and memory via the modified Barnes Maze. Experiments were performed as in Fig. 4 but used to assess spatial learning and memory. (a) Schematic of experiments used to analyze spatial learning and memory using the modified Barnes Maze. After three training days during which the escape hole was placed at the same location for three trials each day, the escape hole was then moved 180° on days 4 and 5 and two trials per day were performed. (b) Each of the four cohorts were tested as outlined in (a), with the numbers of mice at N = 17 for WT CD, N = 16 for WT HF, N = 15 for KO CD, and N = 16 for KO HF. Data are shown as mean ± SEM. Significance was determined using two-way ANOVA with Tukey’s multiple comparisons test. ns = not significant.
Extended Data Fig. 12
Extended Data Fig. 12. Analysis of microglia phagocytosis in mice with myeloid-specific deletion of Slc2a5.
(a) Absence of Slc2a5 in murine microglia from conditional knockout mice confirmed by RT-qPCR. Three TaqMan probes were tested using P2-P4 neonatal microglia isolated from WT and cKO mice. Each dot represents one mouse. Data are shown as mean ± SEM. Significance was determined using a two-tailed, unpaired t-test. *p < .05. (b) Schematic of WT (cre-negative) and cKO (cre-positive) mice used in diet experiments. 8–10-week-old Cre-negative females were paired with cre-positive males, and placed on either CD or HF. For in vitro experiments, P2-P4 neonatal mice were genotyped immediately before microglia isolation to enable pooling. (c) Microglia density in WT and cKO mice. Quantitation of microglia (Iba1+) numbers in the prefrontal cortex from P7 WT and cKO mice (littermates) exposed to CD or HF. Confocal microscopy (20x objective, 20 μm thick image stacks with 2 μm step-size) was used to obtain imaging data. Number of microglia were counted in four FOVs (fields of view) across two tissue sections per mouse for each condition in Fiji, and each dot represents the mean for one animal, with N = 6 mice per condition. Data are shown as mean ± SEM. Significance was determined using two-way ANOVA with Tukey’s multiple comparisons test. ns = not significant. (d) Representative images from WT and cKO mice corresponding to quantitation of TUNEL in Fig. 5a. Scale bar, 50 μm. (e) Max intensity z-projections of cells used for Imaris 3D reconstruction in Fig. 5b. Scale bar, 10 μm. (f) High fructose diet does not significantly affect engulfment of VGLUT1 material. Quantitation of engulfed VGLUT1 material in WT and cKO cells in Fig. 5b,c, with normalization Iba+ cell volume using Imaris. Data points represent individual cells with N=8 WT CD, N=8 WT HF, N=8 cKO CD, and N=7 cKO HF mice, with points representing individual cells (n = 44, 37, 39, and 39, respectively). Data are shown as mean ± SEM. Significance was determined using two-way ANOVA with Tukey’s multiple comparisons test. ns = not significant, *p < .05. (g) Representative images of in vitro phagocytosis corresponding to Fig. 5b. Scale bar, 20 μm.
Extended Data Fig. 13
Extended Data Fig. 13. Analysis of behavior in mice with myeloid-specific deletion of Slc2a5.
(a-e) Additional NMR measurements from the brains of WT and cKO mice corresponding to Fig. 5e. Quantitation of labeled plasma lactic acid (a), brain fructose (b), brain sorbitol (c), brain glucose (d), and plasma glucose (e) are shown, with N = 4 for WT CD, N = 6 for WT HF, N = 8 for cKO CD, and N = 8 for cKO HF. Data are shown as mean ± SEM. Significance was determined using two-way ANOVA with Tukey’s multiple comparisons test. ns = not significant, **p < .01, ***p < .001. (f, g) High fructose does not alter synaptophysin+ area after fear extinction. Representative images (f) and quantitation (g) of synaptophysin+ area corresponding to Fig. 5h,i. Quantitation was performed as described in Chu et al. 2019, with each dot representing one FOV and five FOVs per mouse, with N = 5 mice per condition and 25 FOVs per mouse. Data are shown as mean ± SEM. Significance was determined using two-way ANOVA with Tukey’s multiple comparisons test. ns = not significant. Scale bar, 25 μm. (h, i) High fructose exposure enhances PSD-95+ area immediately after fear extinction experiments. Brains from juvenile mice were immediately collected after fear extinction experiments in (g). Confocal microscopy of the prefrontal cortex was performed using a 63x oil immersion objective (5μm thick image stacks with step-size of 0.5μm) and analyzed using Fiji. (h) Representative images of PSD-95+ area are shown, with representative images of synaptophysin area from the same brains are shown in Extended Data Fig. 13f. (i) Quantitation was performed as described in Chu et al. 2019, with each dot representing one FOV and five FOVs per mouse, with N = 5 mice per condition and 25 FOVs per mouse. Data are shown as mean ± SEM. Significance was determined using two-way ANOVA with Tukey’s multiple comparisons test. *p < .05, **p < .01, ****p < .0001. Scale bar, 25μm.
Fig. 1
Fig. 1. Early life high fructose exposure suppresses microglial phagocytosis in vivo.
(a) Representative images of uncleared (‘free’) TUNEL+ puncta in the prefrontal cortex (PFC) of WT and KO P7 mice exposed to CD or HF diet. Confocal microscopy (20x objective, 20 μm thick image stacks with 2μm step-size) was used to obtain imaging data. Free TUNEL+ puncta were identified in four FOVs across two tissue sections per mouse/condition. Scale bar, 50μm. (b, c) Representative images (b) and summary (c) from PFC of P7 WT and KO mice exposed to HF diet during gestation or lactation. Free TUNEL+ puncta were identified in four FOVs across two tissue sections per mouse/condition. Each data point represents the mean for one mouse, with N=5 WT CD, N=8 WT HF, N=10 KO CD, N=8 KO HF, N=4 gestation, and N=4 lactation mice. Scale bar, 50μm. (d, e) 3D surface reconstruction of confocal microscopy (d) showing representative Iba1+ microglia containing engulfed PSD-95 puncta within CD68+ phagolysosomals in PFC of P7 WT and KO mice exposed to CD or HF. Quantitation of engulfed PSD-95 material (e) was normalized to Iba+ cell volume using Imaris. Data are from N=4 WT CD, N=5 WT HF, N=5 KO CD, N=5 KO HF mice with points representing individual cells (n = 21, 25, 21, and 21, respectively). Scale bar, 10μm, 4x digital zoom. Data are shown as mean±SEM. Significance was determined using two-way ANOVA with Tukey’s post-hoc or unpaired t-test. ns = not significant, *p<.05, **p<.01, ***p<.001.
Fig. 2
Fig. 2. High fructose exposure directly suppresses microglia phagocytosis.
(a, b) Representative images (a) and quantitation (b) of microglia phagocytosis of CypHer5E-labeled synaptosomes. CypHer5E+ microglia were identified in six different FOVs per condition and the percentage for each FOV is shown. Data represents three independent experiments. Scale bar, 20μm. (c, d) Representative images (c) and quantitation (d) of hPSC-derived microglia phagocytosis of CypHer5E-labeled synaptosomes. Cypher5E+ microglia were identified in six different FOVs per condition and the percentage for each FOV is shown. Data represents three independent experiments. Scale bar, 20μm. (e, f) Representative microscopy images (h) and quantitation (i) of GLUT5-deficient microglia phagocytosis of CypHer5E-labeled synaptosomes. Cypher5E+ microglia were identified in six different FOVs per condition and the percentage for each FOV is shown. Data represents three independent experiments. Scale bar, 20μm. Data are shown as mean±SEM. Significance was determined using ordinary (f) or Brown-Forsythe and Welch’s (b, d) one-way ANOVA. ns = not significant, **p<.01, ***p<.001, ****p<.0001.
Fig. 3
Fig. 3. High fructose directly alters microglial metabolism.
(a, b) (a) Wildtype (WT) and Slc2a5–/– (KO) P7 mice born to and nursed by dams on control diet (CD) or high fructose (HF) diet, injected intraperitoneally with 4 g/kg [2-13C]-fructose, then analyzed via carbon (13C) and proton (H) NMR. (b) Quantitation of [2-13C]-fructose, [2-13C]-lactic acid, and total lactic acid pool from N=4 WT CD, N=5 WT HF, N=5 KO CD, and N=5 KO HF. Data shown as mean±SEM. Significance was determined by two-way ANOVA with Tukey’s post-hoc. ns = not significant, *p<.05, **p<.01. (C) Flow cytometry analysis of ManCou14 in 8-10-week-old WT and KO mice in non-immune cells (CD45-), non-myeloid immune cells (CD45hiCX3CR1-CD11b-), and microglia (CD45intCX3CR1+CD11b+), with N=4 mice per condition. Data shown as mean±SEM and significance was determined by Welch’s t-test. **p<.01. (D) Microglia were isolated from P2-P4 wildtype (WT) and Slc2a5–/– (KO) mice and cultured at 3.5% O2 in indicated conditions for one week, then cultured with [U-13C]-fructose for 24h and analyzed using LC-MS. Shown is the fractional enrichment of labeled lactic acid, glutamic acid, and fructose 6-phosphate (F6P). See also Extended Data Fig. 9 for additional analyses. Each dot represents a biological replicate obtained by pooling microglia purified from littermates, with a total of three biological replicates per condition. Data are shown as mean±SEM. Significance was determined by two-way ANOVA with Tukey’s post-hoc. *p<.05, **p<.01, ***p<.001.
Fig. 4
Fig. 4. Early-life high fructose exposure impairs adolescent learning and cognition.
(a, b) (a) Schematic of the novel object recognition (NOR, 2-object) task used to measure animal cognition and recognition memory. (b) Offspring from wildtype (WT) and Slc2a5–/– (KO) mice were raised by dams on control diet (CD) or high fructose (HF) diet until weaning. Weaned juveniles (age range: P26-P34) were subsequently tested as described in (a), with the numbers of mice at N=8 for WT CD, N=8 for WT HF, N=9 for KO CD, and N=8 for KO HF. Data shown as mean±SEM. Significance was determined using two-way ANOVA with Tukey’s post-hoc. *p<.05, **p<.01, ****p<.0001. (c, d) Experiments were performed as in (b) but used to assess fear extinction. (c) Schematic of experiments used to analyze fear extinction. (d) Each of the four cohorts in were tested as outlined in (c). Shown is the percentage of time mice freeze, with N=8 mice per condition. Data shown as mean±SEM. Significance was determined using two-way ANOVA with Tukey’s post-hoc on AUCs. ****p<.0001.
Fig. 5
Fig. 5. High fructose-dependent deficits in microglia function are cell-intrinsic
(a) Quantitation of uncleared (free) TUNEL+ puncta in the prefrontal cortex (PFC) of P7 wildtype (WT) or CSF1RCre x Slc2a5fl/fl (cKO) mice exposed to CD or HF. Data are from four FOVs across two tissue sections per mouse/condition. Each point represents the mean for one mouse, with N=6 mice per condition. (b, c) 3D reconstruction (b) and quantitation (c) of representative Iba1+ microglia containing PSD-95 puncta within CD68+ phagolysosomes in the PFC of P7 WT and cKO mice exposed to CD or HF. Data points represent individual cells with N=8 WT CD, N=8 WT HF, N=8 cKO CD, and N=7 cKO HF mice, with points representing individual cells (n = 44, 37, 39, and 39, respectively). Scale bar, 10μm with 4x digital zoom. (d) Analysis of WT and cKO microglia phagocytosis as in Fig. 2d. Data represents three independent experiments (four FOVs per condition). (e) Quantitation of [2-13C]-lactic acid in brains of WT and cKO P7 mice as in Fig. 3a, with N=4 WT CD, N=6 WT HF, N=8 for KO CD, and N=8 KO HF mice. (f) WT and cKO mice were tested for novel object recognition as in Fig. 4a, with N=10 WT CD, N=7 WT HF, N=10 cKO CD, and N=6 cKO HF mice. (g) Adolescent WT and cKO mice were tested for fear extinction as in Fig. 4e, with N=9 WT CD, N=10 WT HF, N=10 cKO CD, and N=8 cKO HF mice. Data are shown as mean±SEM. Significance was determined using two-way ANOVA with Tukey’s post-hoc. For (g), statistical analysis was performed on AUCs. *p<.05, **p<.01, ***p<.001.

References

    1. Gillespie KM, Kemps E, White MJ, Bartlett SE. The Impact of Free Sugar on Human Health-A Narrative Review. Nutrients. 2023;15 doi: 10.3390/nu15040889. - DOI - PMC - PubMed
    1. Aucoin M, et al. Diet and Anxiety: A Scoping Review. Nutrients. 2021;13 doi: 10.3390/nu13124418. - DOI - PMC - PubMed
    1. Jacques A, et al. The impact of sugar consumption on stress driven, emotional and addictive behaviors. Neuroscience and biobehavioral reviews. 2019;103:178–199. - PubMed
    1. Prinz M, Jung S, Priller J. Microglia Biology: One Century of Evolving Concepts. Cell. 2019;179:292–311. - PubMed
    1. Jung S, Bae H, Song WS, Jang C. Dietary Fructose and Fructose-Induced Pathologies. Annual review of nutrition. 2022;42:45–66. doi: 10.1146/annurev-nutr-062220-025831. - DOI - PMC - PubMed

Additional Refernces (cited only in “Methods”)

    1. Goncalves MD, et al. High-fructose corn syrup enhances intestinal tumor growth in mice. Science. 2019;363:1345–1349. doi: 10.1126/science.aat8515. - DOI - PMC - PubMed
    1. Monsorno K, et al. Loss of microglial MCT4 leads to defective synaptic pruning and anxiety-like behavior in mice. Nature Communications. 2023;14:5749. doi: 10.1038/s41467-023-41502-4. - DOI - PMC - PubMed
    1. Schafer DP, Lehrman EK, Heller CT, Stevens B. An engulfment assay: a protocol to assess interactions between CNS phagocytes and neurons. Journal of visualized experiments : JoVE. 2014 doi: 10.3791/51482. - DOI - PMC - PubMed
    1. Davis BM, Salinas-Navarro M, Cordeiro MF, Moons L, De Groef L. Characterizing microglia activation: a spatial statistics approach to maximize information extraction. Sci Rep. 2017;7:1576. doi: 10.1038/s41598-017-01747-8. - DOI - PMC - PubMed
    1. Young K, Morrison H. Quantifying Microglia Morphology from Photomicrographs of Immunohistochemistry Prepared Tissue Using ImageJ. Journal of visualized experiments : JoVE. 2018 doi: 10.3791/57648. - DOI - PMC - PubMed

MeSH terms

LinkOut - more resources