. 2025 Jul;643(8073):1066-1075.
doi: 10.1038/s41586-025-09148-y. Epub 2025 Jun 11.

Developmental trajectory and evolutionary origin of thymic mimetic cells

Affiliations

Developmental trajectory and evolutionary origin of thymic mimetic cells

Anja Nusser et al. Nature. 2025 Jul.

Abstract

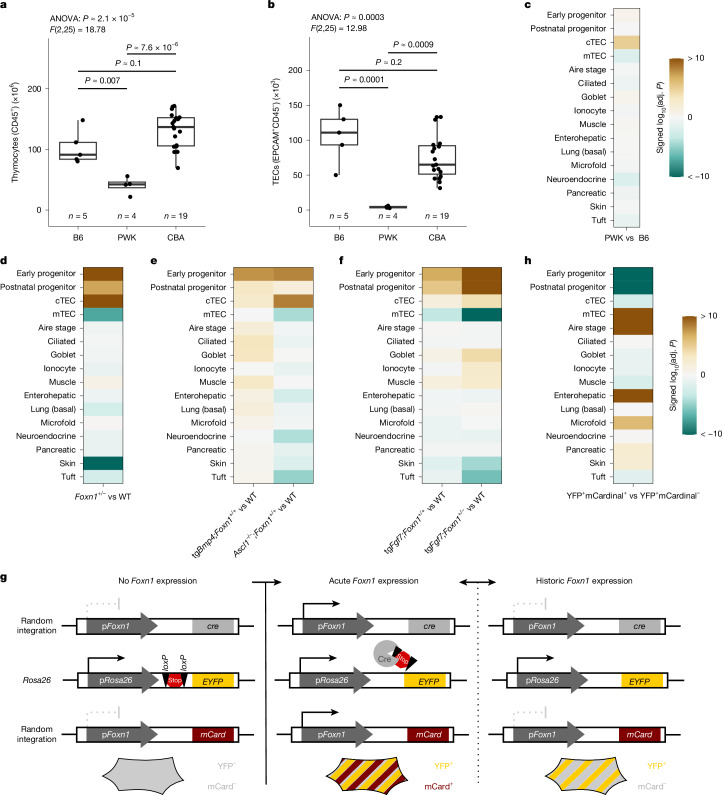
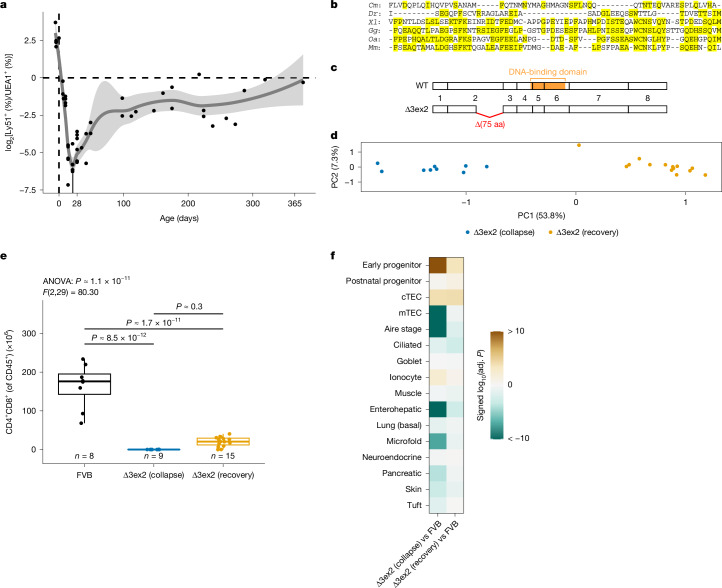
The generation of self-tolerant repertoires of T cells depends on the expression of peripheral self antigens in the thymic epithelium1 and the presence of small populations of cells that mimic the diverse phenotypes of peripheral tissues2-7. Whereas the molecular underpinnings of self-antigen expression have been extensively studied8, the developmental origins and differentiation pathways of thymic mimetic cells remain to be identified. Moreover, the histological identification of myoid and other peripheral cell types as components of the thymic microenvironment of many vertebrate species9 raises questions regarding the evolutionary origin of this unique tolerance mechanism. Here we show that during mouse development, mimetic cells appear in the microenvironment in two successive waves. Cells that exhibit transcriptional signatures characteristic of muscle, ionocyte, goblet and ciliated cells emerge before birth, whereas others, such as those that mimic enterohepatic cells and skin keratinocytes, appear postnatally. These two groups also respond differently to modulations of thymic epithelial cell progenitor pools caused by deletions of Foxn1 and Ascl1, expression of a hypomorphic variant of the transcription factor FOXN1, and overexpression of the signalling molecules BMP4 and FGF7. Differences in mimetic cell populations were also observed in thymic microenvironments reconstructed by replacement of mouse Foxn1 with evolutionarily ancient Foxn1/4 gene family members, including the Foxn4 gene of the cephalochordate amphioxus and the Foxn4 and Foxn1 genes of a cartilaginous fish. Whereas some cell types, such as ciliated cells, develop in the thymus in the absence of FOXN1, mimetic cells that appear postnatally, such as enterohepatic cells, require the activity of the vertebrate-specific transcription factor FOXN1. The thymus of cartilaginous fishes and the thymoid of lampreys, a representative of jawless vertebrates, which exhibit an alternative adaptive immune system10, also harbour cells that express genes encoding peripheral tissue components such as the liver-specific protein transthyretin. Our findings suggest an evolutionary model of successive changes of thymic epithelial genetic networks enabling the coordinated contribution of peripheral antigen expression and mimetic cell formation to achieve central tolerance for vertebrate-specific innovations of tissues such as the liver11,12.


Conflict of interest statement

Competing interests: The authors declare no competing interests.

Figures

Fig. 1
Fig. 1. Development of mouse thymic mimetic cells.
Enrichment of canonical TEC and mimetic signatures in bulk RNA-seq data of purified TECs from E15.5 (n = 4) and P1 (n = 2) time points compared with the P28 (n = 3) time point. a, Visualization of changes in gene expression between conditions. Each line represents a gene of the indicated signature, and its position on the x axis shows the value of the t-statistic derived from differential expression analysis. Numeric values listed in the left column represent log10(adjusted P) from enrichment analysis with camera. Log-transformed P values of upregulated sets were multiplied by −1 so that positive values indicate upwards directionality and negative values indicate downwards directionality. b, Log-transformed and signed P values from camera (two-sided, Benjamini–Hochberg adjusted) as shown in a, represented as a heat map. Values beyond the limits of the colour scale were rounded to the nearest limit. Adj., adjusted. c, Overall Foxn1 expression levels (log2 of counts per 10,000 reads (CP10K)) in Aire-stage cells and mimetic cells from scRNA-seq data (n = 4 mice; age, P28). The proportion of cells with detectable Foxn1 is indicated; P = 1.2 × 10−33 (two-sided binomial test, Benjamini–Hochberg adjusted). d, Proportion of cells with detectable CRISPR–Cas9-induced barcodes at the Hprt locus for each signature. n indicates total number of cells, pooled from three mice at P28. Data are mean ± 95% confidence interval of proportions (Wilson/Brown method); P values are derived via likelihood ratio test between logistic regressions with or without ‘signature’ as a predictor. Source data
Fig. 2
Fig. 2. Malleability of mimetic cell populations.
Thymic cellularity of C57BL/6 (B6), PWK and CBA strains at P28. a, Absolute numbers of CD45+ thymocytes. b, Absolute numbers of EPCAM+CD45 TECs. a,b, n is indicated in panels; each data point represents one thymus explant from one animal. P values between groups were derived from pairwise two-sided t-tests with Bonferroni correction after significant (P < 0.05) ANOVA. Boxes encapsulate the first to third quartile, the line indicates the median and whiskers extend to the furthest point with a distance of up to 1.5 times the interquartile range from the boxes. cf,h, Signature enrichment of canonical TEC and mimetic signatures in bulk RNA-seq data of purified TECs for PWK versus C57BL/6 (c), Foxn1+/– versus wild type (WT) (d), tgBmp4;Foxn1+/+ and Ascl1–/–;Foxn1+/+ versus wild type (e), tgFgf7;Foxn1+/+ and tgFgf7;Foxn1+/− versus wild type (f) and YFP+mCardinal+ versus YFP+mCardinal (h). Wild-type PWK, n = 4; wild-type C57BL/6, n = 3; Foxn1+/−, n = 4; tgBmp4;Foxn1+/+, n = 3; Ascl1−/−, n = 3; tgFgf7;Foxn1+/+, n = 3; tgFgf7;Foxn1−/−, n = 3; YFP+mCardinal+, n = 2; YFP+mCardinal, n = 2. ch, Values beyond the limits of the colour scale were rounded to the nearest limit. Adj., adjusted. g, Schematic illustrating the principle of the YFP/mCardinal dual reporter system. Activity of the Foxn1 promoter at any time point during development results in Cre recombinase expression and permanent activation of YFP expression. Acute activity of the Foxn1 promoter is assessed by the mCardinal (mCard) reporter. Source data
Fig. 3
Fig. 3. FOXN1 influences the development of mimetic cells.
a, Ratio of Ly51+ (cTEC) and UEA1+ (mTEC) EPCAM+CD45 TECs cells over developmental time. Each point shows the ratio from one thymus. The trend line was determined via LOESS with tenfold cross-validation. The minimum occurs at P21. Error bands show 95% confidence interval around the predicted trend line. b, Multiple sequence alignment of the C-terminal end of FOXN1 protein sequences encoded by exon 2 of the gene in various jawed vertebrate species; identical amino acid residues are shaded. Cm, Callorhinchus milii; Dr, Danio rerio; Xl, Xenopus laevis; Gg, Gallus gallus; Oa, Ornithorhynchus anatinus; Mm, Mus musculus. Sequences obtained from ref. . c, Schematic illustrating the coding content of Foxn1 exons and the deleted 3′ region of Foxn1 coding exon 2 in the Δ3ex2 mutant; three exons contribute to the DNA-binding domain as indicated. d, Principal component analysis of bulk RNA-seq samples from purified TECs of Δ3ex2 mutants, collected from mice around P21. e, Numbers of CD4/CD8-double positive thymocytes in thymi of wild-type FVB mice and Δ3ex2 mutants during collapse and recovery phases. n is indicated; each data point is one thymus explant from one animal. P values between groups were derived from pairwise two-sided t-tests with Bonferroni correction after significant (P < 0.05) ANOVA result. Boxes encapsulate the first to third quartile, the line indicates the median and whiskers extend to the furthest point with a distance of up to 1.5 times the interquartile range from the boxes. f, Signature enrichment analysis in bulk RNA-seq data of purified TECs in Δ3ex2 mice (FVB (wild type), n = 6; collapse, n = 9; recovery, n = 15). P values from camera (two-sided, Benjamini–Hochberg adjusted) were log-transformed and multiplied by −1 for upregulated sets, so that positive values indicate upwards directionality and negative values indicate downwards directionality. Values beyond the limits of the colour scale were rounded to the nearest limit. Adj., adjusted. Source data
Fig. 4
Fig. 4. Requirement of Foxn1 for mimetic cell development.
a, Signature enrichment analysis in bulk RNA-seq data of purified TECs of Foxn1−/− mutants compared with wild-type controls (wild type, n = 3; Foxn1−/−, n = 4). P values from camera (two-sided, Benjamini–Hochberg adjusted) were log-transformed and multiplied by −1 for upregulated sets, so that positive values indicate upwards directionality, and negative values indicate downwards directionality. Values beyond the limits of the colour scale were rounded to the nearest limit. Adj., adjusted. b, Micrographs of thymic rudiments in Foxn1−/− mice after RNA ISH with the indicated probes; top and bottom rows depict consecutive sections. Cells expressing the indicated genes are labelled in blue. Data representative of five mice. Scale bars, 0.1 mm. c, Characterization of the ciliated and tuft cell clusters (see Extended Data Fig. 9c). Each dot represents a cell, with the genotype of origin indicated by colour (left). Expression levels of Foxj1 (middle) and Pou2f3 (right) are provided as log2-normalized counts. d, Contributions of individual samples to the indicated clusters; genotypes are coloured and replicates are identified by different shades. Source data
Fig. 5
Fig. 5. Evolutionary trajectory of mimetic cells.
a, Macroscopic view of the gill basket of a juvenile S. canicula specimen; gc, gill chamber; sc, spinal chord; H&E, haematoxylin and eosin. b, Higher magnification of the thymus region in a, showing the cortical (c) and medullary (m) structures of the thymus. Images in a,b are representative of n = 3 animals. c, Micrographs of the shark thymus after RNA ISH with FOXN1 (blue). d,e, Micrographs of the shark thymus after RNA ISH with TTR (d) and FOXI1 (e). Images on the right show the medullary regions at higher magnification. ce, Images are representative of n = 2 animals. f, Signature enrichment analysis of mouse Foxn1−/− mutants expressing ancient Foxn1 and Foxn4 genes under the control of the mouse Foxn1 promoter compared against corresponding wild-type controls. tgFoxn4Cm, Foxn4 gene from the cartilaginous fish C. milii (n = 4); tgFoxn1Cm, Foxn1 gene from C. milii (n = 3); tgFoxn1Cm;tgFoxn4Cm (double-transgenic mice, n = 5); wild type, n = 3. The last column represents a comparison of TECs from the two single-transgenic strains. g, Signature enrichment analysis in bulk RNA-seq of whole thymi from foxn1−/− zebrafish (n = 3) compared with foxn1+/+ wild types (n = 3). h, Signature enrichment analysis of mouse Foxn1−/− mutants expressing the Foxn4 gene from the cephalochordate B. lanceolatum (n = 4); wild type, n = 3. i, Left, micrograph depicting a gill filament of Lampetra planeri (H&E staining). thy, thymoid; sl, secondary lamellae. Right, further magnified view of the thymoid, indicating the tissue heterogeneity (H&E staining); the blood vessel is filled with nucleated erythrocytes. Image representative of n = 20 animals. jl, Micrographs of thymoids after RNA ISH with probes specific for CDA1 (j), TTR (k) and MYHC1 (l). Rows depict consecutive sections; images are representative of n = 3 animals. Scale bars: 0.1 mm (a); 0.2 mm (be); 0.1 mm (il). Source data
Extended Data Fig. 1
Extended Data Fig. 1. Identification of mimetic cells in scRNAseq data.
a, All cells were scored for all listed signatures, resulting in one area under the curve (AUC) per cell and signature. The resulting histogram of AUCs for each signature is shown. Red lines indicate chosen AUC thresholds. Cell numbers indicate cells above the threshold value, whereas assigned cells refers to final assignments after resolution of ambiguities. b, Jaccard index for sets of cells meeting the threshold for each pair of signatures. In our data set, skin (basal)/skin (keratinized) and tuft1/tuft2 led to the identification of an overlapping set of cells. Thus, they were collapsed into skin and tuft populations, respectively. c, UMAPs of scRNAseq data. Data and overall population labels (colored) were reported previously. The counts for each mimetic population are given per panel, and corresponding cells are highlighted in black. d, Overall Aire and Fezf2 expression levels (log2 of counts per 10,000 reads) in Aire-stage and mimetic cells from scRNAseq data (n = 4 mice; P28). The proportions of cells with detectable gene expression is indicated. p(Aire) = 3.6 × 10−56; p(Fezf2) = 2.8 × 10⁻⁵ (two-sided binomial test, Benjamini-Hochberg adjusted). e, Results of differential abundance analysis with scCODA. Population log2 fold changes are indicated. Gray boxes indicate no detectable change. The “unassigned” population was used as the reference population. Source data
Extended Data Fig. 2
Extended Data Fig. 2. Expression patterns of TEC-specific genes in the mouse thymus.
a, Micrographs of P0 thymus sections hybridized with the indicated probes. b, c, Higher magnification views of the Myog hybridization pattern at P0 (b) and P28 (c). d, Enumeration of Myog-positive cells in thymus sections of P0 (n = 6) and P28 (n = 7) mice. Each data point represents a different thymus section. Data are shown as mean ± SD; p = 1.5 × 10⁻⁶, two-sided t test. Results in a-d are representative of n = 2 mice of each time point with similar results. e, RNA in situ hybridization of consecutive sections of Foxn1+/+ thymi at P28, hybridized with probes specific for Foxn1 (pan TEC marker) and Hnf4a, a marker of the enterohepatic mimetic lineage. The relevant tissue compartments are indicated (sc, subcapsular region; c, cortex; m, medulla). Note that the Hnf4a signal is confined to the medullary region. f, Higher magnification views of the medullary regions of P28 thymi hybridized with the indicated probes. Results in e, f are representative of n = 3 mice with similar results. Scale bars: a, 0.2 mm; b, c, e, f, 0.1 mm. Source data
Extended Data Fig. 3
Extended Data Fig. 3. Foxn1 expression levels in TEC populations.
a, b, Expression levels in canonical TEC populations (a), and Aire-stage and mimetic populations (b); data combined from 4 mice (P28). The proportions of cells with detectable Foxn1 are indicated. c, Sampling probabilities of individual informative CRISPR/Cas9-induced barcodes for the indicated populations and time points, calculated as described previously. A barcode was deemed informative if p ≤ 0.05 for any population. Source data
Extended Data Fig. 4
Extended Data Fig. 4. Characterization of TEC populations in the P28 mouse thymus by RNA in situ hybridization.
a, Hybridization patterns obtained from hybridization with the indicated probes. Note the strong signals for Foxn1 in the subcapsular and medullary regions; the Igfbp5- and Aire-expressing cells are located in medullary areas. Scale bar, 0.2 mm. Panels are representative of n = 3 mice with similar results. b, Enumeration of Igfbp5- and Aire-expressing cells in the thymic medulla. Each data point represents a different section; the data from the two thymic lobes of one mouse were combined; results are representative of n = 2 mice. The data for the left pair of Aire/Igfbp5 columns (both, n = 39) were determined using a Cy5-labeled Aire probe and a digoxigenin-labelled Igfbp5 probe revealed by chromogenic detection; the data for the right pair of Aire/Igfbp5 columns (both, n = 24) were determined using a Cy5-labeled Aire probe and a Cy3-labelled Igfbp5 probe. Data are shown as mean ± SD; p(left pair)=0.0038; p(right pair)=0.0062; two-tailed t test with Welch correction. c, Double hybridization patterns for the indicated probe combinations. The dark signals emanate from digoxigenin-labelled probes; the yellow signals emanate from Cy5-labelled probes. The panels are representative of n = 5 sections each; similar results were obtained for n = 2 mice. Scale bar, 0.1 mm. Source data
Extended Data Fig. 5
Extended Data Fig. 5. Fate trajectories of mouse TECs.
a, Population labels from overlaid on the UMAP embedding obtained after integration of data from embryonic, newborn and 4 week old mice. b, Diffusion pseudotime overlaid on the integrated UMAP. The starting cell, an early progenitor from the embryo, is highlighted in red. c, Location of cells comprising macrostates identified by CellRank which were assigned as terminal states. These macrostates were considered for calculation of fate probabilities. d, Jaccard indices of sets of cells for pairs of fates. The set of cells for each fate comprises cells meeting the fate probability threshold of 0.1. Source data
Extended Data Fig. 6
Extended Data Fig. 6. Characterization of thymic populations in CBA and PWK mice, CBAxPWK F1 hybrids, and two reciprocal backcrosses (F2).
a, Absolute number of CD45+ haematopietic cells. b, Absolute numbers of CD4/CD8-double positive thymocytes. c, Absolute numbers of EpCAM+CD45 TECs. d, Thymopoietic index, calculated as the ratio of CD4/CD8-double positive thymocytes and TECs. e, Absolute numbers of EpCAM+CD45 Ly51+UEA1 cTECs. f, Absolute numbers of EpCAM+CD45 Ly51UEA1+ mTECs. a-f, n as indicated in the panels, each data point shows one thymus explant from one animal. p values between groups were derived from pairwise two-sided t tests with Bonferroni correction after significant (p < 0.05) ANOVA result. Boxplots encapsulate the first to third quartile, a line indicates the median. Whiskers extend to the furthest point with a distance of up to 1.5 times the interquartile range from the boxes. Source data
Extended Data Fig. 7
Extended Data Fig. 7. Comparison of canonical TEC and mimetic signatures in bulk RNAseq data.
Visualization of expression changes between a, PWK and C57BL/6 mouse strains, b, Foxn1+/− and Foxn1+/+ strains, c, between Foxn1:Bmp4 transgenic and nontransgenic mice (left panel)), and between TEC-specific Ascl1-deficient (Ascl1fl/fl; Foxn1:Cre) and control (Ascl1+/+; Foxn1:Cre) mice (right panel). In a, b, c, and e, f, each line represents a gene of the indicated signature and its position on the x axis shows the value of the t statistic derived from differential expression analysis. Numeric values listed in the left column represent log10(adj. p) from enrichment analysis with camera. Log transformed p values of upregulated sets were multiplied with −1 so that positive values indicate upwards directionality, and negative values indicate downwards directionality, respectively. d, Expression pattern of the indicated genes visualized on the UMAP of purified TECs at P28 (see Extended Data Fig. 1c). e, Visualization of expression changes between Foxn1+/+;Foxn1:Fgf7 and Foxn1+/+ (left panel), and Foxn1+/−;Foxn1:Fgf7 and Foxn1+/+ (right panel). f, Expression changes and enrichment of TEC signatures from bulk RNAseq of purified mCardinal-positive and mCardinal-negative populations. Source data
Extended Data Fig. 8
Extended Data Fig. 8. Characterization of thymic cellularity stratified according to total transcriptome of purified TECs.
a, Percentage of indicated haematopoietic cell types among thymocytes in non-transgenic control mice (FVB) and two groups of transgenic Foxn1:Foxn1Δ3ex2; Foxn1−/− mice assigned to the collapse and recovery phases. n as indicated in the panels, each data point shows one thymus explant from one animal. p values between groups were derived from pairwise two-sided t tests with Bonferroni correction after significant (p < 0.05) ANOVA result. Boxplots encapsulate the first to third quartile, a line indicates the median. Whiskers extend to the furthest point with a distance of up to 1.5 times the interquartile range from the boxes. b, Visualization of expression changes between Foxn1:Foxn1Δ3ex2; Foxn1−/− mice and non-transgenic wildtype mice stratified into collapse (left panel) and recovery phases (right panels). Each line represents a gene of the indicated signature and its position on the x axis shows the value of the t statistic derived from differential expression analysis. Numeric values listed in the left column represent log10(adj. p) from enrichment analysis with camera. Log transformed p values of upregulated sets were multiplied with −1 so that positive values indicate upwards directionality, and negative values indicate downwards directionality, respectively. Source data
Extended Data Fig. 9
Extended Data Fig. 9. Characterization of the Foxn1-deficient thymic rudiment.
a, Visualization of expression changes between Foxn1−/− mice and non-transgenic wildtype mice. Each line represents a gene of the indicated signature and its position on the x axis shows the value of the t statistic derived from differential expression analysis. Numeric values listed in the left column represent log10(adj. p) from enrichment analysis with camera. Log transformed p values of upregulated sets were multiplied with −1 so that positive values indicate upwards directionality, and negative values indicate downwards directionality, respectively. b, RNA in situ hybridization of consecutive sections developed with the pharyngeal marker gene Pax9 and the TEC-specific marker gene Foxn1 at P14. Note that some patches of the Pax9-positive epithelium lack Foxn1 expression, indicating cellular heterogeneity of the Foxn1−/− epithelium; scale bars, 0.1 mm. Representative for n = 4 mice with similar results. c, snRNAseq data from nuclei of thymus tissue from Foxn1+/− (n = 3) and Foxn1−/− (n = 6 mice, pooled in n = 3 samples of two animals each). UMAP of all nuclei after data processing, clustering and annotation. Broad cluster identities are labelled. d, Zoomed in view on the ionocyte cluster from c; each dot represents a cell, with the genotype of origin indicated by colour (left panel). Expression levels for Foxi1 (right panel). Expression values are log2(normalized counts). e, Contributions of individual samples to clusters from d. Genotypes are coloured and replicates are are identified by different colour hues. f, Signature scores (AUCs) for the indicated mimetic cell signatures in the UMAP of c. Source data
Extended Data Fig. 10
Extended Data Fig. 10. Analysis of thymopoiesis in cartilaginous fishes.
a, Expressed genes in the thymus of the brown-banded bamboo shark (C. punctatum); minus-RT control reactions (–) are shown in parallel; size markers are given in base pairs (bp). For gel source data, see Supplementary Fig. 8. b, Characterization of the thymus in S. canicula. Micrographs of the thymus after RNA in situ hybridization with the indicated probes. Cells expressing the indicated genes turn blue. c, Micrograph of the thymus region. Haematoxylin-eosin staining of histological section is shown on the left; micrographs of the thymus after RNA in situ hybridization with the indicated probes are shown in the other panels. d, Thymus tissue section stained with alcian blue to identify mucus-producing cells, highlighted in the inset. For a-d, results are representative of n = 2 animals with similar results. e, Signature enrichment analysis of mouse Foxn1−/− mutants expressing the C. milii Foxn1 and Foxn4 genes under the control of the mouse Foxn1 promotor compared against corresponding wildtype controls. Log transformed p values of upregulated sets were multiplied with −1 so that positive values indicate upwards directionality, and negative values indicate downwards directionality, respectively. Scale bars in b, c represent 0.2 mm; for d, 0.05 mm. Source data
Extended Data Fig. 11
Extended Data Fig. 11. Evolutionary aspects of mimetic cell development.
a, Expression changes in thymi of foxn1−/− zebrafish compared to foxn1+/+ controls. Log transformed p values of upregulated sets were multiplied with –1 so that positive values indicate upward directionality, and negative values indicate downwards directionality, respectively. b, RT-PCR analysis of indicated genes in zebrafish foxn1+/+ and foxn1−/− thymic tissues. Representative results for n = 6 animals of each genotype with similar results. Size markers are given in base pairs (bp). For gel source data, see Supplementary Fig. 8. c, Expression changes in mouse TECs expressing the Foxn4 gene from the cephalochordate B. lanceolatum (Bl). d, Evolutionary emergence of tolerogenic factors. Sequence information for representative members of the Aire and Fezf2 genes can be found in the following Genbank accession numbers. Aire: ADZ48462 (Mus musculus); XP_043558858 (Chiloscyllium plagiosum). Fezf1: XP_006505238 (Mus musculus); XP_043564758 (Chiloscyllium plagiosum); XP_032819022 (Fezf1-like, Petromyzon marinus); XP_061423322 (Fezf1-like, Lenthenteron reissneri); XP_039251141 (Fezf1-like, Styela clava); HM245959 (Fezf1-like, Branchiostoma lanceolatum). Fezf2: XP_030103750 (Mus musculus); XP_043564156 (Chiloscyllium plagiosum); XP_032822733 (Fezf2-like, Petromyzon marinus); XP_061407634(Fezf2-like, Lethenteron reissneri). Source data

References

    1. Derbinski, J., Schulte, A., Kyewski, B. & Klein, L. Promiscuous gene expression in medullary thymic epithelial cells mirrors the peripheral self. Nat. Immunol.2, 1032–1039 (2001). - PubMed
    1. Michelson, D. A., Hase, K., Kaisho, T., Benoist, C. & Mathis, D. Thymic epithelial cells co-opt lineage-defining transcription factors to eliminate autoreactive T cells. Cell185, 2542–2558 (2022). - PMC - PubMed
    1. Sin, J. H. et al. Ikaros is a principal regulator of Aire+ mTEC homeostasis, thymic mimetic cell diversity, and central tolerance. Sci. Immunol.8, eabq3109 (2023). - PMC - PubMed
    1. Ushio, A. et al. Functionally diverse thymic medullary epithelial cells interplay to direct central tolerance. Cell Rep.43, 114072 (2024). - PMC - PubMed
    1. Michelson, D. A., Zuo, C., Verzi, M., Benoist, C. & Mathis, D. Hnf4 activates mimetic-cell enhancers to recapitulate gut and liver development within the thymus. J. Exp. Med.220, e20230461 (2023). - PMC - PubMed

MeSH terms

Substances

LinkOut - more resources