. 2025 Jun;642(8069):934-940.
doi: 10.1038/s41586-025-09105-9. Epub 2025 Jun 11.

Attosecond inner-shell lasing at ångström wavelengths

Affiliations

Attosecond inner-shell lasing at ångström wavelengths

Thomas M Linker et al. Nature. 2025 Jun.

Abstract

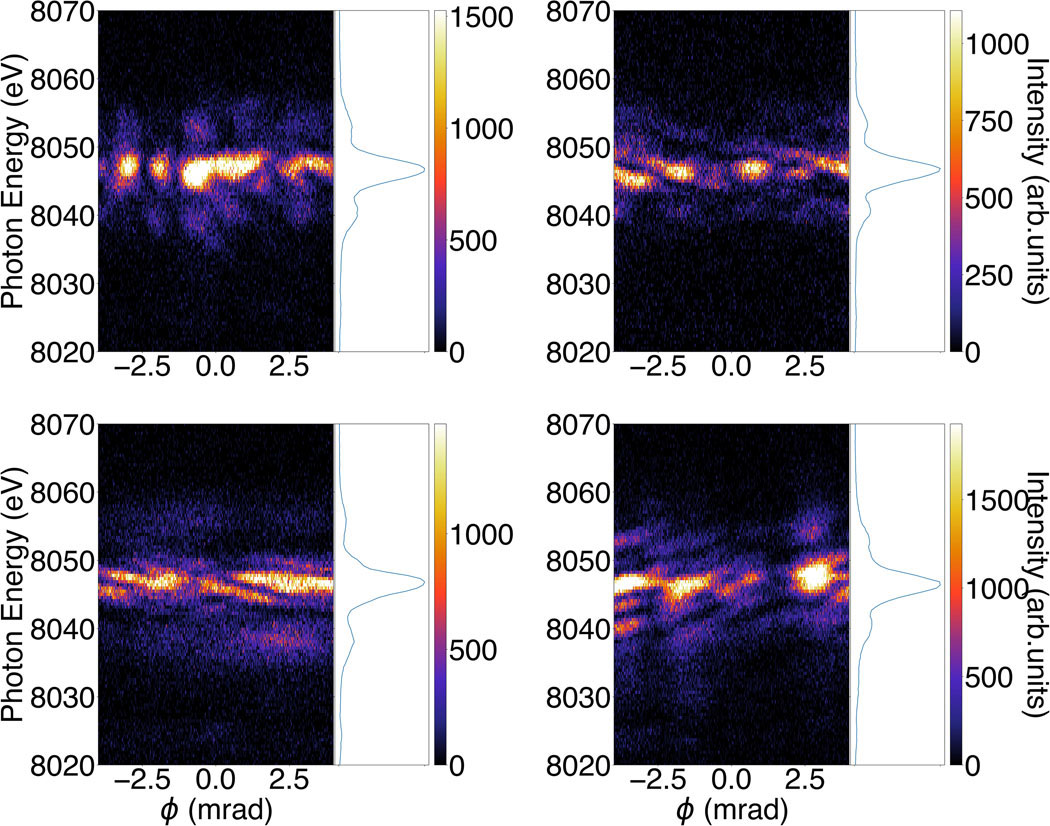
Since the invention of the laser, nonlinear effects such as filamentation1, Rabi cycling2,3 and collective emission4 have been explored in the optical regime, leading to a wide range of scientific and industrial applications5-8. X-ray free-electron lasers (XFELs) have extended many optical techniques to X-rays for their advantages of ångström-scale spatial resolution and elemental specificity9. An example is XFEL-driven inner-shell Kα1 (2p3/2 → 1s1/2) X-ray lasing in elements ranging from neon to copper, which has been used for nonlinear spectroscopy and development of new X-ray laser sources10-16. Here we show that strong lasing effects similar to those in the optical regime can occur at 1.5-2.1 Å wavelengths during high-intensity (>1019 W cm-2) XFEL-driven Kα1 lasing of copper and manganese. Depending on the temporal XFEL pump pulse substructure, the resulting X-ray pulses (about 106-108 photons) can exhibit strong spatial inhomogeneities and spectral splitting, inhomogeneities and broadening. Three-dimensional Maxwell-Bloch calculations17 show that the observed spatial inhomogeneities result from X-ray filamentation and that the broad spectral features are driven by sub-femtosecond Rabi cycling. Our simulations indicate that these X-ray pulses can have pulse lengths of less than 100 attoseconds and coherence properties that provide opportunities for quantum X-ray optics applications.


Conflict of interest statement

Competing interests: The authors declare no competing interests.

Figures

Extended Data Fig. 1 |
Extended Data Fig. 1 |. Filamentation in different samples.
Examples of filamentation taken at LCLS for different MnCl2 and Mn metal foils.
Extended Data Fig. 2 |
Extended Data Fig. 2 |. Observation of Mollow triplets.
Examples of Mollow triplets spectra at SACLA taken for Cu 7μm Foils. Further discussion and simulations in the Supplementary Information is provided to describe their formation.
Extended Data Fig. 3 |
Extended Data Fig. 3 |. Typical strong lasing spectra at SACLA.
25 random Strong Lasing Shots for Cu 20 μm Foils which all show broad and inhomogeneous spectra.
Figure 1.
Figure 1.. Experimental setup and concept of stimulated emission.
(a) The highly directional stimulated emission signal is analyzed with a flat Si(220) crystal with the Bragg angle centered at the Mn or Cu Kα1 followed by a 2D CCD detector. (b) Stimulated emission process is initiated by a SASE pump pulse ejecting many 1s electrons leading to emission of Kα1 photons when 2p3/2 electrons fill the 1s1/2 core hole. During stimulated emission, Kα1 photons emitted along the forward direction stimulate emission of more Kα1 photons resulting in exponential gain. (c) State diagram employed in 3D Maxwell-Bloch theory to simulate stimulated emission process. Atoms are excited from an initial ground state |g⟩ to set of upper levels |u⟩ corresponding to the two possible 1s1/2 core hole states with differing magnetic quantum (m = ±1/2). The Kα1 transition is to a set of 4 lower levels |l⟩ corresponding to 4 possible 2p3/2 core hole final states with differing magnetic quantum numbers (m = ±3/2, ±1/2).
Figure 2.
Figure 2.. Filamentation of stimulated Emission.
(a, b) 2D profiles taken at LCLS for NaMnO4 displaying hotspots in their spatial direction (ϕ). (c) Real space (xy) simulation of stimulated emission leaving the medium with 2 hot spots along the y axis. (d, e) Simulation of 2D profiles based on (c) with the spatial direction (ϕ) corresponding to either the x axis (d) or the y axis (e). The figures show that hot spots are more dominant in the 2D profile when they are aligned with the spatial direction (ϕ). (f) Temporal profile of pump (dashed) and stimulated emission (red) for simulation shown in (c). (g) Snap shots depicting xy profile of the stimulated emission simulation shown in (c) as it propagates in the gain medium showing the self-focusing and filamentation process. (See Supplementary Information for full video.)
Figure 3.
Figure 3.. Transition to strong lasing and Rabi cycling.
(a) Measured spectral width versus number of stimulated emission photons indicating transition to strong lasing regime. (b) Experimental 2D profile for NaMnO4 solution in the strong lasing regime (red point in a) with shoulder peak indicative of Autler-Townes splitting (top) compared to simulation showing same asymmetric splitting (bottom). (c) Phase dynamics of the stimulated emission. Top: 1D simulation showing symmetric splitting with equal intensity in each emission peak. Bottom: 3D simulation showing modulation during the Rabi cycling resulting in asymmetric, red-shifted spectrum. The Rabi ringing is no longer temporally coherent with the parent emission spike indication self-phase modulation of the radiation during 3D propagation. This asymmetry is consistent with the experimental 2D profile (b).
Figure 4.
Figure 4.. Broadening through Rabi Cycling at High Intensities.
(a) Experimental 2D profile displaying large spatial and spectral inhomogeneities/broadening for MnO film. (b) Simulation of 2D profile showing similar features using a SASE pump pulse and same average Mn density as in the experiment (a). (c) Temporal profile of the SASE pump pulse (dashed) and stimulated emission signal (red) used in the simulation showing 120 attosecond FWHM pulse length. (d) Experimental 2D profile displaying large spatial and spectral inhomogeneities/broadening and the onset of spectral fringes with ~2eV spacing for MnO film. (e) Simulation of 2D profile showing similar features using a SASE pump pulse and same Mn density as in the experiment (d). (f) Temporal profile of the SASE pump pulse (dashed) and stimulated emission signal (red) used in the simulation (e). The resulting signal shows a strong pulse with 100 attosecond FWHM length, and a much smaller second pulse, delayed by ~2 fs, corresponding the fringe spacing. (g) Experimental 2D profile displaying large spatial and spectral inhomogeneities/broadening and the more pronounced spectral fringes with ~4 eV spacing for Cu foil. (h) Simulation of 2D profile showing similar features using a SASE pump pulse and same Cu density as in the experiment (g). (i) Temporal profile of the SASE pump pulse (dashed) and stimulated emission signal (red) used in the simulation (h). The resulting signal shows two strong pulses with 90 and 100 attosecond FWHM lengths. The pulses are delayed by ~1 fs, corresponding to ~ 4eV fringe spacing.

References

    1. Hercher M. Laser-induced damage in transparent media. J. Opt. Soc. Am 54, 563 (1964).
    1. Rabi II Space quantization in a gyrating magnetic field. Phys. Rev 51, 652 (1937).
    1. Gray HR, Whitley RM & Stroud CRJ Coherent trapping of atomic populations. Opt. Lett 3, 218–220 (1978). - PubMed
    1. Bonifacio R. & Lugiato L. Cooperative radiation processes in two-level systems: Superfluorescence. Phys. Rev. A 11, 1507 (1975).
    1. Boyd RW, Gaeta AL & Giese E. Nonlinear optics. in Springer Handbook of Atomic, Molecular, and Optical Physics 1097–1110 (Springer, 2008).