. 2025 Jul;643(8074):1372-1380.
doi: 10.1038/s41586-025-09152-2. Epub 2025 Jun 11.

SP140-RESIST pathway regulates interferon mRNA stability and antiviral immunity

Affiliations

SP140-RESIST pathway regulates interferon mRNA stability and antiviral immunity

Kristen C Witt et al. Nature. 2025 Jul.

Abstract

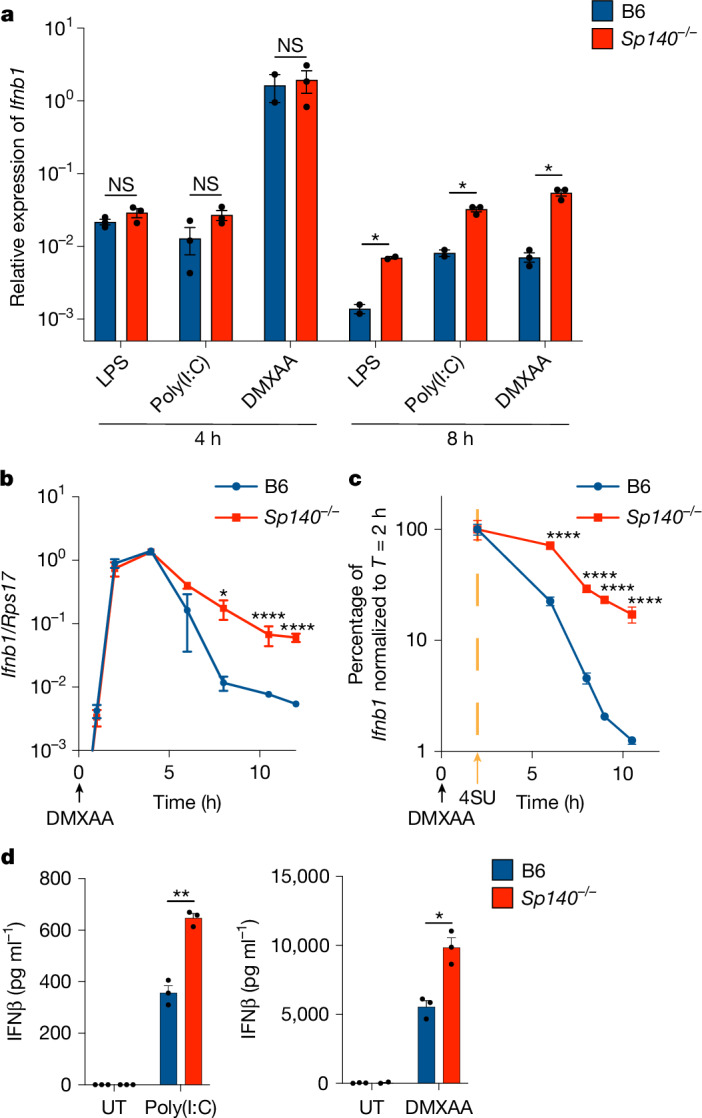
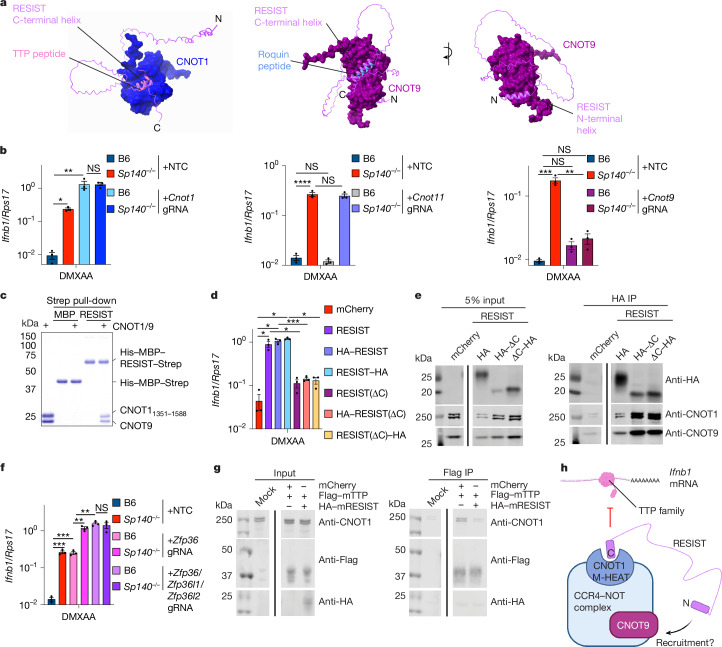
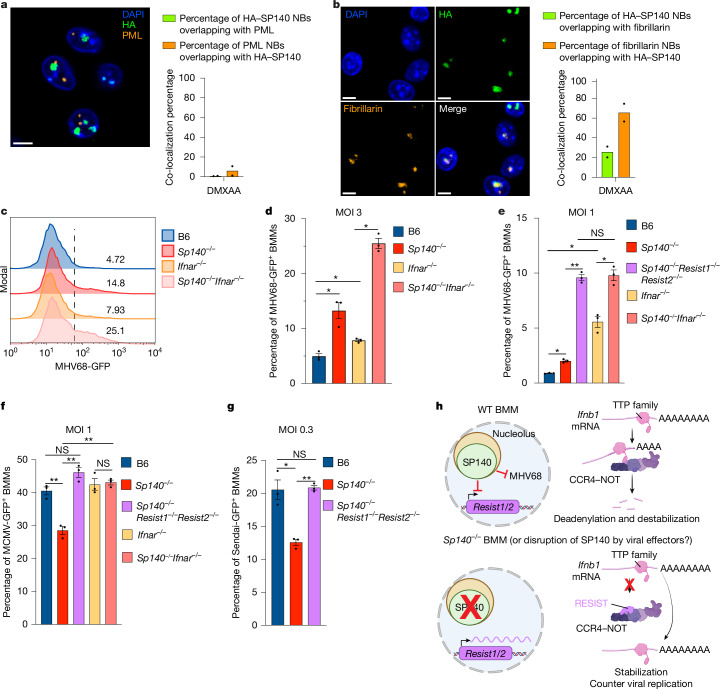
Type I interferons are essential for antiviral immunity1 but must be tightly regulated2. The conserved transcriptional repressor SP140 inhibits interferon-β (Ifnb1) expression through an unknown mechanism3,4. Here we report that SP140 does not directly repress Ifnb1 transcription. Instead, SP140 negatively regulates Ifnb1 mRNA stability by directly repressing the expression of a previously uncharacterized regulator that we call RESIST (regulated stimulator of interferon via stabilization of transcript; previously annotated as annexin 2 receptor). RESIST promotes Ifnb1 mRNA stability by counteracting Ifnb1 mRNA destabilization mediated by the tristetraprolin (TTP) family of RNA-binding proteins and the CCR4-NOT deadenylase complex. SP140 localizes within punctate structures called nuclear bodies that have important roles in silencing DNA-virus gene expression in the nucleus3. Consistent with this observation, we find that SP140 inhibits replication of the gammaherpesvirus MHV68. The antiviral activity of SP140 is independent of its ability to regulate Ifnb1. Our results establish dual antiviral and interferon regulatory functions for SP140. We propose that SP140 and RESIST participate in antiviral effector-triggered immunity5,6.


Conflict of interest statement

Competing interests: R.E.V. is on the scientific advisory boards of Tempest Therapeutics and X-biotix.

Figures

Fig. 1
Fig. 1. Ifnb1 mRNA is stabilized in the absence of SP140.
a, RT–qPCR analysis of Ifnb1 in BMMs treated for 4 or 8 h with 10 ng ml−1 LPS, or 100 μg ml−1 poly(I:C) or DMXAA. P = 0.26 (LPS), P = 0.17 (poly(I:C)) and P = 0.79 (DMXAA) at T = 4 h; and P = 0.02 (DMXAA) at T = 8 h. b, RT–qPCR analysis of Ifnb1 from BMMs treated with 100 μg ml−1 DMXAA at the indicated timepoints. P > 0.9999 (T = 0 and 4 h), P = 0.986 (T = 1 h), P = 0.995 (T = 2 h), P = 0.0062 (T = 6 h) and P < 0.0001 (T = 8, 10.5 and 12 h). c, Roadblock RT–qPCR analysis of BMMs treated with 4SU 2 h after treatment with 100 μg ml−1 DMXAA. P = 0.999 (T = 2 h) and P < 0.0001 (all other timepoints). d, Enzyme-linked immunosorbent assay (ELISA) analysis of IFNβ protein in the supernatants of BMMs treated for 24 h with 100 μg ml−1 poly(I:C) or DMXAA. P = 0.00185 (poly(I:C)) and P = 0.020 (DMXAA). Representative experiments are shown from two independent experiments. n = 3 (bd and a (DMXAA 8 h, LPS 4 h, poly(I:C) 4 h, Sp140−/− + DMXAA 4 h, Sp140−/− + poly(I:C) 8 h)) and n = 2 (a (B6 + DMXAA 4 h, LPS 8 h, B6 + poly(I:C) 8 h)) wells. Data are mean ± s.e.m. Statistical analysis was performed using two-tailed t-tests with Welch’s correction (d) and false-discovery rate (FDR) correction (a), or two-way analysis of variance (ANOVA) with Šidák’s multiple-comparison correction (b and c); *P < 0.05, **P < 0.005, ***P < 0.0005, ****P < 0.0001; NS, not significant. The statistical test results are provided in the Source data. Source data
Fig. 2
Fig. 2. Resist1 and Resist2 are repressed by SP140 and correlate with increased Ifnb1 transcripts in Sp140−/− cells.
a, DEGs from RNA-seq data of DMXAA-treated Sp140−/−Ifnar−/− versus Ifnar−/− BMMs. Genes indicated in red are upregulated in Sp140−/−Ifnar−/− BMMs with log2[fold change (FC)] > 1 and adjusted P (Padj) < 0.05. Genes indicated in blue are downregulated in Sp140−/−Ifnar−/− BMMs with log2[FC] > −1 and Padj < 0.05. The Padj value for Sp140 is <2.225 × 10−308 and is graphed as −10 × Padj of Mid1 for visualization. Resist2 (Gm36079) is not depicted on the volcano plot as it is removed by the DeSeq2 independent filtering function for genes with low read counts. Padj values are provided in the Source data and were calculated using two-tailed Wald tests with Benjamini–Hochberg correction for multiple comparisons using the DeSeq2 package. b, The maximum HA–SP140 CUT&RUN MACS2 signal values, the maximum log2[FC] in chromatin accessibility from ATAC–seq of DMXAA-treated B6 and Sp140−/− BMMs, and the log2[FC] from RNA-seq analysis of DMXAA-treated B6, Sp140−/−, Ifnar−/− and Sp140−/−Ifnar−/− BMMs for significantly upregulated DEGs from a, as well as Sp140 and Resist2. Cells are coloured according to the column value. c, Alignment of reads at the Resist1/2 locus from anti-HA CUT&RUN data for DMXAA-treated BMMs transduced with HA–SP140 or SP140, and ATAC–seq/RNA-seq data of DMXAA-treated B6 and Sp140−/− BMMs. Alignments were visualized in the UCSC genome browser. Source data
Fig. 3
Fig. 3. RESIST binds to the CCR4–NOT complex and stabilizes Ifnb1 mRNA.
a, Immunoblot analysis of transduced BMM immunoprecipitate (IP), stimulated with doxycycline and 100 μg ml−1 DMXAA for 5–7 h (source data are provided in Supplementary Fig. 1). b, RT–qPCR analysis of Ifnb1 from BMMs that were electroporated with the indicated Cas9–gRNA ribonucleoproteins (RNPs) with 8 h 100 μg ml−1 DMXAA stimulation. The knockout efficiency was >85%. UT, untreated. c, RT–qPCR analysis of Ifnb1 from BMMs with 8 h 100 μg ml−1 DMXAA stimulation. d, BMM supernatant ELISA, 24 h 100 μg ml−1 DMXAA stimulation. e, Roadblock RT–qPCR analysis of BMMs electroporated with the indicated Cas9–gRNA RNPs and treated with 100 μg ml−1 DMXAA then 4SU. The knockout efficiency was 71% for Resist1 and 51–69% for Resist2. The asterisks for timepoints, coloured by condition, indicate significance versus B6 + NTC. The black bars and asterisks indicate comparisons between Sp140−/− + NTC and Sp140−/−+Resist1/2 gRNA. f, RT–qPCR analysis of Ifnb1 from transduced BMMs treated with doxycycline and 100 μg ml−1 DMXAA for 7 h. g, Roadblock RT–qPCR analysis of Ifnb1 from transduced B6 BMMs stimulated with doxycycline and 100 μg ml−1 DMXAA, then 4SU at 2 h. The asterisks indicate significance versus mCherry. h, RT–qPCR analysis of IFNB1 from transduced human BlaER1 monocytes stimulated with ADU-S100 and doxycycline. The asterisks indicate significance versus mCherry. i, Mouse lung colony-forming units (CFU) 96 h after L. pneumophila infection. Three independent pooled experiments; n = 3 wells (bh). For i, the number of mice is indicated in the figure. Data are mean ± s.e.m. Statistical analysis was performed using one-way ANOVA with post hoc Dunnett’s T3 multiple-comparison correction (b, c and f) or FDR correction (d), two-way ANOVA with post hoc Tukey’s correction (e, g and h) and Kruskal–Wallis one-way ANOVA and Dunn’s correction (i). Representative results are shown from four (a), three (b and d) and two (c, e, f, g and h) independent experiments. *P < 0.05, **P < 0.005, ***P < 0.0005, ****P < 0.0001; NS, not significant. Exact P values are provided in the Source data. Source data
Fig. 4
Fig. 4. RESIST counteracts repression of IFN-I by TTP-family proteins, a function that requires a RESIST C-terminal region and CNOT9.
a, AlphaFold predictions of RESIST with CNOT1 M-HEAT and CNOT9. TTP peptide–CNOT1 M-HEAT is from PDB 4J8S (ref. ). ROQUIN peptide–CNOT9 is from PDB 5LSW (ref. ). The N-terminal and C-terminal ends of RESIST are marked by N and C, respectively. b, RT–qPCR analysis of Ifnb1 from BMMs electroporated with non-targeting control gRNA (NTC) or gRNAs targeting the indicated CCR4–NOT subunits after treatment for 8 h with 100 μg ml−1 DMXAA. c, Strep pull-down of purified recombinant full-length human His–MBP–RESIST–Strep or His–MBP–Strep with human CNOT9 and CNOT1 (amino acids 1351–1588). The first lane indicates purified CNOT9 and CNOT1. d, RT–qPCR analysis of Ifnb1 for BMMs transduced with the indicated lentiviral constructs and treated with doxycycline and DMXAA for 6 h. The results include data that are also shown in Fig. 3f. e, Immunoblot analysis of anti-HA IP of BMMs transduced with the indicated constructs in d. The RESIST construct is C-terminally tagged with HA. Gel source data are provided in Supplementary Fig. 1. f, RT–qPCR analysis of Ifnb1 from BMMs electroporated with the indicated gRNAs and treated for 8 h with 100 μg ml−1 DMXAA. g, Immunoblot analysis of Flag IP of Flag–TTP (mouse) co-expressed with mouse HA–RESIST in HEK293T cells. Gel source data are provided in Supplementary Fig. 1. h, Schematic of how RESIST may interact with CCR4–NOT subunits CNOT1 and CNOT9 to mediate the stabilization of Ifnb1 mRNAs. The diagram was created using BioRender.com. Data are mean ± s.e.m. Statistical analysis was performed using one-way ANOVA tests with post hoc Dunnett’s T3 multiple-comparison correction. n = 3 wells of cells (b, d and f). Results are representative of two independent experiments (bg). *P < 0.05, **P < 0.005, ***P < 0.0005, ****P < 0.0001; NS, not significant. Exact P values are provided in the Source data. Source data
Fig. 5
Fig. 5. SP140 is an antiviral NB protein that co-localizes with nucleoli.
a, Immunofluorescence analysis of DMXAA-treated HA-Sp140+/+ BMMs, with DAPI, anti-HA and anti-PML staining. HA–SP140 and PML NB overlap was quantified for two independent experiments. Scale bar, 5 μm. b, Immunofluorescence analysis of DMXAA-treated HA-Sp140+/+ BMMs stained with DAPI, anti-HA and anti-fibrillarin. HA–SP140 and fibrillarin NB overlap was quantified for two independent experiments. Scale bars, 5 μm. c, The MHV68-GFP signal in MHV68-GFP-infected BMMs was assessed using flow cytometry. The numbers represent MHV68-GFP+ as a percentage of live cells. d, Quantification of MHV68-GFP+ cells from c. P = 0.0225 (B6 versus Sp140−/−), P = 0.0161 (B6 versus Ifnar−/−) and P = 0.0073 (Ifnar−/− versus Sp140−/−Ifnar−/−). MOI, multiplicity of infection. e, Quantification of MHV68-GFP+ BMMs. P = 0.007 (B6 versus Sp140−/−), P = 0.0025 (Sp140−/− versus Sp140−/−Resist1−/−Resist2−/−), P = 0.0136 (B6 versus Ifnar−/−) and P = 0.007 (Ifnar−/− versus Sp140−/−Ifnar−/−). f, Quantification of MCMV-GFP+ BMMs, assessed using flow cytometry. P = 0.0042 (B6 versus Sp140−/−), P = 0.0035 (Sp140−/− versus Sp140−/−Resist1−/−Resist2−/−) and P = 0.0035 (Ifnar−/− versus Sp140−/−Ifnar−/−). g, Quantification of Sendai-GFP+ BMMs, assessed using flow cytometry. P = 0.0251 (B6 versus Sp140−/−) and P = 0.0006 (Sp140−/− versus Sp140−/−Resist1−/−Resist2−/−). h, Schematic of the proposed model of SP140 antiviral activity and RESIST-mediated Ifnb1 transcript stabilization. The diagram was created using BioRender.com. Data are mean ± s.e.m. n = 3 wells (dg). Statistical analysis was performed using one-way ANOVA with FDR correction (dg). Results are representative of two (a and b) or three (cg) independent experiments. *P < 0.05, **P < 0.005; NS, not significant. Exact P values are provided in the Source data. Source data
Extended Data Fig. 1
Extended Data Fig. 1. SP140 predominantly represses chromatin accessibility and binds genes involved in development, although these genes are not differentially expressed in the absence of SP140.
a. RT-qPCR for transduced Sp140–/– BMMs, 8 h 100 μg/mL DMXAA, for CUT&RUN samples. Mean +/− s.e.m are plotted, n = 3 wells of cells, * = p < 0.05, ** = p < 0.005, *** = p < 0.0005, **** = p < 0.0001, ns = not significant, one-way ANOVA with Dunnett’s T3 post-hoc correction. p = 0.0092 for B6 vs. Sp140–/– + NeonGreen, 0.0017 for Sp140–/– + NeonGreen vs. Sp140–/– + SP140, 0.0013 for Sp140–/– + NeonGreen vs. Sp140–/– + HA-SP140. Exact p values are in Source Data. Results representative of four independent experiments. b. Top 10 GO terms for HA-SP140 bound genes in anti-HA CUT&RUN. Adjusted p values calculated with two-sided binomial test and multiple comparison corrections (GREAT). c. Volcano plot of differentially accessible ATAC-seq peaks in DMXAA-treated Sp140–/– vs. B6 BMMs, filtered by genes also bound by HA-SP140 in anti-HA CUT&RUN. Blue dots indicate genes with log2 fold change < −1 and adjusted p (padj) <0.05; red dots indicate genes with log2 fold change > 1 and padj <0.05. for differential ATAC-seq peak accessibility in DMXAA-treated Sp140–/– BMMs. Adjusted p-values are in Source Data and were calculated with DeSeq2 (Fig. 2a). d. Alignment of reads from HA-SP140 or untagged SP140 anti-HA CUT&RUN, and RNA-seq/ATAC-seq of Sp140–/– and B6 BMMs, at Hoxa9. e. GIGGLE similarity score for HA-SP140 CUT&RUN peak overlap with publicly available ChIP-seq datasets for indicated histone marks. f. Table of adjusted p (padj) and log2 fold change for “lineage-inappropriate SP140-regulated” genes from DMXAA-treated Sp140–/– and B6 BMMs RNA-seq. Adjusted p-values calculated as in c. Source data
Extended Data Fig. 2
Extended Data Fig. 2. SP140 does not bind the Ifnb1 locus or known regulatory elements.
a. Alignment of reads at Ifnb1 from HA-SP140 or untagged SP140 anti-HA CUT&RUN, ATAC-seq of DMXAA-treated Sp140–/– and B6 BMMs, and RNA-seq of DMXAA-treated Sp140–/– and B6 BMMs. b. Alignment of reads from HA-SP140 or untagged SP140 anti-HA CUT&RUN, and ATAC-seq/RNA-seq of Sp140–/– and B6 BMMs treated with DMXAA, at the Ifnb1 regulatory elements ICE,, FIRE, and the MRE.
Extended Data Fig. 3
Extended Data Fig. 3. ANXA2R/RESIST expression in humans and mice, assessment of binding to Annexin 2, and generation of Gm21188/Resist1–/–Gm36079/Resist2–/– mice.
a. Expression values (DESeq2 normalized values) for Gm21188 (Resist1) for all cell types with high expression (>80 for expression value). Data from immgen.org. b. Expression of ANXA2R in human PBMC single-cell RNAseq data from Immune Cell Atlas (data from https://singlecell.broadinstitute.org/single_cell/study/SCP345/ica-blood-mononuclear-cells-2-donors-2-sites?scpbr=immune-cell-atlas#study-summary) c. Pull-down assay of recombinant STREP-ANXA2R and STREP-SMARCA3 (residues 26–39) upon incubation with ANXA2-S100A. Results representative of two independent experiments. For gel source data, see Supplementary Fig. 1. d. Schematic of Resist1/2 (Gm21188/Gm36079) locus with protein coding sequences indicated with purple arrows and gRNA targeted sequence indicated in blue. Resist2 contains a SNP within the gRNA targeting sequence (in bold). WT traces are indicated at guide-targeted regions for both Resist1 and Resist2. Sequence traces from Sp140–/–Resist1–/–Resist2–/– mice (KO) are below with indicated mutations in Resist1/2. Source data
Extended Data Fig. 4
Extended Data Fig. 4. AlphaFold predictions suggest RESIST likely binds the CNOT1 M-HEAT domain.
a. Schematic of CCR4-NOT subunit and RESIST complexes produced by Alphafold Multimer. Schematic was generated in BioRender.com. b. Aligned AlphaFold models of RESIST with the CNOT1 M-HEAT domain. c. The top-scoring structural prediction of the RESIST and CNOT1 M-HEAT complex, coloured by pLDDT. d. AlphaFold PAE plot of predicted RESIST and CNOT1 M-HEAT complex. Plot generated with PAEViewer. e. Depiction of RESIST binding to a hydrophobic patch on the CNOT-1 M-HEAT domain (CNOT1 coloured by hydrophobicity).
Extended Data Fig. 5
Extended Data Fig. 5. AlphaFold predictions suggest RESIST likely binds the CNOT9 subunit.
a. Aligned structural predictions of RESIST interactions with CNOT9. b. Second-ranked Alphafold structural prediction of RESIST and CNOT9 complex coloured by pLDDT. c. AlphaFold PAE plot of predicted RESIST and CNOT9 complex. Plot generated with PAEViewer. d. Depiction of RESIST binding to multiple hydrophobic patches on CNOT9 (CNOT9 coloured by hydrophobicity).
Extended Data Fig. 6
Extended Data Fig. 6. AlphaFold predictions suggest RESIST likely does not bind CNOT11.
a. Aligned AlphaFold structure predictions of RESIST with the CNOT1 NMIF4G-NHEAT domains, CNOT10, and CNOT11. b. Highest-scoring AlphaFold structure prediction of RESIST and CNOT1/CNOT10/CNOT11 complex coloured by pLDDT. c. AlphaFold PAE plot of predicted RESIST and CNOT1/CNOT10/CNOT11 complex. Plot generated with PAEViewer.
Extended Data Fig. 7
Extended Data Fig. 7. Assessment of CCR4-NOT subunit, TTP family, and ROQUIN1/2 knockout efficiency and role of ROQUIN1/2 in Ifnb1 regulation in BMMs.
a. Immunoblot of B6 or Sp140–/– BMMs electroporated with indicated gRNAs for indicated CCR4-NOT subunits for experiments shown in Fig. 4b. Actin blots represents loading controls. For gel source data, see Supplementary Fig. 1. b. Immunoblot of B6 or Sp140–/– BMMs electroporated with indicated gRNAs for indicated TTP family members for experiments shown in Fig. 4f after 8 h of 100 μg/mL DMXAA. Actin blots represents loading controls. Results representative of two independent experiments. For gel source data, see Supplementary Fig. 1. c. RT-qPCR for Ifnb1 in BMMs electroporated with NTC gRNAs or gRNAS targeting Rc3h1/Rc3h2 (genes encoding ROQUIN1/2) after 8 h of 100 μg/mL DMXAA treatment. Data mean +/− s.e.m are plotted, n = 3 wells of cells, * = p < 0.05, ** = p < 0.005, *** = p < 0.0005, **** = p < 0.0001, ns = not significant, one-way ANOVA with Dunnett’s T3 post-hoc correction. Adjusted p = 0.0025 for B6 + NTC vs. Sp140–/– + NTC, 0.8028 for Sp140–/– + NTC vs. Sp140–/– + Rc3h1/2 gRNA, and 0.0002 for B6 + Rc3h1/2 gRNA vs. Sp140–/– + Rc3h1/2 gRNA. Additional exact adjusted p values and statistical test results are provided in Source Data. Results representative of two independent experiments. d. Knockout efficiency for Rc3h1/Rc3h2 in BMMs electroporated with gRNAs targeting Rc3h1 and Rc3h2 for results shown in c. Source data
Extended Data Fig. 8
Extended Data Fig. 8. The TTP zinc finger domain (TZF) binds the Ifnb1 3’UTR in an ARE-dependent manner.
Top: binding curve of TZF to SYBR-Gold labelled Ifnb1 3’UTR RNA for either WT (orange) or ARE mutant (purple), quantified from bottom. Bottom: representative electrophoretic mobility shift assay (EMSA) of TZF to ARE-WT or mutant Ifnb1 3’UTR. For gel source data, see Supplementary Fig. 1. Results representative of two independent experiments. Source data
Extended Data Fig. 9
Extended Data Fig. 9. Generation and validation of HA-Sp140 knock-in mice.
a. Schematic of gene-targeting strategy to generate HA-Sp140 knock-in mice and depiction of resulting HA-Sp140+/+ founder line. b. Immunoblot of BMMs of indicated genotypes treated with 100 μg/mL DMXAA for 8 h or 10 ng/mL IFNγ for 24 h. Actin blot represents loading control for anti-SP140 blot, and sample processing control for anti-HA blot. For gel source data, see Supplementary Fig. 1. Results representative of two independent experiments. c. RT-qPCR for Ifnb1 from BMMs of indicated genotypes after 8 h of 100 μg/mL DMXAA treatment. Data mean +/− s.e.m are plotted, n = 3 wells of cells, * = p < 0.05, ** = p < 0.005, *** = p < 0.0005, **** = p < 0.0001, ns = not significant, one-way ANOVA with Dunnett’s T3 post-hoc correction. Adjusted p < 0.0001 for B6 vs. Sp140–/– and Sp140–/– vs. HA-Sp140+/+, and adjusted p = 0.3071 for B6 vs. HA-Sp140+/+. Additional exact adjusted p values and statistical test results are provided in Source Data. d. Immunofluorescence of B6 BMMs treated with 8 h of 100 μg/mL DMXAA stained with anti-HA, anti-PML, and DAPI. Staining control for Fig. 5a. e. Immunofluorescence of B6 BMMs treated with 8 h of 100 μg/mL DMXAA stained with anti-HA, anti-fibrillarin, and DAPI. Staining control for Fig. 5b. Source data
Extended Data Fig. 10
Extended Data Fig. 10. Gating strategy for BMMs infected with GFP-encoding viruses, and measurement of Ifnb1 transcripts in B6 and Sp140–/– BMMs upon infection with MHV68-GFP.
a. Representative flow plots and gating strategy for BMMs infected with viruses encoding GFP. Experiment shown is for B6 BMMs infected with MHV68-GFP, MOI 3, for 24 h. b. RT-qPCR of BMMs 8 h after infection with MHV68-GFP, MOI of 1. Data mean +/− s.e.m are plotted, n = 6 wells of cells, * = p < 0.05, ** = p < 0.005, *** = p < 0.0005, **** = p < 0.0001, ns = not significant, two-tailed t-test with Welch’s correction. p = 0.333356 for T = 0 h and 0.004352 for T = 8 h. Results representative of two independent experiments. Statistical test results are provided in Source Data. Source data

Update of

References

    1. McNab, F. et al. Type I interferons in infectious disease. Nat. Rev. Immunol.15, 87–103 (2015). - PMC - PubMed
    1. Crowl, J. T., Gray, E. E., Pestal, K., Volkman, H. & Stetson, D. B. Intracellular nucleic acid detection in autoimmunity. Ann. Rev. Immunology35, 313–336 (2017). - PMC - PubMed
    1. Fraschilla, I. & Jeffrey, K. L. The speckled protein (SP) family: immunity’s chromatin readers. Trends Immunol.41, 572–585 (2020). - PMC - PubMed
    1. Ji, D. X. et al. Role of the transcriptional regulator SP140 in resistance to bacterial infections via repression of type I interferons. eLife10, e67290 (2021). - PMC - PubMed
    1. Remick, B. C., Gaidt, M. M. & Vance, R. E. Effector-triggered immunity. Ann. Rev. Immunol.41, 453–481 (2023). - PubMed

LinkOut - more resources