. 2025 Jul;643(8072):801-809.
doi: 10.1038/s41586-025-09111-x. Epub 2025 Jun 11.

Targeting GRPR for sex hormone-dependent cancer after loss of E-cadherin

Affiliations

Targeting GRPR for sex hormone-dependent cancer after loss of E-cadherin

Jérémy H Raymond et al. Nature. 2025 Jul.

Erratum in

Abstract

Sex inequalities in cancer are well documented, but the current limited understanding is hindering advances in precision medicine and therapies1. Consideration of ethnicity, age and sex is essential for the management of cancer patients because they underlie important differences in both incidence and response to treatment2,3. Age-related hormone production, which is a consistent divergence between the sexes, is underestimated in cancers that are not recognized as being hormone dependent4-6. Here, we show that premenopausal women have increased vulnerability to cancers, and we identify the cell-cell adhesion molecule E-cadherin as a crucial component in the oestrogen response in various cancers, including melanoma. In a mouse model of melanoma, we discovered an oestrogen-sensitizing pathway connecting E-cadherin, β-catenin, oestrogen receptor-α and GRPR that promotes melanoma aggressiveness in women. Inhibiting this pathway by targeting GRPR or oestrogen receptor-α reduces metastasis in mice, indicating its therapeutic potential. Our study introduces a concept linking hormone sensitivity and tumour phenotype in which hormones affect cell phenotype and aggressiveness. We have identified an integrated pro-tumour pathway in women and propose that targeting a G-protein-coupled receptor with drugs not commonly used for cancer treatment could be more effective in treating E-cadherin-dependent cancers in women. This study emphasizes the importance of sex-specific factors in cancer management and offers hope of improving outcomes in various cancers.


Conflict of interest statement

Competing interests: The authors declare no competing interests.

Figures

Fig. 1
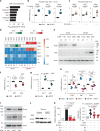
Fig. 1. E-cadherin is a crucial hub in oestrogen-mediated cancer responses with sex-dependent effects on melanoma metastasis.
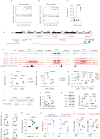
a,b, Incidence ratios (women/men) for all cancers (a) and malignant melanoma of the skin (b) across different age groups, depicted as age-standardized rates (ASR). Data sourced from GLOBOCAN 2020 (ref. ). c, Plasmatic oestradiol concentration stratified by age and sex. d, Venn diagram highlighting the overlap between genes associated with cancer, demonstrating a peak in incidence in women aged 15–55 (with melanoma, breast cancer, thyroid cancer and gastric cancer) and genes associated with ESR1. The four indicated genes are at the intersection of all five categories. e, Expression of CDH1, CCND1, BRAF and KRAS in human melanoma (TCGA database) stratified by sex and age. TPM, transcripts per million reads. f, Kaplan–Meier survival curves for melanoma-free mice categorized by E-cadherin status and sex; n is the number of mice per condition. No significant differences were observed by log-rank analysis. g,h, Representative lung images from female mice with primary melanoma for Ecad (g) or mutated Ecad (h). Yellow hexagons, micro-metastases; white circles, macro-metastases; scale bar, 2 mm; g and h are at the same scale. i, Frequency of lung metastasis in mice categorized by Ecad and sex status. j, Metastasis quantification based on Ecad and sex status. Significance was assessed by chi-square test for metastasis proportions and two-sided Mann–Whitney test adjusted for multiple testing by the Benjamini–Hochberg method for metastasis counts. NS, not significant. Source data
Fig. 2
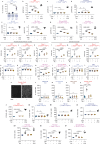
Fig. 2. Loss of Cdh1 Induces Grpr expression.
a, Volcano plot illustrating differential gene expression between female Ecad and ∆Ecad tumours, with Grpr indicated. b, Scatter plot showing the correlation of each gene’s expression with the invasive score in human tumours, plotted against its differential expression between female ∆Ecad and Ecad tumours. Pearson correlation coefficients were used to assess gene-invasive score associations. c, Heatmap clustering TCGA SKCM samples based on predominant cell-state signatures. SMC, starved-like melanoma cells; NCSC, neural crest cell-like. d,e, Kaplan–Meier survival curves for overall survival (d) and progression-free survival (e) of TCGA SKCM women categorized by GRPR expression (low or absent, ≤0.1 TPM; expressed, >1 TPM). A log-rank test was used to evaluate significance. f,g, Immunohistochemistry staining for CDH1 (f) and GRPR (g) in human lung melanoma (Ma) metastases. *, Bronchi serve as an internal positive control for E-cadherin staining; ** and ***, smooth muscle acts as internal positive controls for GRPR. Scale bar (300 μm) applies to both f and g. h,i, Metastasis classification based on CDH1 and GRPR expression (h) and NRAS and BRAF status (i) in lung metastasis samples. **P < 0.01, Fisher’s exact test. j, Heatmap displays showing GRPR and CDH1 mRNA expression in melanomas and various carcinomas from the TCGA database and GSE162682. BRCA, breast-invasive carcinoma; LUSC, lung squamous-cell carcinoma; STAD, stomach adenocarcinoma; THCA, thyroid carcinoma. Source data
Fig. 3
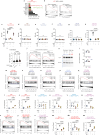
Fig. 3. Grpr expression and activation drive lung melanoma metastasis.
a, Representative lung images taken 30 days after the injection of 5 × 105 male melanoma cells (1181) lacking Grpr (−, parental; Ct, control) or expressing exogenous Grpr (+Grpr) into male C57BL/6J mice tail veins. Scale bar, 2 mm. b,c, Percentage of mice generating metatases (left) and number of metastases per mouse (right) after injection of 5 × 105 male melanoma cells into tail veins for 1181, 1181 control and 1181 Grpr in C57BL/6 J male mice (b) and 501mel, 501mel control and 501mel Grpr in NSG male mice (c). d, Lung metastases observed 28 days after intravenous injection of 5 × 105 1057Luc Grpr+ melanoma cells, demonstrating extensive lung colonization (small arrows) and proliferative foci (large arrows). Scale bar, 2 mm. e, RNAscope image showing colocalized Grpr (green) and Dct (red) mRNA in a lung metastasis in mice after tail-vein injection of 1057Luc cells. Scale bar, 50 µM. fi, Lung metastases observed after tail-vein injection of 5 × 105 1057-Luc Grpr+ cells into C57BL/6J mice treated with RC-3095 (RC, mice 7 and 10) or not treated (mice 2 and 3). Luminescence (recorded by IVIS) from mouse thorax after RC treatment or without treatment (f); scale bar, 1 cm. IVIS assessment of ex vivo lung luminescence after 28 days of RC or vehicle treatment images (g) and quantification (h); scale bar, 4 mm. Estimation of number of metastases from five isolated independent lungs in RC-treated and untreated mice (i). Metastasis frequencies were compared by chi-squared test. Metastasis counts were compared using two-sided Mann–Whitney (two groups) or Kruskal–Wallis adjusted by a Dunn’s test (multiple groups). a.u., arbitrary units. Data are shown as mean ± s.d. (b,c and h) or s.e.m. (i). Source data
Fig. 4
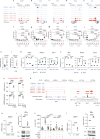
Fig. 4. GRPR activates YAP1 to activate the metastatic program.
a, Colony-formation assay done over 10 days, showing colonies from male Ecad+/Grpr and Ecad/Grpr+ cells, and female Ecad+/Grpr and Ecad/Grpr+ cells. b,c, Clonogenic assays for 1181 mouse Grpr (b) and 501mel human GRPR (c) melanoma cell lines: parental (left), control (middle) and exogenous GRPR expression (right). d–i, In vitro assays on mouse 1057 (d,f,h) and human MDA-MB-435S (e,g,i) GRPR+ cells evaluated for the impact of GRP (10 nM), RC (1 µM) or both under low-serum conditions. GRP promoted cell growth (d,e), anoikis resistance (f,g) and invasion (h,i), effects reversed by RC. GRP + RC effects were compared with vehicle and full-serum controls. Growth and anoikis resistance were assessed after 48 h; invasion at 24 h. NS, not significant. j, Representative images and percentage of cells displaying nuclear Yap1 localization in Grpr+ mouse melanoma cells (1057) after a 1-h stimulation with vehicle (lane 1), 10 nM GRP (lane 2), 1 µM RC (lane 3) or GRP and RC (lane 4). Scale bar, 10 µm. k, GSEA of the YAP1 activation signature in Grpr+ 1057 cells. Gene expression was assessed by RNA-seq 4 h after stimulation with 10 nM GRP and normalized using DEseq2 before doing the GSEA. FDR, false discovery rate; NES, normalized enrichment score. l, Inhibition of GRP-induced cell invasion after Yap1, Taz or Yap1 + Taz silencing. Each assay was independently repeated at least three times. Multi-group comparisons were done by Kruskal–Wallis tests adjusted by Dunn’s correction. Comparisons with the GRP-induced group were done by two-sided Mann–Whitney tests adjusted for multiple comparisons by Benjamini–Hochberg correction. Data are represented as mean ± s.d. and box plots represent the median and the 25–75 percentiles; whiskers represent the minimum and the maximum. At least three independent biological replicates were performed per experiment. Source data
Fig. 5
Fig. 5. Grpr expression in female mice by a Cdh1/Ctnnb1/Esr1/Grpr amplification loop.
a, Enrichment of mouse ChIP–seq signatures in ∆Ecad female-specific H3K27ac peaks located at gene bodies or promoters. b,c, Quantitative PCR with reverse transcription (RT–qPCR) of Nkd1, Esr1 and Grpr in Ecad mouse 1014 melanoma cells after siScr versus siCdh1 in the presence of β-catenin (bcat; b) and pcDNA3 versus β-catenin transfection (c). d, Heatmap of sex-hormone receptor expression in Ecad and ∆Ecad melanoma cell lines, annotated with Cdh1 and Grpr levels. M, male; F, female e, Western blot of E-cadherin and ERα in mouse melanoma cell lines. Actin was used as a loading control. f,g, Effect of Esr1 knockdown (f) or overexpression (g) on GRPR in mouse and human melanoma cells. h, Grpr expression after Cdh1 and/or Esr1 knockdown in Cdh1+ mouse melanoma cells. i, Western blot analysis of Ecad and ERα after siScr, siCdh1 or siESR1 in 1014 cells. Actin was used as a loading control. j, Western blot of ECAD in 501mel cells with and without GRPR expression and GRP treatment. k, Quantification of lung metastases by stereomicroscopy and RT–qPCR for Cre markers in lungs. The log-normalized expression values were compared by two-sided Student’s t-test (two groups) or by analysis of variance (ANOVA) corrected by Tukeys’s test (multiple groups). Metastasis burden was assessed by Fisher’s exact test adjusted by the Bonferroni method. Variation of the Cre expression was assessed by two-sided Mann–Whitney tests adjusted for multiple comparisons by a Benjamini–Hochberg test. Data are shown as mean ± s.d. At least three independent biological replicates were performed for each experiment. Ful, Fulvestrant. Source data
Extended Data Fig. 1
Extended Data Fig. 1. Between puberty and the menopause, the incidence of cancer is higher in women than in men.
a,b Crude incidence rates (cases/100,000) for all cancers (a) and cutaneous malignant melanoma (b) in the world population in 2020. Data are presented for each sex and as the average of both sexes. c, Cancers with a positive female/male curve peak and PV > 0.20 (PV = premenopausal variation) are highlighted in red, cancers with a negative curve peak and PV < −0.20 are highlighted in blue, and cancers without a curve peak are colored in white (see Supplementary Table 1). d-f, Examples of the three categories: (d) gastric cancer (positive peak), (e) liver cancer (negative peak), and (f) brain/CNS cancer (no peak). Dashed lines represent 4th order polynomial fits. g, Median testosterone concentration by age in women and men. h, CDH1 expression in melanoma by NRAS or BRAF drivers (TCGA-SKCM), Chi-square test. *p ≤ 0.05. i,j, Micro- (i) and macro- (j) metastasis quantification by Ecad and sex. Each dot is an indenpendant mouse. Proportion were assessed by a Chi-square and metastasis counts by two-sided t-test adjusted. Data are representated as mean ± SD. Source data
Extended Data Fig. 2
Extended Data Fig. 2. Grpr transcription activation in ∆Ecad female melanoma and endogenous agonist expression in the lung.
a, RT-qPCR measured Grpr mRNA in male and female Ecad and ∆Ecad mouse melanoma. b, H3K27ac ChIP-seq track for Grpr in mouse melanoma cell lines by sex and Ecad status, aligned to GRCm38 mm10 reference genome. c, RNAscope of mouse lungs showing Grpr (green) and Dct (red - as a melanoma marker) in Ecad and ΔEcad male and female transgenic mice; ΔEcad females with lung metastasis show abundant Grpr expression. d, Grpr mRNA levels in Tyr::NRASQ61K female melanomas background with different genetic backgrounds. Tyr::CreA is located on the X chromosome (denoted by ‘A’), while Tyr::CreB is located on an autosome (denoted by ‘B’). ‘-’ represents the absence of the Cre gene in the genome. Ecad +/+ is indicated by ‘+’, EcadF/F by ‘-‘, Ink4a +/+ by ‘+’, and Ink4a +/− by ‘−’. Similarly, Pten +/+ is represented by ‘+’, and PtenF/+ by ‘−’. e, Invasive score in TCGA-SKCM melanomas with GRPR expression (Spearman coefficient r = 0.35). f-h, Differential gene expression (fold change) correlated with phenotypic scores: (f) NCSC-like, (g) pigmented, and (h) SMC. Grpr is highlighted in red. i,j, Overall Survival (OS) (i) and Progression-Free Survival (PFS) (j) Kaplan-Meier curves for TCGA-SKCM based on GRPR expression (low/absent ≤ 0.1 TPM and expressed > 1 TPM). k-m, mRNA GRP levels in humans (k,l) and mice (m); abundant in human and mouse lung. Human data sourced from the Human Protein Atlas, mouse data from the EBI Expression Atlas. Anatogram was created with gganatogram. Comparisons significance was assessed by two-sided Mann-Whitney adjusted for multiple comparisons with a Benjamini–Hochberg test. Score significance was assessed by ANOVA adjusted with a Tukey post-test. Survival was assessed by Log-Rank. Data are represented as mean ± SD. Box plot represent the median and the 25–75 percentiles, the whiskers represent the minimum and the maximum. ≥ 3 independent biological replicates were performed per experiment. Source data
Extended Data Fig. 3
Extended Data Fig. 3. RC-3095 suppresses lung melanoma growth and metastases.
a, Lung metastases observed 30 days post-tail-vein-injection: 12/13 mice injected with ∆Ecad cells developed metastasis, whereas no metastasis was observed in 0/6 mice with Ecad cells, b, Time to reach 1 cm³ tumor volume in neck-graft reimplantations of male and female Ecad and ΔEcad melanoma in male and female C57BL/6 J mice, respectively. c, DNA and RNA sequencing of Grpr in 1057 mouse melanoma cells showing X inactivation. The blue vertical line corresponds to the active X chromosome, while the red line the inactive X chromosome. d, Grpr knockout strategy via exon 2 deletion in 1057 mouse melanoma cells. e, Genotyping of Grpr deletion clones before and after CRISPR editing. (1) corresponds to Grpr wt/wt, and (2) corresponds to Grpr wt/ΔEx2. DDW = double distilled water. Par = parental. f, Clone obtention efficiency in ΔEcad mouse melanoma cells with CRISPR-targeted gRNAs (Chi-square test). g, Grpr expression in clonal populations (1) before and (2) after CRISPR editing. The crossed-out number “3” indicates that we were unable to obtain double homozygous knockout mutants Grpr/Cdh1. Statistical analysis was performed using t-test. h, Relative mRNA Grpr expression in doxycycline-inducible shRNA-expressing 1057 melanoma cells. i, Relative mRNA Ccn1 expression following GRP induction in 1057 melanoma cells. j,k, GRPR mRNA levels in mouse (j) and human (k) melanoma cell lines, normalized in TPM and log-transformed for visualization. Ct = control – cells transfected with an empty expression vector. l,m, Fold change in CCN1 mRNA levels after 4 h 10 nM GRP. Fold changes were calculated for each biological replicate based on TPM-normalized CCN1 expression. Statistical analysis was performed using one-way ANOVA with a Tukey’s post test. n,o, Relative growth (au) of 1057 melanoma cells in response to GRP and/or GRPR inhibitors (n) PD-176252 (PD) and (o) RC-3095 (RC) assessed via MTT assay. p,q, Ex vivo stability of RC-3095 (red) and PD-176252 (blue) in murine plasma (p) and liver microsomes (q). Statistical analysis was performed using t-test. r,s, Thorax radiance (r) and mean weight (s) 30 min post-injection in RC-treated and vehicle-treated groups after randomization. t, Representative IVIS images of C57BL/6 J mice intravenously injected with 1057-Luc melanoma cells from day (d) 0 to 31. At d31, a signal was detected in additional organs, and dissection revealed metastases in the liver, adrenal glands, and ovary outside of the lungs at this time. Scale bar = 1 cm. u, Luminescence imaging of lungs after euthanasia and dissection of RC-treated (#6 to #10) or untreated (#1 to #5) mice. Scale bar= 1 cm. Lum: luminescence, Dir: direct. Proportions were evaluated by Fisher’s exact test. Comparisons significance was assessed by two-sided Mann-Whitney adjusted in case of multiple comparisons with a Benjamini–Hochberg test. Expression data were assessed by a two-sided Student T-test on the log-normalised values. Data are represented as mean ± sd. Box plot represent the median and the 25–75 percentiles, the whiskers represent the minimum and the maximum. ≥ 3 independent biological replicates were performed per experiment. Source data
Extended Data Fig. 4
Extended Data Fig. 4. GRPR enhances melanoma cell growth and invasiveness.
a, Clonogenic growth of Grprneg melanoma cell line 1014: parental, control, and after exogenous Grpr expression. b-h, Effect of Grpr stimulation on growth of Grprpos and Grprneg mouse and human melanoma cell lines (b) 1064, (c) 1181-Ct, (d) 501mel-Ct, (e) 1014-Ct, (f) 1181-Grpr, (g) 501mel-GRPR, and (h) 1014-Grpr. Cell quantification presented as mean ± SD. 1181 and 501mel are GRPRneg cells. i-k, Anoikis resistance score based on RNA-seq TPM-normalized data for GRPRpos murine (i) 1057 and (j) 1064, and human (k) Dauv-1 melanoma cell lines. l-n, Invasive score from RNA-seq TPM-normalized data for GRPRpos murine 1057 (l), 1064 (m), and human Dauv-1 (n) melanoma cell lines. o-t, Resistance to anoikis assays showing apoptotic (apop.) cell percentage after 48 h without matrix attachment. 1181-Ct (o), 501mel-Ct (p), 1181-Grpr (q), 501mel-GRPR (r), 1014 (s), and 1062 (t) cells treated with 10 nM GRP, 1 μM RC-3095 or no treatment. u-af, Invasion assays indicating the number (nb) of invading cells (invad.). u, Invasion assay of 1057 mouse melanoma cells, with DAPI-stained nuclei after crossing the Matrigel layer. Scale bar = 500 µm. v-y, Quantification of invading cells after GRP induction (10 nM) with or without RC-3095 in male Ecad 1181 (v), female Ecad 1039 (w), male ΔEcad 1456 (x), and female ΔEcad 1057 (y). z-af, Invasion assay in Matrigel® (200 µg/mL) for 1064 (z), 1014-Ct (aa), 1181-Ct (ab), 501mel-Ct (ac), 1014-Grpr (ad), 1181-Grpr (ae), and 501mel-GRPR (af) murine and human melanoma cells. Cells were starved overnight and treated with 10 nM GRP, 1 µM RC-3095 and/ or 10% FCS for 24 h (u-y, z-af), and for 48 h (b-h, o-t). Clonogenic assays were evalued by a Kruskall-wallis corrected by a Dunn’s post test. Effect of the GRP induction was assessed by two-sided Mann-Whitney adjusted for multiple comparisons with a Benjamini–Hochberg test. Data shown as mean ± SD. ≥ 3 independent biological replicates were performed per experiment. Source data
Extended Data Fig. 5
Extended Data Fig. 5. GRPR activation by GRP promotes the YAP1 transcriptional program.
a, Activation of kinases following GRPR activation by 10 nM GRP in GRPRpos melanoma cell line 1057, measured 15 min post-induction using the Pamgene® Ser/Thr kinase PamChip (STK). b, Gene set enrichment analysis (GSEA) of Gαq (left) and PKC (right) activation signatures 4 h after stimulating GRPRpos 1057 cells with 10 nM GRP. Gene expression, determined by RNA-seq, was normalized with DEseq2 before analysis. c-h, IP1 levels, indicating Gαq/11 activation, measured in mouse melanoma cell lines after 10 nM GRP stimulation, with or without treatment with the GRPR inhibitor RC-3095 (c-h) or pre-treatment with the ERα inhibitor ICI-182,780 (c-f). i, YAP1 activation score correlated with GRPR expression in TCGA-SKCM melanoma data. TPM: transcripts per million. j, GSEA of YAP1 activation signature in mouse primary melanoma tumors: ∆Ecad vs Ecad female tumors and male tumors. RNA-seq data normalized with DEseq2 before GSEA. k, Western blot showing Yap1 protein levels in mouse melanoma cell lines. Actin as loading control. Data from one representative experiment of three biological replicates. l, Yap1 mRNA expression in melanoma cell line with or without ectopic Grpr and controls not expressing Grpr (1014-Ct, 1014-Grpr, 1181-Ct, 1181-Grpr). m-q, GSEA of YAP1 activation in murine melanoma cell lines, 4 h after 10 nM GRP stimulation. RNA-seq data normalized using DEseq2 before GSEA. r-w, Yap1 score after GRP induction in murine melanoma cells treated with vehicle, 10 nM GRP, 1 µM RC, or both. x-z, GSEA of YAP1 activation in human melanoma cell lines, 4 h after 10 nM GRP stimulation. RNA-seq data normalized using DEseq2 before GSEA. aa-ac, Yap1 score in human melanoma cells treated with vehicle, 10 nM GRP, 1 µM RC, or both. GRP effect on the IP1 level was assessed by two-sided Mann-Whitney adjusted for multiple comparisons with a Benjamini–Hochberg test. Significance of the expression was assessed by a tow-sided t-test on the log-normalized data. Significance of the scores was evaluated on the Zscore data by ANOVA adjusted by a Tukey’s test. Data are presented as mean ± SD. Source data
Extended Data Fig. 6
Extended Data Fig. 6. Loss of Ecad in melanoma cells induces β-catenin activity and Esr1 promoter activation.
a-e, ChIP-seq tracks for H3K27ac in male and female NRAS murine melanoma cells with or without Ecad. Known β-catenin target genes: (a) Apcdd1, (b) Axin2, (c) Nkd1, (d) Notum, and (e) Sp5. f-j, Expression of β-catenin targets (Apcdd1, Axin2, Nkd1, Notum, and Sp5) in male and female mouse melanoma cells with or without not Ecad. k,l, Expression of Ctnnb1 mRNA as determined by RT-qPCR in Ecad mouse 1014 melanoma cells transfected with (k) with siScr or siCdh1 in the presence of β-catenin and (l) pcDNA3 (bcat -) or with a β-catenin expression vector (bcat +) known as bcat*. m, Effect of β-catenin activation via siCdh1 on Cdh1, Axin2, and Esr1 expression in three mouse melanoma cell lines. n, Effect of β-catenin activation using siApc on Apc, Axin2, and Esr1 expression in three mouse melanoma cell lines. o, RT-qPCR analysis of Nkd1, Axin2, Esr1, and Grpr mRNA levels in ΔEcad mouse 1057 melanoma cells treated with siRNA targeting Ctnnb1 and the pharmacological β-catenin inhibitor iCRT3 (10 μM, 48 h). p, β-catenin binding to Esr1 in nephron precursor cells with significant peaks (called by MACS2) indicated. Genomic locations are based on the mm10. q,r, RT-qPCR (q and Western blot (r) of Esr1 levels in Daju human melanoma cells treated with the β-catenin inhibitor iCRT3 (80 μM, 48 h). s, Invasion assays of Grpr-expressing mouse melanoma cells (1057), treated 24 h with siScr, siCtnnb1, iCRT3 and/or GRP. t,u RT-qPCR of CDH1 levels in human melanoma cells treated with siCDH1 (t). Western blot analysis of ERα protein levels in human melanoma cells after CDH1 knockdown-three biological replicates (u). Relative ERα levels are shown quantified in the histogram. Comparisons significance was assessed by two-sided Mann-Whitney with a Benjamini–Hochberg test. Expression data were assessed by a two-sided Student T-test on the log-normalised values. Zscores were analysed by ANOVA corrected by a Tukey’s test. Data are represented as mean ± SD. ≥ 3 independent biological replicates were performed for each experiment. Source data
Extended Data Fig. 7
Extended Data Fig. 7. Esr1 induces Grpr expression and cell invasion.
a,b, GSEA comparing ERα expression (a) and activation (b) signatures between murine ∆Ecad and Ecad female primary melanoma. c, Quantification of Esr1 mRNA level by qRT-PCR and normalized to Hprt expression in various cell lines. d, Localization of the Grpr region on the mouse X chromosome, with three upstream regions ERα binding regions (Peak1-3, green boxes) identified through 3D interaction e, ChIP-seq tracks for H3K27ac in male and female NRAS murine melanoma cells with or without Ecad in Peak1-3 regions, showing ERα binding peaks from mouse uterus ChIP-seq data (GSM894054). Stars indicate peaks identified by MACS2. f,g, Impact of ESR1 silencing (f) and overexpression (g) on GRPR expression in human melanoma cell lines. Statistical analysis was performed using t-test. h, Consequences of CDH1 and/or ESR1 silencing on GRPR expression in CDH1pos human melanoma cells. i, Schematic representation of the CDH1 knockout strategy. Exons 6 to 10 were deleted using two distinct guide RNAs (gRNA1 and gRNA2). j, mRNA expression levels of CDH1, ESR1, and GRPR in the 888-Mel cell population transfected with gRNA targeting CDH1. Statistical analysis was performed using t-test. k, Western blot analysis (left) and quantification (right) of ERα and E-cadherin (ECAD) protein levels in the 888-Mel cell population transfected with gRNA targeting CDH1. β-Actin and Vinculin (Vinc.) were used as loading controls. Statistical analysis was performed using a t-test. l, quantification of the western blot analysis of E-cadherin and ERα protein levels in mouse 1014 melanoma cells 48 h after knockdown with siScr (control), siCdh1 (targeting E-cadherin), or siESR1 (targeting ERα) presented in Fig. 5i. m, Impact of ERα activation (100 nM β-estradiol, E2) or degradation (1 µM ICI 182,780) on GRPR expression in ESR1pos 1057 melanoma cells after estrogen starvation for four days. n, Quantification of the western blot analysis of (ECAD) expression in 501mel cells, expressing or not GRPR, in the presence or absence of 10 nM GRP presented in Fig. 5j. o, mRNA CDH1 levels in melanoma cells expressing GRPR, measured in the presence or absence of GRP and/or RC-3095. TMM = Trimmed Mean of M-values. For expression data, significance was evaluated by two-sided Student T-test (two groups) or ANOVA adjusted by a Tukey’s test (multiple groups) on the log-normalised data. Data are represented as mean ± SD. ≥ 3 independent biological replicates were performed per experiment. *p < 0.05, **p < 0.01, ***p < 0.001, and ****p < 0.0001. Source data
Extended Data Fig. 8
Extended Data Fig. 8. Graphical abstract.
a, In primary melanoma, the loss of CDH1 activates β-catenin signaling, subsequently triggering the upregulation of ESR1. Consequently, ERα stimulates the expression of GRPR, particularly potent in the presence of estrogen (E2), especially during the period between puberty and menopause. Activation of GRPR by GRP subsequently reduces CDH1 expression, thereby reinforcing this loop and resulting in elevated levels of GRPR expression. ERa and GRPR inhibitors have the potential to affect this loop of regulation. b, ECADneg/GRPRpos cancer cells grow in tissues expressing naturally GRP including lung, breast and gastric tissue. c, ECADneg/GRPRpos melanoma cells gain the ability to disseminate through the bloodstream to distant organs, notably the lungs, where GRP is produced in abundance. Within the lungs, the interaction between GRP and GRPR initiates pro-metastatic signaling in melanoma cells.
Extended Data Fig. 9
Extended Data Fig. 9. GRP and ERα modulate melanoma cell invasion and in a sex- and E-cadherin–dependent manner.
a, Invasion assay of 1057 mouse melanoma cells, quantified by counting DAPI-stained nuclei that migrated through the Matrigel layer. Scale bar = 500 µm. b-e, Quantification of invading cells in various melanoma cell lines: male Ecad 1181 (b), female Ecad 1039 (c), male ΔEcad 1456 (d), and female ΔEcad 1057 (e) treated with 10 nM GRP, 1 μM RC-3095, and/or 1 μM ICI. f, Western blot analysis of ERα protein levels in mouse melanoma cells treated or not with ICI (1 μM, 24 h) with actin as loading control. g, Histograms showing ERα quantification from three independent biological experiments. GRP-induction significance was assessed by two-sided Mann-Whitney adjusted with a Benjamini–Hochberg test. Quantification was evaluated by ANOVA on the log transformed data. Data are represented as mean ± SD. ≥ 3 independent biological replicates were performed per experiment. Source data
Extended Data Fig. 10
Extended Data Fig. 10. The CDH1/CTNNB1/ESR1/GRPR Axis Is Active in Breast Carcinomas.
a,b, Expression of GRPR (a) and ESR1 (b) mRNA in breast carcinoma from TCGA-BRCA data based on CDH1 genetic status. c, ERα activation score according to the CDH1 genetic status in breast cancer tumors from TCGA data. d, Quantification of ERα positivity in breast carcinomas from the TCGA-BRCA cohort by IHC based on CDH1 mutation. e, Expression of GRPR based on ERα status defined by TCGA pathologists using immunohistochemistry in human breast carcinomas from the TCGA-BRCA studies. f, Correlation between GRPR expression and the ERα activity score calculated from the same breast tumors from the TCGA-BRCA studies. g, Localization of the GRPR region on the human X chromosome (top) and identification of five regions with chromatin openness (H3K27ac) and ERα binding revealed by 3D interaction with the GRPR locus in MCF7 breast cancer cells. h, Genome browser view of ChIP-seq tracks for H3K27ac, ATAC-seq, and E2-activated ERα in MCF7 breast cancer cells on the five regions. Three regions/peaks (1-3) are conserved between humans and mice. i, Effects of CDH1 and/or ESR1 silencing on GRPR expression in CDH1-positive MCF7 human breast cancer cells. (see legend of Fig. 5h for more information). j, Effect of ESR1 stimulation (17β-estradiol, 100 nM) and inhibition (ICI 182,780, 1 µM) on mRNA GRPR expression in MCF7 cells. Expression were compared with a Student T-test (two groups) or anova with Tukey’s posttest (multiple groups) performed on the log-transformed data. Proportions were analyzed by Chi-square and correlation by Pearson. All panels, ns = not significant, *p < 0.05, **p < 0.01, ***p < 0.001, and ****p < 0.0001. The relative mRNA levels in (a, c, d, and g) are presented as Log10 (TPM + 0.01). ≥ 3 independent biological replicates were performed per experiment. Box plot represent the median and the 25–75 percentiles, the whiskers represent the minimum and the maximum. Source data

References

    1. Dong, M. et al. Sex differences in cancer incidence and survival: a pan-cancer analysis. Cancer Epidemiol. Biomarkers Prev.29, 1389–1397 (2020). - PubMed
    1. Ye, Y. et al. Sex-associated molecular differences for cancer immunotherapy. Nat. Commun.11, 1779 (2020). - PMC - PubMed
    1. Vellano, C. P. et al. Androgen receptor blockade promotes response to BRAF/MEK-targeted therapy. Nature606, 797–803 (2022). - PMC - PubMed
    1. Zhao, Y., Wang, X., Liu, Y., Wang, H.-Y. & Xiang, J. The effects of estrogen on targeted cancer therapy drugs. Pharmacol. Res.177, 106131 (2022). - PubMed
    1. Rubin, J. B. et al. Sex differences in cancer mechanisms. Biol. Sex Differ.11, 17 (2020). - PMC - PubMed

MeSH terms

LinkOut - more resources