. 2025 Jul;643(8071):468-477.
doi: 10.1038/s41586-025-09097-6. Epub 2025 Jun 11.

Metabolic adaptations direct cell fate during tissue regeneration

Affiliations

Metabolic adaptations direct cell fate during tissue regeneration

Almudena Chaves-Perez et al. Nature. 2025 Jul.

Erratum in

Abstract

Although cell-fate specification is generally attributed to transcriptional regulation, emerging data also indicate a role for molecules linked with intermediary metabolism. For example, α-ketoglutarate (αKG), which fuels energy production and biosynthetic pathways in the tricarboxylic acid (TCA) cycle, is also a co-factor for chromatin-modifying enzymes1-3. Nevertheless, whether TCA-cycle metabolites regulate cell fate during tissue homeostasis and regeneration remains unclear. Here we show that TCA-cycle enzymes are expressed in the intestine in a heterogeneous manner, with components of the αKG dehydrogenase complex4-6 upregulated in the absorptive lineage and downregulated in the secretory lineage. Using genetically modified mouse models and organoids, we reveal that 2-oxoglutarate dehydrogenase (OGDH), the enzymatic subunit of the αKG dehydrogenase complex, has a dual, lineage-specific role. In the absorptive lineage, OGDH is upregulated by HNF4 transcription factors to maintain the bioenergetic and biosynthetic needs of enterocytes. In the secretory lineage, OGDH is downregulated through a process that, when modelled, increases the levels of αKG and stimulates the differentiation of secretory cells. Consistent with this, in mouse models of colitis with impaired differentiation and maturation of secretory cells, inhibition of OGDH or supplementation with αKG reversed these impairments and promoted tissue healing. Hence, OGDH dependency is lineage-specific, and its regulation helps to direct cell fate, offering insights for targeted therapies in regenerative medicine.


Conflict of interest statement

Competing interests: A patent application (PCT/US2024/027206) has been published as WO2024229094A1 ( https://patents.google.com/patent/WO2024229094A1/en?oq=PCT%2fUS2024%2f027206 ; ref. 50). The patent covers methods for treating gastrointestinal inflammatory diseases using αKG modulators. A.C.-P. and S.W.L. are listed as inventors. S.W.L. is a founder and member of the scientific advisory board of Blueprint Medicines, Mirimus, ORIC Pharmaceuticals, Senescea, and Faeth Therapeutics, is on the scientific advisory board of PMV Pharmaceuticals and is a consultant for Fate Therapeutics. The remaining authors declare no competing interests.

Figures

Fig. 1
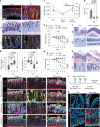
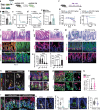
Fig. 1. Metabolic divergence in intestinal lineages.
a, AddModule Score showing average expression of the TCA-cycle signature across the indicated intestinal lineages in human small intestine. Each dot represents a cell. b, Heat map showing the transcriptional expression of lineage-specific markers and TCA-cycle enzymes in distinct intestinal cell populations by qPCR analysis. Paneth cells, ISCs and the absorptive lineage (villus fraction) were sorted from Lgr5-GFP reporter mice (n = 4). c, smFISH visualizing RNA of Ogdh and lineage-specific markers in intestinal tissue from C57Bl/6 mice. Dashed lines outline crypt and villus structures in the intestinal epithelium. Results are representative of three independent experiments. d, Immunofluorescence showing Ogdh expression in ISC-enriched organoids and organoids from the indicated lineages at two stages of maturation. Results are representative of three independent experiments. e, Principal component analysis (PCA) of metabolite profiles from LC–MS/MS on organoids enriched for ISCs, secretory progenitors (pSec1 (goblet cell progenitors) and pSec2 (Paneth cell progenitors)) and pAbs. f, Heat map depicting the levels of TCA-cycle metabolites in organoids enriched for different intestinal progenitors relative to ISC-enriched organoids. αKG/Suc represents the ratio of αKG to succinate (Suc). g, Ratio of corrected abundance of the indicated fractions in pSec- versus pAbs-enriched organoids after glutamine isotopologue tracing. Data are representative of two independent experiments (n = 10 mice). h, Schematic of differences in the TCA cycle between absorptive and secretory lineages. For all organoid experiments, replicates were generated by isolating and pooling crypts from five mice and plating and culturing each pool in triplicate in a separate well. This figure is adapted from our published patent (WO2024229094A1). Data are mean ± s.e.m. Statistical significance was determined by Wilcoxon test in a (Supplementary Table 1) and two-tailed t-test in g. Asterisks indicate statistical significance (*P < 0.05, **P < 0.01, ****P < 0.0001; NS, not significant). TA, transit amplifying; TA2, transit amplifying 2; EarlyAE, early absorptive enterocytes; AE2, absorptive enterocytes 2; Sec_prog, secretory progenitors; EEC, enteroendocrine cells. Scale bars, 10 μm (d), 30 μm (c). Source Data
Fig. 2
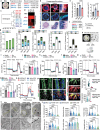
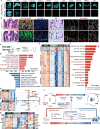
Fig. 2. Differential role of OGDH in cell fate.
a, Diagram of Ogdh suppression experiments in ISC-enriched organoids derived from TRE-shRenCag-rtTA3, TRE-shOgdhCag-rtTA3 or wild-type mice. ISC-enriched organoids were grown in ENR-CV medium (C, CHIR2099; ENR, EGF, Noggin and R-spondin; V, valproic acid) for six days, then treated with doxycycline (Dox) (TRE-shRenCag-rtTA3 and TRE-shOgdhCag-rtTA3) or DM-αKG (wild type) while switching to ENR medium to facilitate differentiation into all intestinal lineages. Created in BioRender. Chaves-perez, A. (2025) (https://BioRender.com/dimozin). b, Heat map showing early changes in late-TA and secretory-lineage signatures from RNA-seq analysis of organoids from TRE-shRenCag-rtTA3 and TRE-shOgdhCag-rtTA3 mice treated with doxycycline or DM-αKG for 72 h. Two different hairpins were used for TRE-shOgdhCag-rtTA3 mice (346 and 2081). Each column represents organoids derived from three mice. c, Immunofluorescence and staining in organoids from b, showing cell proliferation (Ki67), cell death (cleaved caspase 3; CC3) and lineage-specific markers (ACE2, enterocytes; ABP, goblet cells; lysozyme, Paneth cells) after six days of the indicated treatments. d, Experimental schematic for Ogdh suppression and exogenous αKG supplementation studies in progenitor-enriched organoids. ISC-enriched organoids were cultured for six days in ENR-CV medium, then differentiated for three days in the pertinent lineage-specific medium (C, CHIR2099; D, DAPT; ENR, EGF, Noggin and R-spondin; I, IWP2; V, valproic acid). Subsequently, they were treated with either doxycycline (TRE-shRenCag-rtTA3 and TRE-shOgdhCag-rtTA3 organoids) or DM-αKG (TRE-shRenCag-rtTA3 organoids). Organoids were cultured in the appropriate lineage-specific differentiation medium for six days to direct differentiation into the desired cell lineage. Created in BioRender. Chaves-perez, A. (2025) (https://BioRender.com/dimozin). e, Immunofluorescence in progenitor-enriched control (TRE-shRenCag-rtTA3), OGDH-depleted (TRE-shOgdhCag-rtTA3) or αKG-treated (TRE-shRenCag-rtTA3) organoids showing cell death (cleaved caspase 3) after eight days in culture. This figure is adapted from our published patent (WO2024229094A1). Scale bars, 10 μm (c,e).
Fig. 3
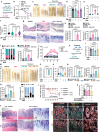
Fig. 3. Metabolic and epigenetic divergence in intestinal progenitors.
a, Immunofluorescence in C57Bl/6 progenitor-enriched organoids showing TET and 5hmC expression. b, Steady-state levels of αKG and αKG/succinate ratio by LC–MS in ISC-enriched and progenitor-enriched organoids. Each dot represents a replicate, generated by isolating and pooling crypts from five mice and plating each in triplicate in a separate well. Data are representative of two independent experiments (n = 10 mice). c, Oxygen consumption rate (OCR) in organoids derived from TRE-shRenCag-rtTA3 or TRE-shOgdhCag-rtTA3 mice (n = 4 for shRen and n = 4 for shOgdh). Olig., oligomycin; R+A, rotenone and antimycin. d, ATP production in TRE-shRenCag-rtTA3 or TRE-shOgdhCag-rtTA3 mice as measured on a Seahorse instrument (n = 4). Each dot represents one mouse. e, Succinate, fumarate, aconitate and citrate shown as fractional labelling with 13C5-glutamine (n = 3 per condition) in organoids from TRE-shOgdhCag-rtTA3 mice, with or without doxycycline treatment for 72 h. Each dot represents a replicate, generated as explained in b. Data are representative of two independent experiments (n = 10). f, Immunofluorescence for HNF4α and 5hmC in crypts in tissue sections from C57Bl/6 mice. Dashed lines outline 5hmC+HNF4α cells. Scale bar, 20 μm. g, Lack of colocalization between HNF4α and 5hmC in tissues derived from f. Each dot represents one mouse (n = 5). h, 5hmC and HNF4α expression in individual cells from tissue sections obtained from f. Each dot represents one cell (n = 5 mice). i,j, Expression of Turbo–GFP reporter in the indicated intestinal lineages (i) and GFP/luciferase ratio in enterocytes at 72 h (j) electroporated with a reporter construct containing either wild-type or Hnf4a-mutant binding sites in the Ogdh promoter (n = 3 mice; 8 wells per mouse). RFI, relative fluorescence intensity; RLU, relative luminescence units. The box represents the interquartile range (IQR) with the median as a central line. Whiskers extend to 1.5 × IQR beyond Q1 and Q3. This figure is adapted from our published patent (WO2024229094A1). Data are mean ± s.e.m. Statistical significance was determined by one-way ANOVA followed by Tukey’s honestly significant difference (HSD) test in b,g, two-tailed t-test in d,e,j and two-way ANOVA followed by Tukey’s HSD test in c. Asterisks indicate statistical significance (**P < 0.01). Scale bars, 10 μm (a,i), 50 μm (f). Source Data
Fig. 4
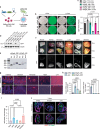
Fig. 4. Role of OGDH in gut homeostasis.
a,b, ABP and immunofluorescence for lysozyme, GFP and cleaved caspase 3 (CC3) in intestinal tissue from TRE-shRenCag-rtTA3 and TRE-shOgdhCag-rtTA3 mice (a) and vehicle-treated and DM-αKG-treated mice (b) at the indicated time points. c, Heat map depicting time-course quantification (D indicates day) of OGDH (fluorescence intensity), BrdU (positive cells), Spdef (mRNA levels), lysozyme (Lyz) (positive cells) and CC3 (positive cells) in intestinal crypts from doxycycline-treated TRE-shRenCag-rtTA3 and TRE-shOgdhCag-rtTA3 mice or DM-αKG-treated C57Bl/6 mice (n = 5 per group). d,e, ABP and immunofluorescence for OGDH, lysozyme (Paneth cells), HNF4α (enterocytes) and ACE2 (mature enterocytes) (d), and CC3 (cell death) (e) in intestinal sections from TRE-shOgdhCag-rtTA3 mice concomitantly treated with or without DM-succinate and doxycycline for 6–7 days. Data are representative of shRen n = 3, shRen + succinate n = 3, shOgdh n = 8 and shOgdh + succinate n = 4 mice. f, Quantification from e. Each dot represents one crypt or villus for lysozyme and CC3 and one mouse for HNF4α. a.u., arbitrary units. g, Immunofluorescence for 5hmC and HNF4α in crypts from TRE-shRenCag-rtTA3, TRE-shOgdhCag-rtTA3 and DM-αKG-treated mice. Dashed lines outline crypts (top) and 5hmC+HNF4α cells (bottom). h, Top, enzyme-linked immunosorbent assay (ELISA) of crypt lysates to measure intestinal 5hmC abundance in TRE-shRenCag-rtTA3, TRE-shOgdhCag-rtTA3, DM-αKG-treated and vehicle-treated mice. Each dot represents one mouse (shRen n = 4, shOgdh n = 9, vehicle n = 4, αKG n = 6). Bottom, relative 5hmC levels in the Spdef promoter within isolated crypts from shRenCag-rtTA3, TRE-shOgdhCag-rtTA3 and DM-αKG-treated mice, measured by qPCR at the indicated time points. Each dot represents one mouse (n ≥ 3 mice per group). i, Venn diagrams of upregulated (red) and downregulated (blue) genes in TRE-shOgdhCag-rtTA3 and αKG-treated mice versus controls (TRE-shRenCag-rtTA3 and vehicle-treated), with gene ontology (GO) analysis of the overlapping genes. Abs(score), absolute value of enrichment score. This figure is adapted from our published patent (WO2024229094A1). Data are mean ± s.e.m. Statistical significance was determined using one-way ANOVA followed by Tukey’s HSD test in f and two-tailed t-test in h. Source Data
Fig. 5
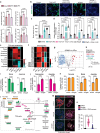
Fig. 5. Metabolic interventions to treat ulcerative colitis.
a, ABP staining and immunofluorescence for OGDH, Ki67 and 5hmC in colon samples from mice with or without colitis induced by DSS. Dashed lines outline colonic crypts. b, ABP levels and OGDH expression over time in mice treated with DSS (n ≥ 5). The box represents the IQR and the central line represents the median. Whiskers extend to 1.5 × IQR beyond Q1 and Q3. R, recovery (15 days). c, Relationship between αKG levels (measured by LC–MS from colonic samples) and secretory cell abundance (measured as number pixels of ABP staining) in DSS-treated mice over time (n ≥ 4 per time point and condition). d, ELISA from whole-colon lysates to measure 5hmC abundance in DSS-treated mice. Each dot represents one mouse (n ≥ 4). e, Body weight (relative to initial body weight) in the indicated conditions (vehicle n = 4, shOgdh n = 5, DSS n = 7, DSS + shOgdh n = 11). f, Haematoxylin and eosin (H&E) and ABP staining of colonic samples isolated from DSS-treated mice or DSS-treated mice with pulsatile OGDH inhibition at day 9. g, Body weight under the specified conditions, relative to body weight at baseline (vehicle n = 30, αKG n = 15, DSS n = 35, DSS + αKG n = 15). h, H&E and ABP staining of colonic sections from DSS-treated or DSS-and-αKG-treated mice at day 9. i, Multiplex immunofluorescence under the specified conditions, revealing the architecture and cell composition of the tissue microenvironment, epithelial compartment and epigenetic landscape in DSS-and-αKG-treated-treated mice. CK, pan-cytokeratin; Vim, vimentin; αSMA, α-smooth muscle actin. Scale bar, 50 μm. j, Experimental design to trace secretory progenitors (ATOH1+ cells) using an Atoh1-CreERT2 line crossed with an LSL Kate reporter mouse. i.p., intraperitoneal; Tam, tamoxifen. k, Immunofluorescence for Kate (progeny of ATOH1+ cells) and EphB2 (colonic stem cells) under the specified conditions. The dashed lines indicate the boundary between DSS and DSS + αKG intestines within the same slide. Scale bar, 400 μm. This figure is adapted from our published patent (WO2024229094A1). Data are mean ± s.e.m. Statistical significance was determined by one-way ANOVA followed by Tukey’s HSD test in b,d and two-way ANOVA followed by Tukey’s HSD test in e,g. Source Data
Extended Data Fig. 1
Extended Data Fig. 1. Characterization of OGDH expression in the gut.
a, UMAP derived from publicly available scRNA-seq data demonstrating distinct transcriptional signatures in various subpopulations of human intestinal and colonic cells. b, AddModule Score showing average expression of the TCA-cycle signature across the indicated intestinal lineages human small intestine. Each dot represents a cell. c, Dot plot showing TCA-cycle enzyme gene expression across intestinal cell types from publicly available scRNA-seq data. Colour intensity indicates expression levels and dot size indicates the percentage of positive cells in each lineage. Paneth cells were sorted as GFP-, FSC-A-high and ISCs were sorted as GFP-high from Lgr5-EGFP reporter mice. d, Single-molecule in situ fluorescence (smFISH) visualizing RNAs of the indicated TCA-cycle enzymes in intestinal tissue samples from C57Bl/6 mice. Dashed lines outline crypt structure and specific lineages within the crypt. e, Representative immunofluorescence results from intestinal tissues from Lgr5-EGFP mice showing GFP (LGR5; marking ISCs), OGDH, Lyz (Paneth cells) and ACE2 (enterocytes). f, Quantification of the percentage of OGDH-expressing cells in the indicated intestinal lineages. Each dot represents a mouse (enterocytes n = 17; ISCs n = 9; Paneth cells n = 9). gi, Receiver operating characteristic (ROC) curve analysis assessing the sensitivity and specificity of OGDH as a marker of enterocytes (g), ISCs (h) and Paneth cells (i). Statistical analysis: data are presented as mean ± s.e.m. The box represents the interquartile range (IQR) with the median as a central line. Whiskers extend to 1.5×IQR beyond Q1 and Q3. This figure is adapted from our published patent (WO2024229094A1). Significance was determined by Wilcoxon test in b (see Supplementary Table 1), one-way ANOVA followed by Tukey’s HSD test in f and Wilson/Brown test in gi. Asterisks indicate statistical significance (*P < 0.05, **P < 0.01, ***P < 0.001). Source Data
Extended Data Fig. 2
Extended Data Fig. 2. Mitochondrial activity and TCA-cycle characterization in intestinal lineages.
a, Strategy for metabolic experiments using various ENR media to culture and differentiate intestinal progenitor organoids. b, Immunofluorescence and ABP staining in progenitor-enriched and mature organoids: ACE2 marks enterocytes; Lyz marks Paneth cells; ABP marks goblet cells. c, Hierarchical clustering dendrogram of LC–MS metabolites from intestinal organoids. d, Heat map of bioenergetic metabolites in intestinal progenitors relative to ISCs. e, LC–MS analysis of steady-state αKG and citrate levels in organoid-derived intestinal lineages. Each dot represents a replicate, generated by pooling crypts from five mice and culturing in a separate well. Data are representative of two independent experiments (n = 10 mice). f, Isotopologue tracing in organoids. g, LC–MS analysis of αKG, citrate and pyruvate labelling from 13C6-glucose or 13C5-glutamine. Levels are shown as peak area x fractional labelling (n = 3/condition). Results are representative of two independent experiments (n = 10 mice). h, Micrograph of organoids in a Seahorse plate for MitoStress and Substrate oxidation assays. Created in BioRender. Chaves-Perez, A. (2025) https://BioRender.com/0m4ci27. in, Oxygen consumption rate (OCR) (i,k,m,n) and spare respiratory capacity (SRC) (j,l) from substrate oxidation assays in organoid-derived intestinal lineages (n = 5). Inhibitors: Etomoxir (Eto; fatty acid oxidation), UK5099 (mitochondrial pyruvate carrier), BPTES (glutamine oxidation). o, OCR from MitoStress analysis in progenitor lineages. For io, data represent two independent experiments (n ≥ 3 mice/lineage). p,q, Immunofluorescence in intestinal tissues from C57Bl/6 (p) and Lgr5-EGFP (q) mice, showing lysozyme (Paneth), VDAC (mitochondria), β-catenin (membrane), and GFP (ISCs). Dashed lines delineate cells of a specific lineage. r, Quantification of VDAC intensity in ISCs, enterocytes and Paneth cells. Each dot represents an independent crypt (n = 4 mice). s, Electron microscopy images of mitochondria in various intestinal lineages from C57Bl/6 mice. Dashed lines delineate cells of a specific lineage. t, Quantification of multiple mitochondria parameters from s. Each dot represents a cell for the specified lineage. This figure is adapted from our published patent (WO2024229094A1). Statistical analysis: data are presented as mean ± s.e.m. Statistical significance was determined by one-way ANOVA followed by Tukey’s test in e,j,l,n,r (bottom graph) and t. OCRs were analysed using a two-way ANOVA followed by Tukey’s HSD test. Asterisks indicate statistical significance (*P < 0.05, **P < 0.01, ***P < 0.001). Abbreviations: pAbs=absorptive progenitors; C = CHIR2099; D = DAPT; ENR = EGF/Noggin/R-spondin; I = IWP2; pSec1=goblet progenitors; pSec2=Paneth progenitors; R + A=Rotenone + Antimycin A; V=Valproic acid. Source Data
Extended Data Fig. 3
Extended Data Fig. 3. Effect of glycolysis inhibition in ISCs.
a, ATP rate assay in ISCs- and pAbs-enriched organoids showing the production of ATP through OXPHOS (MitoATP) or glycolysis (GlycoATP) in organoids. Each dot represents an independent experiment where five mice (n = 5) were pooled, and each lineage in each experiment was plated as 8 technical replicates. b, LC–MS was used to determine the steady-state level and fraction of glucose/ fructose 6-phosphate and 3-phosphoglycerate from 13C6-glucose. Glucose/ fructose 6-phosphate and 3-phosphoglycerate levels are shown as peak area in arbitrary units (a.u.) x fractional percentage of labelling with each tracer (n = 3/condition). Results are representative of 2 independent experiments. c, Experimental design for glycolysis inhibition in C57Bl/6 mice. d, H&E staining and immunofluorescence of ISCs (OLFM4+ cells) of control and 2-deoxyglucose (2-DG)-treated mice after one month of treatment. e, Quantification of mean OLFM4+ cells per crypt from (c). Each dot represents one mouse (n = 5). At least 30 crypts were analysed per mouse. f, Gene set enrichment analysis (GSEA) showing downregulation of the ISC gene signature in intestinal tissue from 2-DG–treated mice compared with control mice. g, Heat map illustrating transcription of genes in the ISC signature in intestinal tissue from control and 2-DG treated mice. Each row represents an individual mouse. This figure is adapted from our published patent (WO2024229094A1). Statistical significance: data represent mean ± s.e.m. Statistical significance was determined by two-tailed t-test in e. In each panel, asterisks indicate statistical significance (***P < 0.001). Source Data
Extended Data Fig. 4
Extended Data Fig. 4. Generation of an inducible Ogdh-knockdown model.
a, Schema of engineering of TRE-shOgdh knockdown mouse model via the ‘speedy-mouse’ method (see Methods). Created in BioRender. Chaves-Perez, A. (2025) https://BioRender.com/8xmcqsn. b, GFP induction in shOgdh_346 and shOgdh_2081 mouse ES cells after a 48-h doxycycline treatment. c, qPCR quantification of Ogdh mRNA in shRenilla.713, shOgdh_346 and shOgdh_2081 mouse ES cells after the 48-h doxycycline treatment. Each dot represents an independent ES cell line (n = 3). d, Western analysis of mouse ES cells used to generate the mouse model, after the 48-hour doxycycline treatment. e, PCR showing wild-type genotype (248 bp) and knock-in genotype (300 bp). f, Representative bright-field and GFP fluorescence images of various organs from TRE-shOgdhCag-rtTA3 mice fed a normal or doxycycline (Dox) diet for 6 days. g, Representative immunofluorescent images showing OGDH in the indicated tissues on day 3 of doxycycline treatment in TRE-shOgdhrtTA3 and TRE-shRenillaCag-rtTA3 mice (n = 5). h, qPCR analysis of Spdef and Hnf4g mRNA expression in organoids derived from shRenCag-rtTA3 and TRE-shOgdhCag-rtTA3 mice, treated with either doxycycline or DM-αKG for 72 h. Each dot represents a different mouse (n = 3 mice). i, LC–MS analysis of αKG levels, depicted as fold changes in shOgdh versus pSec organoids. j, Representative immunofluorescent images of progenitor-enriched organoids from TRE-shRenCag-rtTA3, TRE-shOgdhCag-rtTA3, and DM-αKG-treated organoids, visualizing cell proliferation (Ki67) and cell death (Cl. Casp3) on day 3 of treatment. This figure is adapted from our published patent (WO2024229094A1). Statistical significance: data represent mean ± s.e.m. Statistical significance was determined using one-way ANOVA followed by Tukey’s HSD test in c,h,i. Asterisks denote significance (*P < 0.05, **P < 0.01, ***P < 0.001). Source Data
Extended Data Fig. 5
Extended Data Fig. 5. Metabolic analysis after OGDH downregulation.
a, αKG and L-2HG abundance, and αKG:2HG and αKG:L-2HG ratio in progenitor- and ISCs-enriched organoids. Each dot represents an independent replicate (n = 3). b, Immunofluorescence of 5hmC in organoids derived from C57Bl/6 mice or TRE-shOgdhCag-rtTA3 mice and treated with octyl-αKG or octyl-L-2HG for 4 days. c, Quantification of 5hmC levels in the organoids from b. Each dot represents a different mouse (n ≥ 3). d, qPCR for the organoids from b, depicting RNA expression of the indicated secretory markers. Each dot represents a different mouse (n ≥ 3). e,f, Metabolite abundance in the indicated intestinal progenitors relative to ISCs and in TRE-shOgdhCag-rtTA3 organoids relative to TRE-shRenCag-rtTA3 organoids. e, TCA-cycle metabolites. f, Bioenergetics. g, Volcano plot showing the differentially abundant metabolites when OGDH is depleted in organoids, highlighting differences in metabolite levels related to bioenergetics between the two lineages. h, Experimental design for isotopologue tracing in OGDH-depleted organoids. ik, Labelled fraction of the indicated metabolites obtained from 13C6-glucose or 13C5-glutamine in OGDH-depleted organoids. Data represent three independent replicates. To generate a replicate, crypts from 5 different mice were isolated, pooled, and then plated in triplicate in separate wells for the individual replicates. l, Schematic representation of carbon flux in OGDH-depleted organoids. m, Immunofluorescence showing OGDH and cell death (cleaved Casp3; CC3) and OGDH-depleted organoids derived from TRE-shRenCag-rtTA3 (control) or TRE-shOgdhCag-rtTA3 mice (n = 5) treated with DM-succinate for 8 days. n, Number of Cl. Casp3+ cells per organoid from m. Each dot represents an organoid. This figure is adapted from our published patent (WO2024229094A1). Statistical analysis: Data represent mean ± s.e.m. Statistical significance was determined using one-way ANOVA followed by Tukey’s HSD test in a,c,d,n, two-tailed t-test in ik. Asterisks denote statistical significance (*P < 0.05, **P < 0.01, ***P < 0.001). Source Data
Extended Data Fig. 6
Extended Data Fig. 6. HNF4 regulates Ogdh expression in enterocytes.
a, Immunofluorescent visualization of HNF4α in progenitor-enriched organoids derived from C57Bl/6 mice. The green channel was used for background. b, Schematic of potential binding sites for HNF4α in the Ogdh promoter. Positions are indicated relative to the transcriptional start site (TSS). The P value applies to both potential binding sites. c, HNF4α ChIP in isolated crypts from C57Bl/6 mice (n ≥ 4). DNA was immunoprecipitated using antibodies for HNF4α (positive binding) and SMAD4 (member of the same complex but lacking DNA-binding domains), then qPCR for the Ogdh promoter was run using 3 different primer pairs. Each dot represents a different mouse. d, HNF4α ChIP–seq data from published datasets showing HNF4 binding to the Ogdh promoter in human intestinal samples and crypts derived from C57Bl/6 mice. e, Design and sequence of reporter vectors containing wild-type or mutated HNF4-binding sites in the Ogdh promoter. f, Relative GFP intensity in colon cancer cell lines with wild-type or mutated HNF4-binding sites in the Ogdh promoter. Data represent three independent experiments. g, Design for generating an inducible vector with double hairpins to downregulate HNF4α and HNF4γ in mouse-derived organoids. h,i, qPCR for Ogdh (h) and the secretory markers Math1 and Defa1 (i) after Hnf4a and Hnf4g downregulation in ISC-enriched organoids. Data represent three independent replicates. To generate a replicate, crypts from 5 different mice were isolated, pooled, and then plated. Each replicate was independently transduced with the lentiviral construct and cultured in a separate well. j, Ogdh expression in intestinal crypts derived from Hnf4α/γDKO mice, along with a Venn diagram showing the overlap between HNF4α/γ-dependent genes and SMAD4-dependent genes, derived from published knockout studies. This figure is adapted from our published patent (WO2024229094A1). Statistical analysis: Data represent mean ± s.e.m. Statistical significance was determined using two-tailed t-test in c,i, one-way ANOVA followed by Tukey’s HSD test in h and two-way ANOVA followed by Tukey’s HSD test in f. Asterisks denote statistical significance (*P < 0.05, **P < 0.01, ***P < 0.001). Source Data
Extended Data Fig. 7
Extended Data Fig. 7. Role of OGDH in intestinal homeostasis in vivo.
a, Experimental design. OGDH depletion in TRE-shOgdhCag-rtTA3 mice was induced in adulthood. Created in BioRender. Chaves-Perez, A. (2025) https://BioRender.com/1nvuf0r. b, qPCR analysis of Ogdh expression in TRE-shOgdhCag-rtTA3 and TRE-shRenCag-rtTA3 mice after 3 days on doxycycline. Each dot represents a different mouse (n ≥ 5). c, Kaplan–Meier survival curves of TRE-shOgdhCag-rtTA3 (n = 5) and TRE-shRenCag-rtTA3 (n = 6) mice under doxycycline treatment. d, Body weight relative to weight at baseline in TRE-shOgdhCag-rtTA3 (n = 5) and TRE-shRenCag-rtTA3 (n = 6) mice. e, Weight of food in the stomachs of TRE-shOgdhCag-rtTA3 and TRE-shRenCag-rtTA3 mice after 8 days on doxycycline. Each dot represents a different mouse (n ≥ 5). f, Experimental schematic for DM-αKG injections in adult C57Bl/6 mice. Created in BioRender. Chaves-Perez, A. (2025) https://BioRender.com/dimozin. g, Body weight relative to weight at baseline in mice treated with vehicle or DM-αKG at indicated doses. h, Kaplan–Meier analysis of survival of mice treated with DM-αKG at the indicated doses or with vehicle. i, H&E and immunofluorescence for BrdU, GFP and OGDH after 3 days on doxycycline. j, H&E and immunofluorescence for HNF4α on day 6 of doxycycline treatment. Dashed lines outline crypt structures. k,l, Quantification of BrdU (k) and Cl. Casp3 (l) levels in intestinal sections during doxycycline treatment of TRE-shRenCag-rtTA3 and TRE-shOgdhCag-rtTA3 mice. Each dot represents a crypt (n = 5 mice). m, H&E and immunofluorescence for β-catenin (Bcat), BrdU and HNF4α in mice that received 7 days of injections of DM-αKG (600 mg/kg). Dashed lines outline crypt structures. n, Representative smFISH image visualizing RNAs of various differentiation markers in intestinal crypts from TRE-shOgdhCag-rtTA3 and TRE-shRenCag-rtTA3. Dashed lines outline crypt structures and specific lineages in the intestinal epithelium. o, Immunofluorescence for BrdU, β-catenin and lysozyme (Lyz) after a 2-hour BrdU pulse in mice treated with DM-αKG-treated or vehicle. Dashed lines outline specific lineages within the crypts. p, Hyperplex immunofluorescence in colonic sections control and αKG-treated mice in steady-state conditions, showing ATOH1 (marking secretory cells), EphB2 (stem cells) and MUC2 (mature secretory cells). q, Quantification of ATOH1+/EphB2+ double-positive secretory progenitors from p. r, ABP staining in TRE-shOgdhCag-rtTA3 and TRE-shRenCag-rtTA3 mice. s, Immunofluorescence and quantification of OLFM4 intensity (arbitrary units) in TRE-shOgdhCag-rtTA3 and TRE-shRenCag-rtTA3 mice at day 4 of treatment, and in vehicle- and DM-αKG-treated mice at day 7 of treatment. Each dot represents one crypt from n ≥ 4 mice. Dashed lines outline crypt structures. This figure is adapted from our published patent (WO2024229094A1). Statistical analysis: Data represent mean ± s.e.m. Statistical significance was determined using a two-tailed t-test in b,e,q,s. Survival probabilities were estimated using the Kaplan–Meier method, and statistical differences between the survival curves were assessed using the log-rank (Mantel–Cox) test in c,h. Two-way ANOVA followed by Tukey’s HSD test was used in d,g. One-way ANOVA followed by Tukey’s HSD test was used in k, l. Asterisks denote statistical significance (*P < 0.05, **P < 0.01, ***P < 0.001). Schematics created with BioRender.com. Source Data
Extended Data Fig. 8
Extended Data Fig. 8. OGDH downregulation increases secretory-lineage specification in vivo.
a, Intestine-specific expression of GFP in TRE-shRenVillin-rtTA3 mice. Representative images of GFP fluorescence of various organs from TRE-shRenCag-rtTA3 mice and TRE-shRenVillin-rtTA3 mice fed a doxycycline diet for 6 days. b, H&E, ABP staining and immunofluorescence of GFP, OGDH, Ki67, lysozyme (Lyz), and 5hmC in intestinal tissues after 5 days of doxycycline treatment in TRE-shOgdhVillin-rtTA3 and TRE-shRenillaVillin-rtTA3 mice. Dashed lines outline crypt structure. c, Design of RNA-seq experiments in isolated intestinal crypts. Created in BioRender. Chaves-Perez, A. (2025) https://BioRender.com/d8uy3en. d, Top upregulated and downregulated pathways in TRE-shOgdhCag-rtTA3 versus TRE-shRenCag-rtTA3 mice from GO analysis. e, Differential transcription in crypts from TRE-shOgdhCag-rtTA3 and DM-αKG-treated mice compared to TRE-shRenCag-rtTA3 and vehicle-treated mice respectively. The heat map shows genes associated with the secretory lineage, absorptive lineage (zone 1 and zone 2), Notch signalling pathway, and cell proliferation. Each column represents a single mouse. f, Top upregulated pathways in intestinal crypts of DM-αKG-treated versus vehicle-treated mice, derived from GO analysis. g, Heat map depicting expression of genes in the WNT pathway in crypts from TRE-shOgdhCag-rtTA3, TRE-shRenCag-rtTA3, vehicle-treated and DM-αKG-treated mice after 3 days of treatment. Each lane represents one mouse. h, Heat map depicting expression of transcription factors involved in lineage specification in crypts from TRE-shOgdhCag-rtTA3, TRE-shRenCag-rtTA3, vehicle-treated, and DM-αKG-treated mice at day 3 of treatment. i, Plot showing predicted transcription factors commonly upregulated (red dots) or downregulated (blue dots) in mice treated with TRE-shOgdhCag-rtTA3 versus DM-αKG. j, Schematic depicting the dual role of OGDH in differentiation in intestinal homeostasis. Created in BioRender. Chaves-Perez, A. (2025) https://BioRender.com/7osfp6n. This figure is adapted from our published patent (WO2024229094A1).
Extended Data Fig. 9
Extended Data Fig. 9. OGDH targeting as an intervention for ulcerative colitis.
a, Dot plot of RNA expression of TCA-cycle enzymes in human colon from publicly available scRNA-seq data. The plot compares non-inflamed and inflamed tissue from individuals with inflammatory bowel disease and tissue from healthy volunteers. Each column shows expression of the indicated TCA-cycle enzyme. Colour intensity indicates expression level and dot size indicates the proportion of positive cells in that lineage. b, Immunofluorescence for OGDH, Ki67 and 5hmC, along with ABP staining in TMAs of human intestinal samples from individuals with or without colitis. c,d, Quantification (c) and correlations of expression (d) of OGDH, Ki67 and ABP in normal mucosa, chronic inflammation, ulcerative colitis and Crohn’s disease, based on the TMAs shown in b. The top row shows all individuals, and the bottom row shows only those with chronic inflammation or normal mucosa. Correlation coefficients (r) were derived from Pearson correlation analysis. The lines represent the best-fit linear regression. The R² values indicate the proportion of the variance in disease severity that can be explained by the level of the particular biomarker. Each dot represents a patient. e, Representative images from multiplex immunofluorescence analysis of human TMAs, showing the immune compartment (CD45, CD3 and CD163) and the epithelial compartment (OGDH and PanCK) in healthy individuals and patients with ulcerative colitis. f,g, UMAP illustrating the diversity of cell types in healthy individuals and patients with ulcerative colitis (f) and protein distribution (g), identified through multiplex immunofluorescence analysis. Each point represents a single cell, colour-coded based on its cell-type classification or expression of the indicated protein. Distinct clusters highlight populations of cells with similar phenotypes. h, Experimental scheme of DSS-induced colitis treatment with pulsatile OGDH inhibition in mice. i, Kaplan–Meier survival curves for continuous versus pulsatile doxycycline treatment (3 days ON/4 days OFF/week) in TRE-shOgdhCag-rtTA3 mice. j, Representative images showing length of colons from TRE-shOgdhCag-rtTA3 mice on day 9 under different conditions. k,l, Colon length (k) and number of ulcers (l) at day 9 in the indicated conditions. Each dot represents an independent mouse (n ≥ 4). m, Body weight in TRE-shRenVillin-rtTA3 (n = 5) and TRE-shOgdhVillin-rtTA3 (n = 13) conditions relative to weight at baseline. n, Representative images showing the length of colons from TRE-shRenVillin-rtTA3 and TRE-shOgdhVillin-rtTA3 mice after 9 days of the indicated treatments. o,p, Colon length (o) and number of ulcers (p) in TRE-shRenVillin-rtTA3 and TRE-shOgdhVillin-rtTA3 mice at day 9. Each dot represents one mouse (n ≥ 4). q, Longitudinal analysis of faecal lipocalin 2 (LCN2) during DSS treatment in TRE-shRenVillin-rtTA3 (n = 5) and TRE-shOgdhVillin-rtTA3 mice (n = 5). Each line represents one mouse. r,s, H&E and ABP staining (r) and ABP quantification (s) of intestinal sections from TRE-shRenVillin-rtTA3 and TRE-shOgdhVillin-rtTA3 mice at day 9 of treatment. This figure is adapted from our published patent (WO2024229094A1). Statistical analysis: Data represent mean ± s.e.m. Statistical significance was determined using one-way ANOVA followed by Tukey’s HSD test for c,k,l,o,p,s. Survival probabilities were estimated using the Kaplan–Meier method, and statistical differences between the survival curves were assessed using the log-rank (Mantel–Cox) test in i. Two-way ANOVA followed by Tukey’s HSD test was used in m,q. Asterisks denote statistical significance (*P < 0.05, **P < 0.01, ***P < 0.001). Source Data
Extended Data Fig. 10
Extended Data Fig. 10. αKG supplementation as an intervention for ulcerative colitis.
a, Schematic of DM-αKG supplementation as a prevention strategy for ulcerative colitis induced by DSS. b, Body weight of mice given the indicated treatments relative to weight at baseline. c, Representative images showing length of colons from mice after 9 days of the indicated treatments. d, Colon length after 9 days of the indicated treatments. Each dot represents a different mouse (n ≥ 4). e,f, Number of ulcers (e) and ABP quantification (f) after 9 days of the indicated treatments. Each dot represents a different mouse (n ≥ 4). g, ABP and H&E staining of intestinal sections after 9 days’ treatment of mice with DSS or DSS/αKG. h,i, Quantification of monocytes and granulocytes (h) and macrophages (i) by immunophenotyping in αKG prevention settings. Each dot represents a mouse (n ≥ 4). j, Longitudinal analysis of faecal LCN2 at indicated time points during DSS treatment in DSS- and DSS/αKG-treated mice. Each line represents one mouse (n ≥ 4). k, Experimental plan for DM-αKG supplementation as a treatment for DSS-induced ulcerative colitis. lo, Colon length (l), representative images of colon length (m), numbers of ulcers (n) and ABP quantification (o) after 9 days of the indicated treatments. Each dot represents a different mouse (n ≥ 4). p,q, Quantification of monocytes and granulocytes (p) and macrophages (q) by immunophenotyping in αKG treatment settings. Each dot represents a mouse (n ≥ 4). r, Body weight as a percentage of initial weight in the Rag2−/− colitis model in the indicated conditions. s, Colon length at week 8 in the Rag2−/− colitis model under the indicated conditions. Each dot represents a different mouse (n ≥ 4). t, ABP and H&E staining of intestinal sections from Rag2−/− mice. u, Multiplex immunofluorescence of colon sections from Rag2−/− CD45Rb-high mice, with or without αKG treatment. Dashed lines outline crypt structures. This figure is adapted from our published patent (WO2024229094A1). Statistical analysis: Data represent mean ± s.e.m. Statistical significance was determined using one-way ANOVA followed by Tukey’s HSD test for df,h,i,l,nq,s. Two-way ANOVA followed by Tukey’s HSD test was used in b,j,r. Asterisks denote statistical significance (*P < 0.05, **P < 0.01, ***P < 0.001). Source Data

References

    1. Morris, J. P. et al. α-Ketoglutarate links p53 to cell fate during tumour suppression. Nature573, 595–599 (2019). - PMC - PubMed
    1. Carey, B. W., Finley, L. W., Cross, J. R., Allis, C. D. & Thompson, C. B. Intracellular α-ketoglutarate maintains the pluripotency of embryonic stem cells. Nature518, 413–416 (2015). - PMC - PubMed
    1. Tran, T. Q. et al. α-Ketoglutarate attenuates Wnt signaling and drives differentiation in colorectal cancer. Nat. Cancer1, 345–358 (2020). - PMC - PubMed
    1. Armstrong, C. T., Anderson, J. L. & Denton, R. M. Studies on the regulation of the human E1 subunit of the 2-oxoglutarate dehydrogenase complex, including the identification of a novel calcium-binding site. Biochem. J.459, 369–381 (2014). - PubMed
    1. Nemeria, N. S. et al. Human 2-oxoglutarate dehydrogenase complex E1 component forms a thiamin-derived radical by aerobic oxidation of the enamine intermediate. J. Biol. Chem.289, 29859–29873 (2014). - PMC - PubMed

MeSH terms

Substances

LinkOut - more resources