. 2025 Jun 11;24(1):177.
doi: 10.1186/s12943-025-02370-2.

Single-cell transcriptome reveals the reprogramming of immune microenvironment during the transition from MASH to HCC

Affiliations

Single-cell transcriptome reveals the reprogramming of immune microenvironment during the transition from MASH to HCC

Yu Huang et al. Mol Cancer. .

Abstract

Background: The immunological landscape of metabolic dysfunction-associated steatohepatitis (MASH)-driven hepatocellular carcinoma (HCC) is not well understood. Herein, we aim to delineate the immunological landscape in the MASH-to-HCC transition and to identify the critical genes that contribute to the pathogenesis of MASH-related HCC.

Methods: A well-established MASH-driven HCC mouse model, STAM model, was first constructed. Thereafter, we applied single-cell RNA sequencing (scRNA-seq) analysis of CD45+ cells sorted from livers of mice with normal chow or MASH, as well as paired paracancerous and cancer tissues from mice with HCC. Flow cytometry and multiplexed immunohistochemistry were performed to validate the analysis results of scRNA-seq. Finally, STAM model was applied between apolipoprotein E (ApoE)-deficient mice and wild type controls.

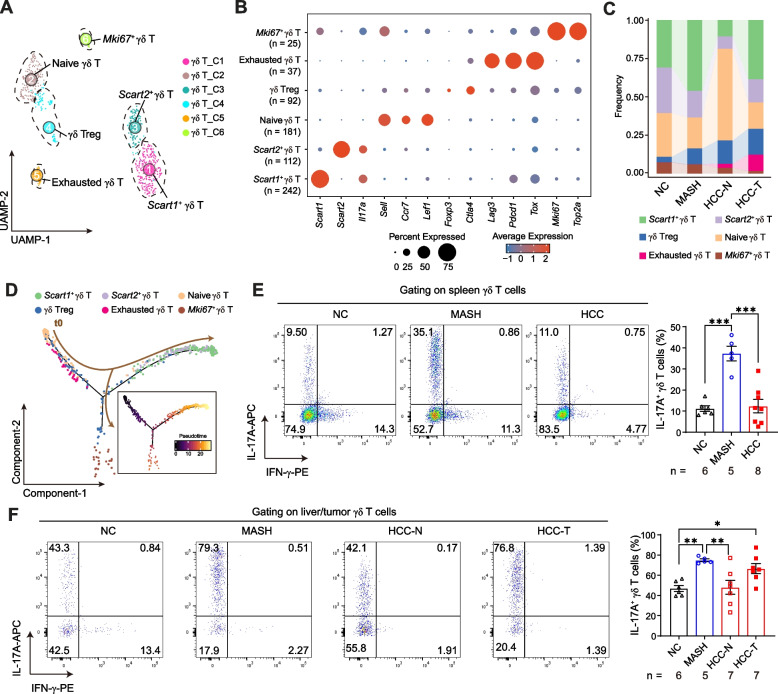
Results: We identified 23 major clusters corresponding to nine populations among 31,822 cells. Obviously, immunosuppressive and exhausted CD4+ T (IKZF2+OX40+FOXP3+CD4+ and GZMK+LAG-3+PD-1+CD4+), CD8+ T (LY49I+LY49G+IKZF2+FOXP3-CD8+, IKZF2+FOXP3+CD8+ and GZMK+LAG-3+PD-1+CD8+) and γδ T cells (γδ Treg and exhausted γδ T cells) were induced in the MASH-to-HCC transition. As MASH-related HCC progressed, B cells matured and differentiated into immunosuppressive cells. Natural killer cells (NKs) were found to be strikingly reduced at HCC stage. Particularly, the activation of liver-infiltrated NK cells was inhibited, leading to attenuation of anti-tumor capacity in the MASH-to-HCC transition. Moreover, tumor-associated macrophages were increased in MASH-related HCC. Importantly, multiple immune cells highly expressed ApoE in HCC, and ablation of ApoE impeded MASH-driven hepatocarcinogenesis by disrupting both ApoE-PI3K-AKT-NF-κB and ApoE-PI3K-AKT-c-Jun/c-Fos signaling pathways.

Conclusions: We illustrate the profound reprogramming of the liver immune microenvironment in the MASH-to-HCC transition and clarify the role of ApoE in MASH-driven HCC, implying that ApoE may serve as a potential therapeutic target for MASH-related HCC.

Keywords: ApoE; Exhaustion; Immunological landscape; Immunosuppressive microenvironment; MASH-to-HCC transition.


Conflict of interest statement

Declarations. Ethics approval and consent to participate: All procedures for animal experiments were performed according to the Animal Ethics Committee of JNU and in accordance with the Guide for the Care and Use of Laboratory Animals (NIH publications Nos. 80–23, revised 1996). This study does not involve human participants. Competing interests: The authors declare no competing interests.

Figures

Fig. 1
Fig. 1
The comprehensive atlas of hepatic immune cells in the MASH-to-HCC transition. A Shown are the experimental flowchart for the construction of STAM model and single-cell RNA sequencing (scRNA-seq). Male mouse pups were subcutaneously injected with streptozotocin (STZ) at two days after birth and fed with high-fat diet (HFD) at four weeks of age. The mice developed to metabolic dysfunction-associated steatohepatitis (MASH) and hepatocellular carcinoma (HCC) at nine and 27 weeks of age, respectively. Liver tissues from mice with normal chow diet (NCD) or MASH, as well as paired paracancerous (HCC-N) and cancer tissues (HCC-T) from mice with HCC were subjected to scRNA-seq. B UMAP visualization of clusters and cell types obtained through dimensionality reduction and clustering. C UMAP visualization of distinct immune cell populations across four groups. D Heatmap depicting the top 10 differentially expressed genes for distinct cell types. E Comparative analysis of the fold change for the proportions of corresponding cell types
Fig. 2
Fig. 2
Immunosuppressive and exhausted CD4+ T cells were induced in the liver during the transition from MASH to HCC. A UMAP visualization of clusters and cell subtypes for CD4+ T cells. B Bar chart depicted the percentages of distinct CD4+ T subtypes among different groups, including liver tissues from mice with normal chow (NC) or metabolic dysfunction-associated steatohepatitis (MASH), paired paracancerous (HCC-N) and cancer tissues (HCC-T) from mice with hepatocellular carcinoma (HCC). C Pseudotime assignment in color code for CD4+ T cells, taking the naïve CD4 as t0. D Pseudotime expression modules were identified by Monocle2 along with the development of CD4+ T cell fate. The top 1,000 differentially expressed genes with the most significant changes along the pseudotime trajectory were clustered into four modules based on their expression trends. E The percentages of IKZF2+OX40+FOXP3+CD4+ T cells in liver were gradually increased in the MASH-to-HCC transition. The representative flow cytometry images are shown in the upper panel. In the lower panel, the percentages of IKZF2+OX40+FOXP3+CD4+ T cells were analyzed among different groups. Each data point represents an individual mouse, and the number of mice in each group is shown. F, G IKZF2+OX40+FOXP3+CD4+ and GZMK+LAG-3+PD-1+CD4+ T cells were increased in MASH-related HCC. Shown are the representative multiplexed immunohistochemistry images and the quantified analysis of corresponding populations. The white arrows show the IKZF2+OX40+FOXP3+CD4+ and GZMK+LAG-3+PD-1+CD4+ T cells in F and G, respectively. Scale bar = 100 µm. Each data point represents an individual field in F and G. One-way ANOVA was used to determine significance. * P < 0.05, ** P < 0.01, *** P < 0.001. # It was significant using Student’s t test. ns, not significant difference
Fig. 3
Fig. 3
Immunosuppressive and exhausted CD8+ T cells were induced in the liver during the transition from MASH to HCC. A UMAP visualization of clusters and cell subtypes for CD8+ T cells. B Bar chart depicted the percentages of distinct CD8+ T subtypes among different groups, including liver tissues from mice with normal chow (NC) or metabolic dysfunction-associated steatohepatitis (MASH), paired paracancerous (HCC-N) and cancer tissues (HCC-T) from mice with hepatocellular carcinoma (HCC). C Pseudotime assignment in color code for CD8+ T cells, taking the naïve CD8 as t0. D Pseudotime expression modules were identified by Monocle2 along with the development of CD8+ T cell fate. The top 1,000 differentially expressed genes with the most significant changes along the pseudotime trajectory were clustered into four modules based on their expression trends. E The percentages of LY49I+IKZF2+FOXP3CD8+ T cells in liver were increased in MASH-related HCC. The representative flow cytometry images are shown in the upper panel. In the lower panel, the percentages of LY49I+IKZF2+FOXP3CD8+ T cells in liver/tumor were analyzed among different groups. Each data point represents an individual mouse, and the number of mice in each group is shown. F, G IKZF2+FOXP3CD8+ and LAG-3+PD-1+GZMK+CD8+ T cells were increased in MASH-related HCC. Shown are the representative multiplexed immunohistochemistry images and the quantified analysis of corresponding populations. The white arrows show the IKZF2+FOXP3CD8+ and LAG-3+PD-1+GZMK+CD8+ T cells in F and G, respectively. Scale bar = 100 µm. Each data point represents an individual field in F and G. One-way ANOVA was used to determine significance. ** P < 0.01, *** P < 0.001. ns, not significant difference
Fig. 4
Fig. 4
Immunosuppressive and exhausted γδ T cells were induced in the liver during the transition from MASH to HCC. A UMAP visualization of clusters and cell subtypes for γδ T cells. B The expression of signature genes for γδ T subtypes was presented by dot plot. C Bar chart depicted the percentages of distinct γδ T subtypes among different groups, including liver tissues from mice with normal chow (NC) or metabolic dysfunction-associated steatohepatitis (MASH), paired paracancerous (HCC-N) and cancer tissues (HCC-T) from mice with hepatocellular carcinoma (HCC). D Pseudotime assignment in color code for γδ T cells, taking the naïve γδ T as t0. E, F The percentages of IL-17A+ γδ T in the spleen (E) or liver (F) were increased in MASH and MASH-related HCC. The representative flow cytometry images are shown in the left panel. In the right panel, the percentages of IL-17A+ γδ T were analyzed among different groups. Each data point represents an individual mouse in E and F, and the number of mice in each group is shown in the panels accordingly. One-way ANOVA was used to determine significance. * P < 0.05, ** P < 0.01, *** P < 0.001
Fig. 5
Fig. 5
B cells matured and differentiated into immunosuppressive cells in the MASH-to-HCC transition. A UMAP visualization of clusters and cell subtypes for B cells. B Bar chart depicted the percentages of distinct B cell subtypes among different groups, including liver tissues from mice with normal chow (NC) or metabolic dysfunction-associated steatohepatitis (MASH), paired paracancerous (HCC-N) and cancer tissues (HCC-T) from mice with hepatocellular carcinoma (HCC). C The expression levels of Gm31243 were increased in the B cells isolated from the spleen or liver/tumor of tumor-bearing mice. The purified CD19+ B cells by using magnetic beads were obtained from the spleen (left) and liver (right) of corresponding mice, and subsequently subjected to qRT-PCR to detect the mRNA level of Gm31243. The number of mice in each group is shown. One-way ANOVA was used to determine significance. # It was significant using Student’s t test. * P < 0.05, ** P < 0.01. D Gene Set Variation Analysis (GSVA) of B cell subpopulations based on the KEGG database. E The heatmap for the regulon activity scores of transcriptional factors estimated by SCENIC analysis. F Pseudotime assignment in color code for B cells, taking the Gm31243lo B cells as t0. G The dynamics of switch genes was plotted to pseudo-time line by McFadden's Pseudo R. TF, transcriptional factor
Fig. 6
Fig. 6
Activation of liver-infiltrated NK cells in MASH-related HCC was inhibited in the MASH-to-HCC transition. A UMAP visualization of clusters and cell subtypes for NK cells. B Bar chart depicted the percentages of distinct NK cell subtypes among different groups, including liver tissues from mice with normal chow (NC) or metabolic dysfunction-associated steatohepatitis (MASH), paired paracancerous (HCC-N) and cancer tissues (HCC-T) from mice with hepatocellular carcinoma (HCC). C Pseudotime assignment in color code for NK cells, taking the LrNK as t0. D Pseudotime expression modules were identified by Monocle2 along with the development of NK cells fate. The top 1,000 differentially expressed genes with the most significant changes along the pseudotime trajectory were clustered into four modules based on their expression trends. The top 10 genes within each module are presented on the right. E UMAP visualization illustrated the distribution of Klra4 and Klra8 in NKs among different groups, with each point representing an individual cell. F The percentage of LY49H+LY49D+ NKs in the liver was significantly decreased in MASH-related HCC. G UMAP visualization illustrated the distribution of Gzma in NKs among different groups, with each point representing an individual cell. H The percentages of GZMA+ NKs were gradually decreased in the MASH-to-HCC transition. In F and H, the representative flow cytometry images are shown in the upper panel, where the percentages of corresponding cells were analyzed among different groups in the lower panel. One-way ANOVA was used to determine significance. * P < 0.05, ** P < 0.01, *** P < 0.001. ns, not significant difference
Fig. 7
Fig. 7
Apoe−/− mice exhibited less tumor burden of MASH-related HCC. A Violin plot delineating the expression levels of the Apoe in the corresponding cells among different groups. B Tumor-infiltrated immune cells exhibited elevated protein levels of ApoE, while tumor cells strikingly overexpressed ApoE receptors. The sorted CD4+ T, CD8+ T, CD19+ B cells and isolated tumor cells were subjected to western blotting. β-actin, internal control. C Apoe−/− mice exhibited less tumor burden compared to WT controls at HCC stage. D Shown are the representative pictures for hematoxylin–eosin (HE), F4/80 immunohistochemistry staining, Sirius Red (SR) and Oil Red O (ORO) of the liver/tumor tissues between Apoe−/− mice and WT controls at HCC stage. Scale bar = 100 µm. Each data point represents an individual mouse in C and D, and the number of mice in each group is shown in the panels accordingly. Student's t test was used to determine significance. * P < 0.05. ns, not significant difference. E Ablation of ApoE reduced the protein levels of phosphorylated PI3K, phosphorylated AKT, NF-κB, c-Jun and c-Fos, but not ERK and JNK in the tumor tissues. The tumor tissues from indicated mice were subjected to western blotting. β-actin, internal control. # or §, using the same internal control. F A graphical summary was constructed to summarize the main findings of this study

References

    1. Llovet JM, Kelley RK, Villanueva A, Singal AG, Pikarsky E, Roayaie S, et al. Hepatocellular carcinoma. Nat Rev Dis Primers. 2021;7:6. - PubMed
    1. Dhanasekaran R, Suzuki H, Lemaitre L, Kubota N, Hoshida Y. Molecular and immune landscape of hepatocellular carcinoma to guide therapeutic decision-making. Hepatology. 2025;81:1038–57. - PMC - PubMed
    1. Rinella ME, Lazarus JV, Ratziu V, Francque SM, Sanyal AJ, Kanwal F, et al. A multisociety Delphi consensus statement on new fatty liver disease nomenclature. J Hepatol. 2023;79:1542–56. - PubMed
    1. Huang DQ, El-Serag HB, Loomba R. Global epidemiology of NAFLD-related HCC: trends, predictions, risk factors and prevention. Nat Rev Gastroenterol Hepatol. 2021;18:223–38. - PMC - PubMed
    1. Tan DJH, Ng CH, Lin SY, Pan XH, Tay P, Lim WH, et al. Clinical characteristics, surveillance, treatment allocation, and outcomes of non-alcoholic fatty liver disease-related hepatocellular carcinoma: a systematic review and meta-analysis. Lancet Oncol. 2022;23:521–30. - PMC - PubMed

MeSH terms

Substances