. 2025 Jun 11;20(1):65.
doi: 10.1186/s40793-025-00697-3.

New groups of highly divergent proteins in families as old as cellular life with important biological functions in the ocean

Affiliations

New groups of highly divergent proteins in families as old as cellular life with important biological functions in the ocean

Duncan Sussfeld et al. Environ Microbiome. .

Abstract

Background: Metagenomics has considerably broadened our knowledge of microbial diversity, unravelling fascinating adaptations and characterising multiple novel major taxonomic groups, e.g. CPR bacteria, DPANN and Asgard archaea, and novel viruses. Such findings profoundly reshaped the structure of the known Tree of Life and emphasised the central role of investigating uncultured organisms. However, despite significant progresses, a large portion of proteins predicted from metagenomes remain today unannotated, both taxonomically and functionally, across many biomes and in particular in oceanic waters.

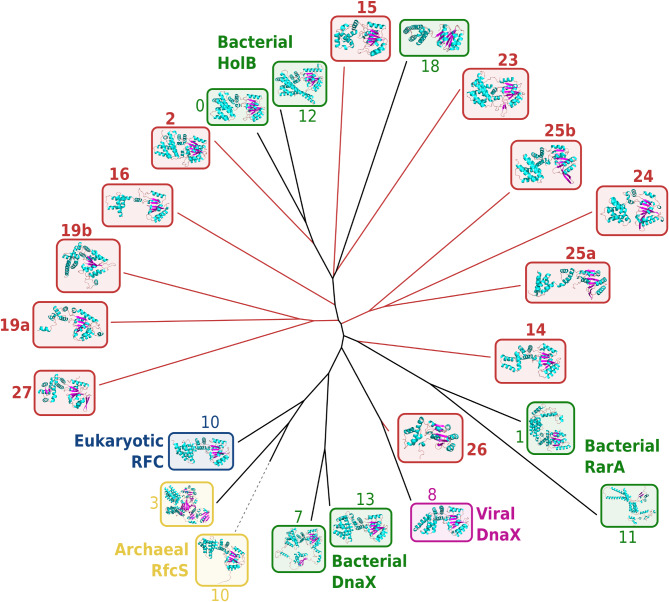
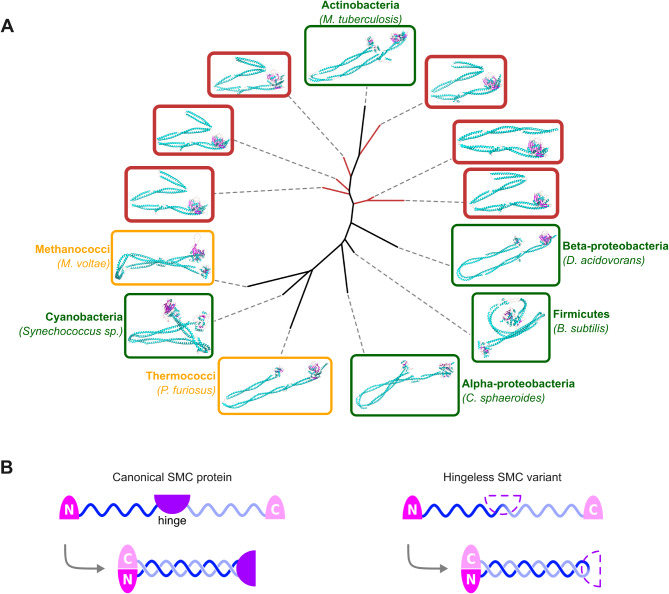
Results: Here, we used an iterative, network-based approach for remote homology detection, to probe a dataset of 40 million ORFs predicted in marine environments. We assessed the environmental diversity of 53 core gene families broadly distributed across the Tree of Life, with essential functions including translational, replication and trafficking processes. For nearly half of them, we identified clusters of remote environmental homologues that showed divergence from the known genetic diversity comparable to the divergence between Archaea and Bacteria, with representatives distributed across all the oceans. In particular, we report the detection of environmental clades with new structural variants of essential SMC (Structural Maintenance of Chromosomes) genes, divergent polymerase subunits forming deep-branching clades in the polymerase tree, and variant DNA recombinases in Bacteria as well as viruses.

Conclusions: These results indicate that significant environmental diversity may yet be unravelled even in strongly conserved gene families. Protein sequence similarity network approaches, in particular, appear well-suited to highlight potential sources of biological novelty and make better sense of microbial dark matter across taxonomical scales.

Keywords: Distant homology; Microbial dark matter; Microbiome; Sequence similarity networks.


Conflict of interest statement

Declarations. Ethics approval and consent to participate: Not applicable. Consent for publication: Not applicable. Competing interests: The authors declare no competing interests.

Figures

Fig. 1
Fig. 1
Iterative homologue search procedure. (A) Iterative aggregation of environmental homologues around seed sequences in a similarity network. From a set of seed sequences belonging to a given protein family (green and orange nodes), a first search iteration finds environmental homologues (dark blue nodes) for some of the seeds. A second search iteration then uses these environmental sequences as queries to find more homologues (medium blue nodes, red frame), which are themselves used as queries for a third search iteration finding further environmental homologues (light blue nodes, yellow frame). (B) At each iteration of the search, newly found homologues are only retained if their aligned region can be mapped back onto a seed sequence in a way that ensures > 80% coverage on all sequences along the chain of aligned sequences. (C) Left: sequence D is found after three search iterations from seed A, and its alignment with sequence C can be mapped back to A in a way that preserves 80% coverage on all sequences along the “alignment chain”. Sequence D is therefore retained and will be used as query for the next iteration of the search. Right: sequence D’ is found after three search iterations from seed A, but its aligned region cannot be mapped back to A without breaking the 80% coverage requirement. D’ is thus not retained as a distant homologue of A in this round of search. (D-G) Sequence similarity networks for SMC proteins. (D) shows seed sequences only, (E-G) show seed and environmental sequences. In (D-F), nodes representing seed sequences are coloured according to their taxonomic origin (yellow: non-DPANN archaea; orange: DPANN archaea; light green: CPR bacteria; dark green: non-CPR bacteria; shades of red: four eukaryotic SMC paralogues). In (E), environmental nodes are coloured in blue, with darker shades for sequences retrieved in earlier iterations of the search, and lighter shades for sequences retrieved later. In (F), environmental nodes are coloured in blue, with darker shades for sequences with higher similarity to the known cultured diversity, and lighter shades for sequences with less similarity. In (G), all nodes are coloured according to Louvain clusters inferred in the SSN (one arbitrary colour per cluster).
Fig. 2
Fig. 2
Biogeographical distribution of highly divergent environmental homologues of seed families. For each Tara Oceans sampling station (Y-axis) and each depth layer (X-axis), the local sample-specific fold-change in highly divergent variants (< 34.9% identity to closest nr relative) of 53 selected core gene families is calculated as the following ratio: % divergent variants among sequences from local sample / % divergent variants among all homologues retrieved (i.e. 20.5%). The column on the left represents the sampling station-wise enrichment in divergent variants regardless of depth. The row on the bottom represents the depth layer-wise enrichment in divergent variants regardless of sampling station. Fold-change values > 1 (blue cells) indicate a relative enrichment in divergent variants at the corresponding sample, and values < 1 (red cells) indicate relative depletion. The clustering of sampling stations based on their local enrichment profiles is represented by the dendrogram on the left. Sampling stations are numbered as in Sunagawa et al. [41], and coloured according to the sea/ocean in which they are located. Asterisks represent the significance of the local enrichment in divergent variants, using three different ranges of p-values from one-sided binomial tests (with Bonferroni corrections, main grid: N = 141; left column: N = 68; bottom row: N = 3). Abbreviations: NAO North Atlantic Ocean, SAO South Atlantic Ocean, NPO North Pacific Ocean, SPO South Pacific Ocean, SO Southern Ocean, IO Indian Ocean, MS Mediterranean Sea, RS Red Sea; SRF Surface water layer, DCM deep chlorophyll maximum layer, MIX subsurface mixed layer, MES mesopelagic layer.
Fig. 3
Fig. 3
Alignment-free phylogeny of DNA clamp loader subunits HolB/DnaX/RarA/RFC and environmental homologues from significantly divergent clusters. Seed sequences are coloured according to the Domain of life of their host organism (green: Bacteria, yellow: Archaea and Eukaryotes). Groups of environmental sequences are coloured according to the network cluster they belong to in the family SSN, and outlined in red. Numerical cluster labels are inherited from Fig. SI-5 and shared with Fig. 4. Note: environmental network clusters 19 and 25 are both split into two groups in this phylogenetic tree.
Fig. 4
Fig. 4
Dendrogram of tertiary structures of DNA clamp loader subunits HolB/DnaX/RarA/RFC and environmental homologues from significantly divergent clusters. Protein structures were inferred with AlphaFold and compared (all against all) using Foldseek. Leaves and structures are boxed according to the Domain of life of their host organism (green: Bacteria, yellow: Archaea, blue: Eukaryotes, magenta: Viruses). Environmental leaves and structures are boxed in red, with numerical labels corresponding to the SSN cluster they belong to, in accordance with Fig. 3 and Fig. SI-5
Fig. 5
Fig. 5
Maximum likelihood phylogenetic tree of SMC sequences and environmental homologues from significantly divergent clusters. Seed sequences are coloured according to the Domain of life of their host organism (green tones: Bacteria, yellow: Archaea, orange and purple tones: Eukaryotes). Environmental sequences are coloured in blue and outlined in red. Red dots indicate environmental sequences for which 3D structures were inferred. Black dots indicate branches with > 85% bootstrap support.
Fig. 6
Fig. 6
Environmental SMC homologues with divergent tertiary structure. (A) Dendrogram of tertiary structures of SMC sequences and selected environmental homologues from significantly divergent clusters. Protein structures were inferred with AlphaFold and compared (all against all) using Foldseek. Leaves and structures are boxed according to the Domain of life of their host organism (green: Bacteria, yellow: Archaea). Environmental leaves and structures are highlighted in red. (B) Schematic structure of SMC monomers. Left: canonical SMC protein with N- and C-terminal ATP-binding motifs, linked to a central hinge domain by two coiled-coil regions. This linear structure folds (grey arrow) by joining the two terminal motifs into an ATPase domain, forming a helical coiled-coil with the arm regions between the ATPase and hinge domains. Right: “hinge-less” environmental SMC homologue lacking a hinge domain. The folded protein still features the ATPase domain at one end of the coiled-coil helix, without the hinge at the opposite end
Fig. 7
Fig. 7
Alignment-free phylogeny of RecA/RadA sequences and environmental homologues from significantly divergent clusters. Seed sequences are coloured according to the Domain of life of their host organism (green: Bacteria and eukaryotic organelles, yellow: Archaea and eukaryotic nuclei). Groups of environmental sequences are coloured according to the network cluster they belong to in the family SSN, and outlined in red. Numerical cluster labels are inherited from Fig. SI-8

References

    1. Staley JT, Konopka A. Measurement of in situ activities of nonphotosynthetic microorganisms in aquatic and terrestrial habitats. Annu Rev Microbiol. 1985;39:321–46. - PubMed
    1. Amann RI, Ludwig W, Schleifer KH. Phylogenetic identification and in situ detection of individual microbial cells without cultivation. Microbiol Rev. 1995;59:143–69. - PMC - PubMed
    1. Whitman WB, Coleman DC, Wiebe WJ. Prokaryotes: the unseen majority. Proc Natl Acad Sci. 1998;95:6578–83. - PMC - PubMed
    1. Marcy Y, Ouverney C, Bik EM, Lösekann T, Ivanova N, Martin HG, et al. Dissecting biological dark matter with single-cell genetic analysis of rare and uncultivated TM7 microbes from the human mouth. Proc Natl Acad Sci U S A. 2007;104:11889–94. - PMC - PubMed
    1. Alain K, Querellou J. Cultivating the uncultured: limits, advances and future challenges. Extremophiles. 2009;13:583–94. - PubMed

LinkOut - more resources