

Mapping the intersection of demographics, behavior, and government response to the COVID-19 pandemic: an observational cohort study
- PMID: 40500802
- PMCID: PMC12160353
- DOI: 10.1186/s44263-025-00162-w
Mapping the intersection of demographics, behavior, and government response to the COVID-19 pandemic: an observational cohort study
Abstract
Background: During the early phase of the COVID-19 pandemic, the province of Ontario enacted restrictions and recommendations that changed over time. These measures were effective in reducing COVID-19-related illness and deaths, but adherence to these non-pharmaceutical interventions may be modified by individual factors including demographics and health status which shape exposure risk behaviors.
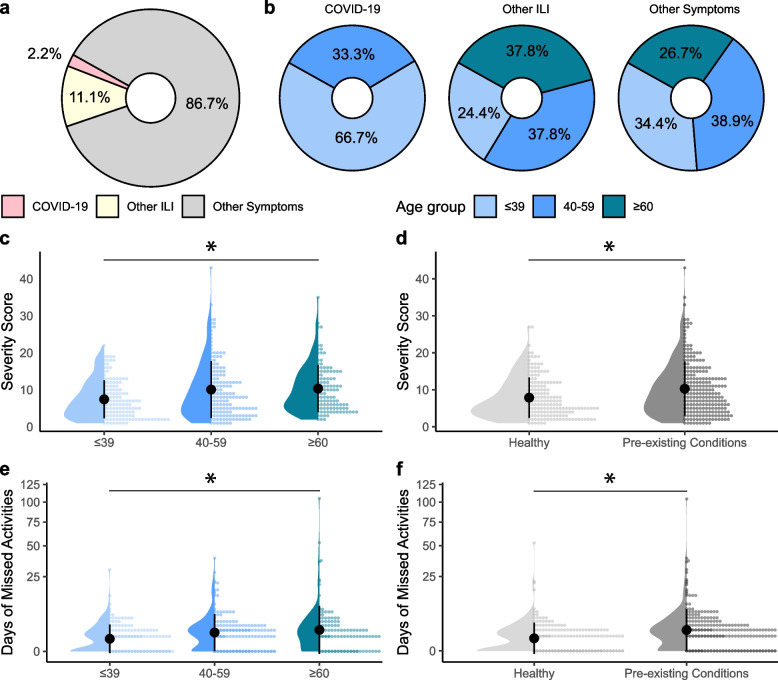
Methods: A total of 348 participants completed baseline questionnaires (to assess demographics, pre-pandemic exposure risk, and health status), weekly illness reports, and monthly social distancing behavior questionnaires to evaluate exposure risk over time in response to changing levels of government restrictions. Exposure risk behaviors were calculated using seven categories: attendance at social events, receiving care (hospital, etc.), visiting or volunteering at care facilities, public transportation use, hours working outside of the home, hours volunteering outside of the home, and handwashing frequency. The impact of individual and environmental factors on exposure risk over time was evaluated by a Poisson family generalized linear mixed model.
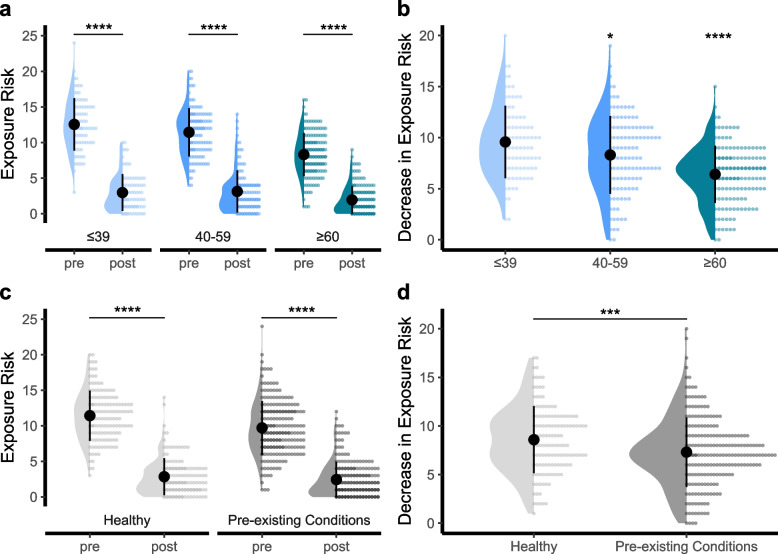
Results: Participants across all age groups and health statuses adapted their behaviors in response to evolving regulations, but older individuals and those with pre-existing conditions had the largest change in behavior. These individuals also had the most severe symptoms when they developed COVID-19 or other influenza-like illnesses. Participants who were older or had pre-existing health conditions had lower levels of exposure risk overall, and this was largely driven by a lower prevalence and frequency of in-person work. Female participants also had lower levels of exposure risk overall, consistent with an increased frequency of handwashing in this group. Unexpectedly, we found no effect of vaccination on total exposure risk.
Conclusions: Participant behavior was generally responsive to government-imposed restrictions, with increased stringency coinciding with decreased exposure risk among participants. Demographic-associated differences in exposure risk behaviors appear to be driven by systemic factors (i.e., a return to in-person work) to a greater extent than personal choices (i.e., social gatherings). These findings emphasize the interplay between demographic factors and government interventions in shaping individual behaviors over the course of the pandemic. Understanding these dynamics is crucial for informing interventions and mitigating the impact of future pandemics.
Keywords: COVID-19; Exposure risk; Social distancing.
© 2025. The Author(s).
Conflict of interest statement
Declarations. Ethics approval and consent to participate: All protocols were approved by the Hamilton Integrated Research Ethics Board (#10757). Informed consent was obtained from all participants. This research conformed to the principles of the Helsinki Declaration. Consent for publication: Not applicable. Competing interests: The authors declare no competing interests.
Figures

Similar articles
-
Intersecting factors of disadvantage and discrimination and their effect on daily life during the coronavirus pandemic: the CICADA-ME mixed-methods study.Health Soc Care Deliv Res. 2025 Feb;13(2):1-185. doi: 10.3310/KYTF4381. Health Soc Care Deliv Res. 2025. PMID: 39949202
-
Folic acid supplementation and malaria susceptibility and severity among people taking antifolate antimalarial drugs in endemic areas.Cochrane Database Syst Rev. 2022 Feb 1;2(2022):CD014217. doi: 10.1002/14651858.CD014217. Cochrane Database Syst Rev. 2022. PMID: 36321557 Free PMC article.
-
Workplace interventions to reduce the risk of SARS-CoV-2 infection outside of healthcare settings.Cochrane Database Syst Rev. 2024 Apr 10;4(4):CD015112. doi: 10.1002/14651858.CD015112.pub3. Cochrane Database Syst Rev. 2024. PMID: 38597249 Free PMC article.
-
COVID-19 and the Changes in the Sexual Behavior of Men Who Have Sex With Men: Results of an Online Survey.J Sex Med. 2020 Oct;17(10):1827-1834. doi: 10.1016/j.jsxm.2020.07.085. Epub 2020 Aug 10. J Sex Med. 2020. PMID: 32883631 Free PMC article.
-
Impact of self-imposed prevention measures and short-term government-imposed social distancing on mitigating and delaying a COVID-19 epidemic: A modelling study.PLoS Med. 2020 Jul 21;17(7):e1003166. doi: 10.1371/journal.pmed.1003166. eCollection 2020 Jul. PLoS Med. 2020. PMID: 32692736 Free PMC article.
References
LinkOut - more resources
Full Text Sources