. 2025 May 1;26(3):bbaf267.
doi: 10.1093/bib/bbaf267.

EvANI benchmarking workflow for evolutionary distance estimation

Affiliations

EvANI benchmarking workflow for evolutionary distance estimation

Sina Majidian et al. Brief Bioinform. .

Abstract

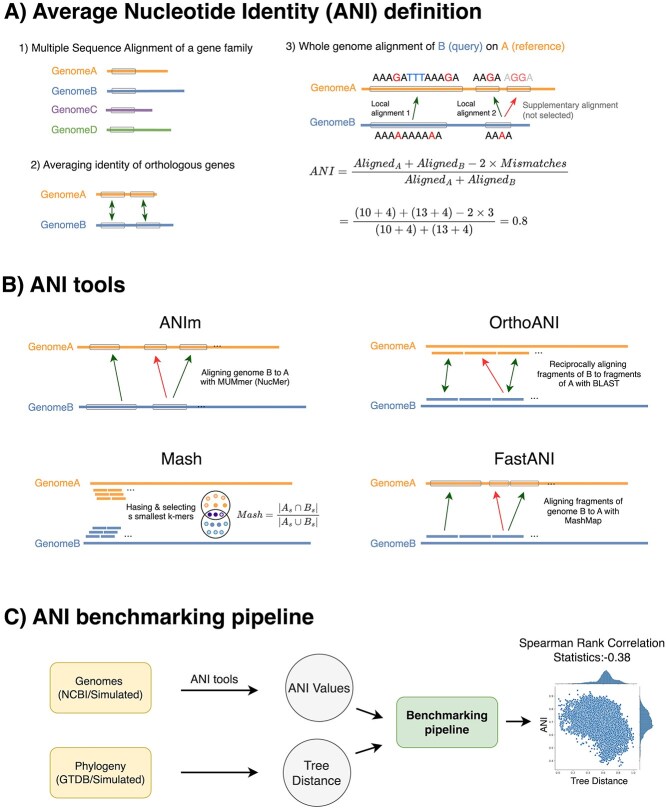
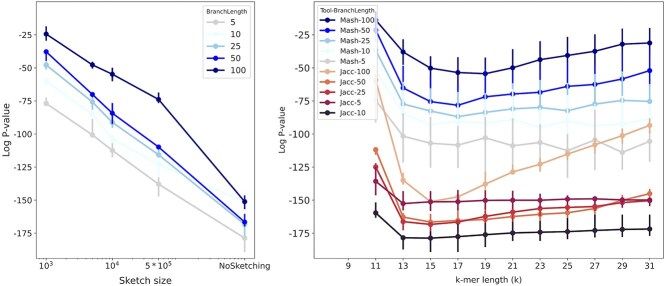
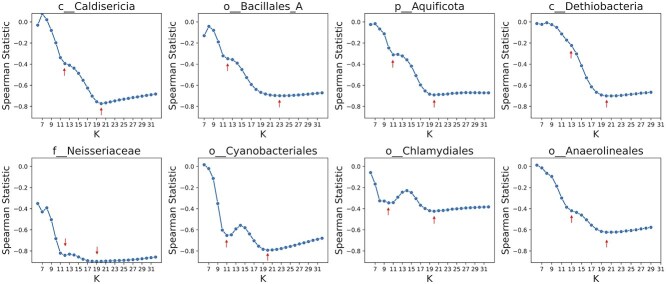
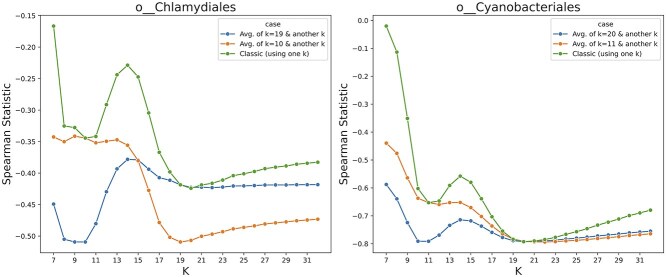
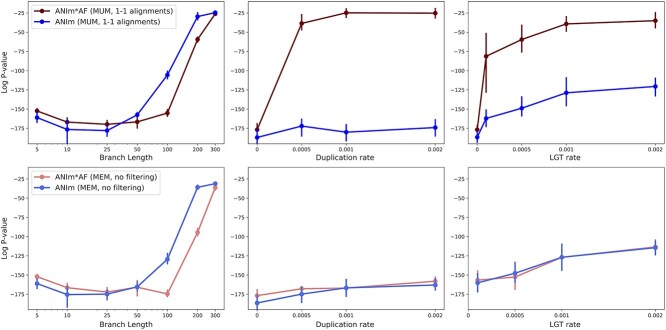
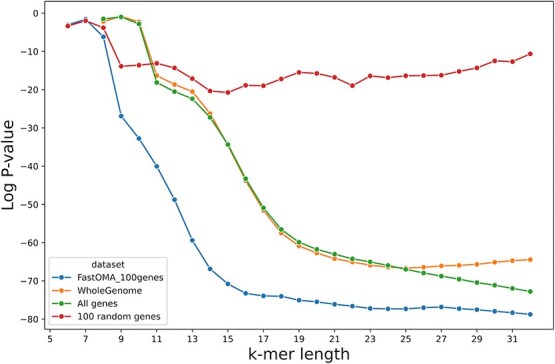
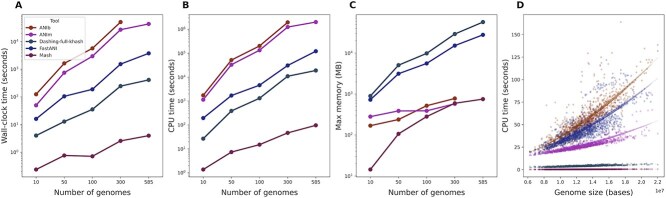
Advances in long-read sequencing technology have led to a rapid increase in high-quality genome assemblies. These make it possible to compare genome sequences across the Tree of Life, deepening our understanding of evolutionary relationships. Average nucleotide identity (ANI) is a metric for estimating the genetic similarity between two genomes, usually calculated as the mean identity of their shared genomic regions. These regions are typically found with genome aligners like Basic Local Alignment Search Tool BLAST or MUMmer. ANI has been applied to species delineation, building guide trees, and searching large sequence databases. Since computing ANI via genome alignment is computationally expensive, the field has increasingly turned to sketch-based approaches that use assumptions and heuristics to speed this up. We propose a suite of simulated and real benchmark datasets, together with a rank-correlation-based metric, to study how these assumptions and heuristics impact distance estimates. We call this evaluation framework EvANI. With EvANI, we show that ANIb is the ANI estimation algorithm that best captures tree distance, though it is also the least efficient. We show that k-mer-based approaches are extremely efficient and have consistently strong accuracy. We also show that some clades have inter-sequence distances that are best computed using multiple values of $k$, e.g. $k=10$ and $k=19$ for Chlamydiales. Finally, we highlight that approaches based on maximal exact matches may represent an advantageous compromise, achieving an intermediate level of computational efficiency while avoiding over-reliance on a single fixed k-mer length.

Keywords: BLAST; average nucleotide identity; evolution; genome; k-mer; sketching.


Figures

Figure 1
Figure 1
(A) ANI quantifies the similarity between two genomes. ANI can be defined as the number of aligned positions where the two aligned bases are identical, divided by the total number of aligned bases. Historically, ANI was calculated using a single gene family for multiple sequence alignment. Another approach finds orthologous genes between two genomes and reports the average similarity between their CDSs. This method was later extended to whole-genome alignment by identifying local alignments and excluding supplementary alignments with lower similarity. (B) Different ANI tools employ various approaches in calculating ANI values. ANIm, OrthoANI, and FastANI use aligners to identify homologous regions, whereas Mash uses k-mer hashing to estimate similarities. Only alignments with higher similarity represented by green arrows are included in ANI calculations, while red arrows, corresponding to paralogs, are excluded. (C) The proposed benchmarking method evaluates the performance of different tools using both real and simulated data. It assumes that more distantly related species on the phylogenetic tree should have lower ANI similarities. This is measured by calculating the statistics of Spearman rank correlation. We expect a negative correlation between ANI and the tree distance (scatter plot on the right).
Figure 2
Figure 2
The formula imageP-value of Spearman’s rank correlation test between ANI (calculated using Jaccard or Mash distance) with the tree distance (based on the true phylogenetic tree) for simulated evolution of 15 genomes. (left) Mash with k-mer length of formula image, (right) Mash with sketch size of formula image. The branch length parameter refers to the total length of root-to-leaf branches in the simulated tree used for genome evolution simulations [52]. Overall, increasing the sketch size improves the rank correlation, decreasing the P-value and the optimal k-value that minimizes the P-value is different for different scenarios.
Figure 3
Figure 3
The statistics of the Spearman rank correlation test comparing Jaccard index (calculated by Dashing) and tree distances for eight clades including c__Caldisericia, o__Bacillales_A, p__Aquificota, c__Dethiobacteria, f__Neisseriaceae, o__Cyanobacteriales, and o__Chlamydiales, o__Anaerolineales. Note that the two clades of c__Dethiobacteria and o__Anaerolineales were chosen randomly to assess the representativeness of the selection (see Methods section). Red arrows show a local minimum or a notable change in the statistics. Although a value of k around 19 to 23 optimizes the correlation, there is no single k value for the k-mer length that optimizes the statistics for estimating evolutionary distances across all clades, and some clades exhibit multiple local optimals, highlighting the fundamental limitation of k-mer-based approaches.
Figure 4
Figure 4
The Spearman rank correlation test between the distance on the GTDB tree and the Jaccard index calculated using Dashing in full-hash mode. For the orders of Chlamydiales and Cyanobacteriales, two distinct k-values performed well (green). Using both sets of 10-mers and 19-mers (for Chlamydiales) to find distance ranks improved the statistics (blue/orange), which demonstrates that small and large k-mers can capture complementary information, since using both resulted in a better estimation.
Figure 5
Figure 5
The ALF simulator was used to generate related genomes under two series of evolutionary scenarios. One series simulated duplication rates of 0.05%, 0.1%, and 0.2% (left column). Another series simulated LGT rates of 0.01%, 0.05%, 0.1%, and 0.2% (right column). (A–D) We ran Mash with different k-mer length and sketch size parameters. The alignment-based tools for estimating ANI includes FastANI (E and F) and ANIm (G and H). See Supplementary Fig. S4 for the impact of fragment length on FastANI.
Figure 6
Figure 6
Comparing alignment-based tools (FastANI, ANIm, ANIb) and k-mer-based tools (Dashing, Mash) on datasets with different LGT and duplication rates (summarizing the Fig. 5). The alignment approaches performed better than k-mer-based Mash in Spearman correlation test. fastANI-l1k-frac0.1: FastANI with a fragment length of 1000 and minimum fraction shared genome of 0.1, Mash-k14-s10k: Mash with k-mer length of 14 and sketch size of 10,000. ANIm-l11:ANIm with a minimum MUM length of 11. DashingFull-k14: The Jaccard index was calculated with the Dashing tool which was run in the mode --use-full-khash-sets.
Figure 7
Figure 7
The formula image  P-value of spearman correlation test between different ANI tools (FastANI, Mash, Dashing, ANIm) versus ANIb (left) using simulated data. We considered a range of LGT and duplication rates. (right) A similar analysis in comparison to ANIm, showing the strongest rank correlation between ANIm and ANIb.
Figure 8
Figure 8
Impact of weighting ANIm with AF for distance calculation in Cyanobacteraia. 84 genomes were considered for studying the correlation between ANIm (or formula image) versus tree distance from NCBI and each point corresponds to a pair of genomes (see Supplementary Fig. S10 when GTDB is used).
Figure 9
Figure 9
The Spearman correlation between ANIm (or ANIm*AF) and tree distance for simulated datasets with different root-to-leaf branch length, and duplication and LGT rates. The top row uses MUMs in alignment with MUMmer, followed by keeping only 1-to-1 alignments. The bottom row corresponds to using all maximal matches without any filtering. Longer branches in trees used for genome evolution resulted in more distant genomes. Different minimum MUM lengths used in ANIm did not impact the result (Supplementary Fig. S6). The branch length in PAM [52, 56] varies from 5 to 300. AF = alignment fraction.
Figure 10
Figure 10
The log P-value of Spearman correlation test between the Jaccard index and distance on the GTDB tree (the lower, the better). This shows the impact of using different genomic regions in distance calculation for the clade o_Bacillales_A2 when k-mers found from the whole genome, all CDSs, 100 random CDS genes, or 100 orthologous genes.
Figure 11
Figure 11
Performance evaluation of ANI tools on the Cyanobacteriales dataset. (A) Wall-clock time versus number of genomes. (B) CPU time versus number of genomes. (C) Max memory versus number of genomes. (D) Comparison of tools by genome size.

Update of

Similar articles

Cited by

References

    1. Lewin HA, Robinson GE, Kress WJ. et al. Earth biogenome project: sequencing life for the future of life. Proc Natl Acad Sci 2018;115:4325–33. 10.1073/pnas.1720115115 - DOI - PMC - PubMed
    1. Hunt M, Lima L, Shen W. et al. Allthebacteria-all bacterial genomes assembled, available and searchable. Preprint bioRxiv. 2024;2024–03. 10.1101/2024.03.08.584059 - DOI
    1. Wenger AM, Peluso P, Rowell WJ. et al. Accurate circular consensus long-read sequencing improves variant detection and assembly of a human genome. Nat Biotechnol 2019;37:1155–62. 10.1038/s41587-019-0217-9 - DOI - PMC - PubMed
    1. Rautiainen M, Nurk S, Walenz BP. et al. Telomere-to-telomere assembly of diploid chromosomes with verkko. Nat Biotechnol 2023;41:1474–82. 10.1038/s41587-023-01662-6 - DOI - PMC - PubMed
    1. Jukes TH, Cantor CR (1969) Evolution of protein molecules. In: Munro HN (ed) Mammalian Protein Metabolism, 21–132. 10.1016/B978-1-4832-3211-9.50009-7 - DOI