. 2025 Jun;21(6):e70262.
doi: 10.1002/alz.70262.

Disease-specific neuropathological alterations of the locus coeruleus in Alzheimer's disease, Down syndrome, and Parkinson's disease

Affiliations

Disease-specific neuropathological alterations of the locus coeruleus in Alzheimer's disease, Down syndrome, and Parkinson's disease

Marta Fructuoso et al. Alzheimers Dement. 2025 Jun.

Abstract

Introduction: The locus coeruleus (LC), the brain's primary source of noradrenaline (NA), undergoes early neurodegeneration in Parkinson's disease (PD), Alzheimer's diseases (AD), and Down syndrome (DS); however, differences have not been examined in parallel.

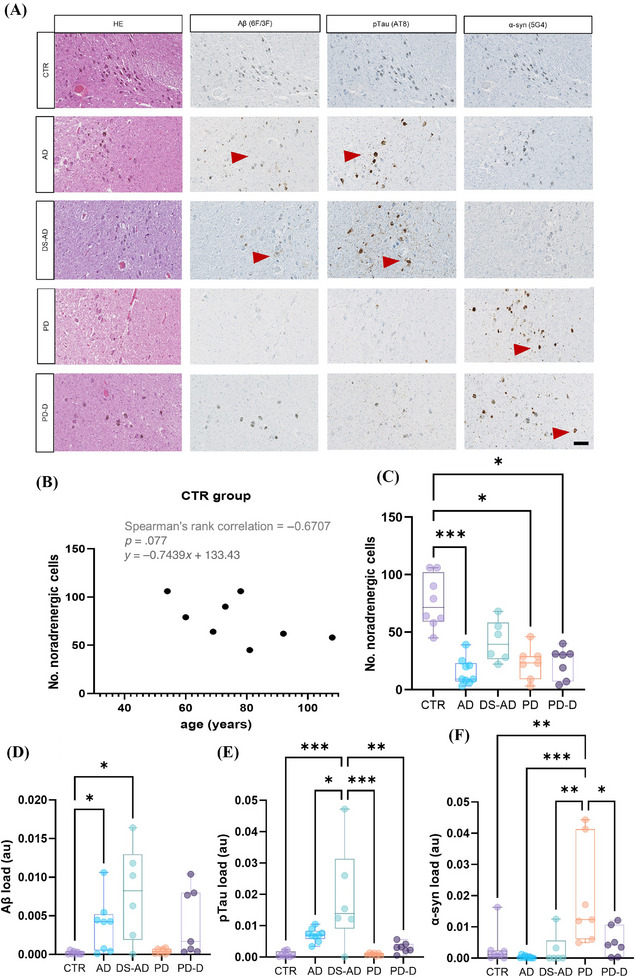
Methods: Post mortem brains (n = 67) from individuals with AD, DS-AD, and PD without and with dementia (PD-D) and controls were analyzed for amyloid beta (Aβ), phosphorylated tau (pTau), α-synuclein, endo-lysosomal alterations, biogenic amines, and selective biomarkers.

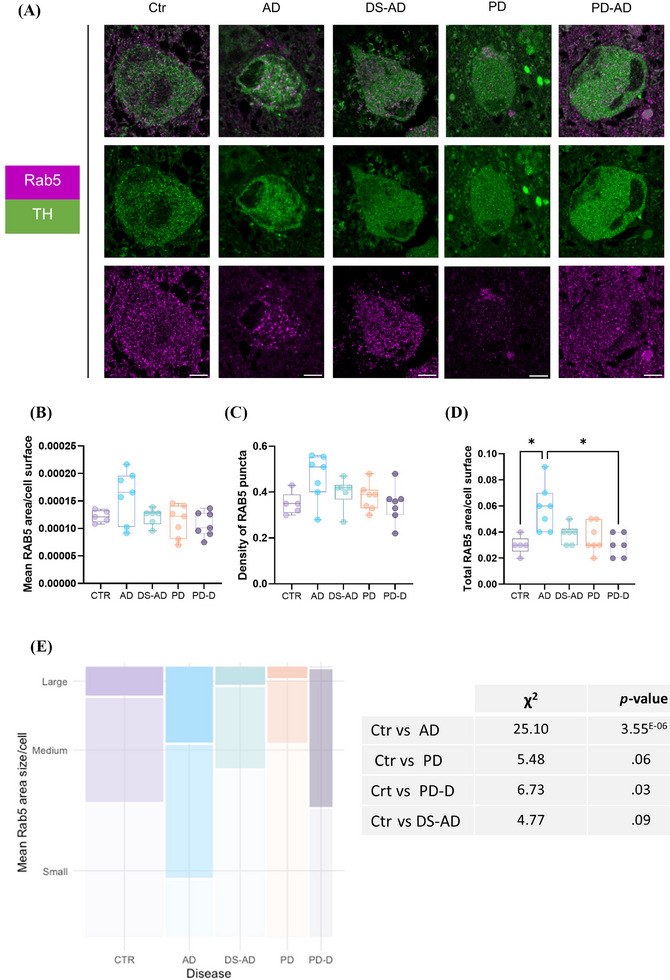
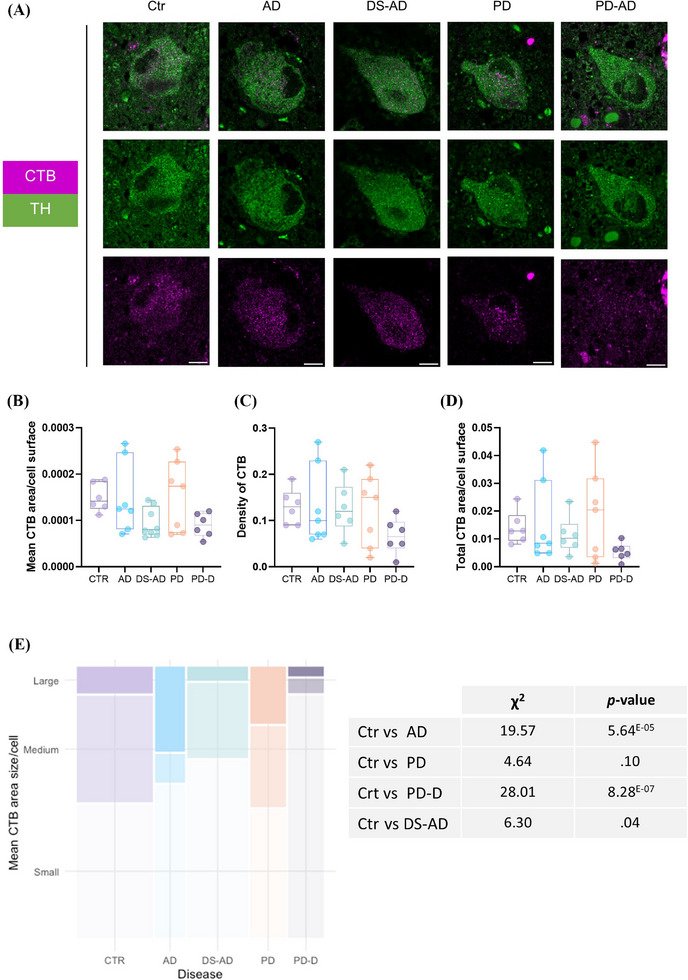
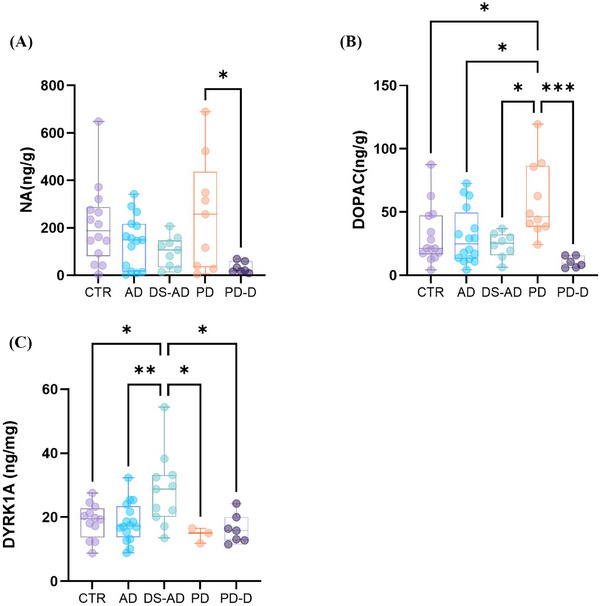
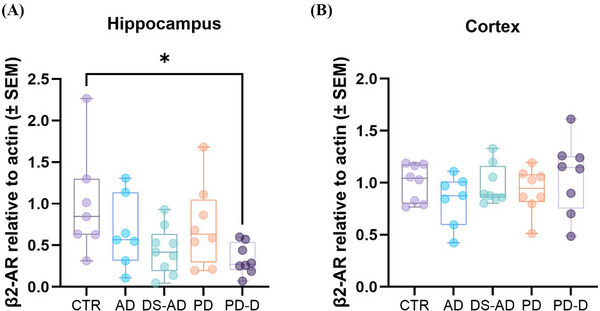
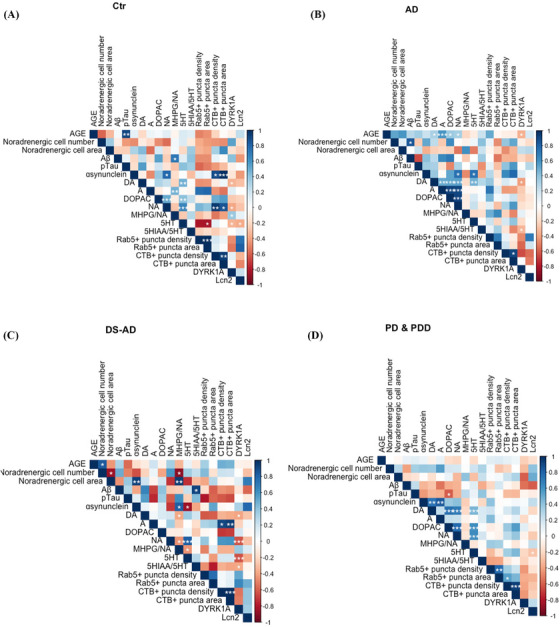
Results: LC degeneration correlated with age, peaking in AD and PD-D, while NA and dopaminergic metabolites were significantly reduced only in PD-D. DS-AD, the youngest group, showed the highest Aβ and pTau levels but the least noradrenergic neuron loss. We demonstrated for the first time that endosomal alterations were present in AD, lysosomal changes were present in PD-D/DS-AD, and DYRK1A, a key protein from chromosome 21, was elevated only in DS-AD.

Discussion: Loss of noradrenergic neurons may occur independently of amyloid and tau pathologies.

Highlights: We provide the first analysis of neuropathological and biochemical features including biogenic amines of the LC in AD, DS, and PD. Loss of noradrenergic neurons was most severe in AD and PD. Only in DS, levels of DYRK1A - a kinase encoded on chromosome 21 and implicated in neurodegenerative processes - were elevated and negatively correlated to biogenic amine levels. Although individuals with DS having AD were the youngest group, they had the highest levels of amyloid and tau pathologies, but less noradrenergic neurons loss compared to other disease groups.

Keywords: DYRK1A; endo‐lysosomal pathway; locus coeruleus; neurodegenerative diseases.


Conflict of interest statement

The authors declare no conflicts of interest. Author disclosures are available in the Supporting Information.

Figures

FIGURE 1
FIGURE 1
Neuropathology in LC from patients with AD, DS, PD, and PD‐D. (A) Representative images of histological examination of LC of control cases (CTR n = 7) and the different disease groups (AD n = 9, DS‐AD n = 6, PD n = 6, PD‐D n = 5). (B) Spearman correlation between age and number of noradrenergic cells in control brains. (C) Box plots represent mean number of noradrenergic cells in LC of various conditions. Dots represent each individual case. (D–F) Box plot representing mean value of signal for (D) Aβ, (E) pTau, and (F) α‐synuclein in LC of different conditions. Dots represent each individual case. Aβ, amyloid beta; AD, Alzheimer's disease; CTR, control; DS, Down syndrome; DS‐AD, Down syndrome with Alzheimer's disease; HE, hematoxylin and eosin; LC, locus coeruleus; PD, Parkinson's disease; PD‐D, Parkinson's disease with dementia. Immunohistochemistry: (anti‐Aβ [6F/3D], anti‐pTau [AT8], and anti‐α‐synuclein [5G4] antibodies). Scale bar = 100 µm. Data were analyzed using one‐way ANOVA (p < 0.05) and post hoc Kruskal‐Wallis tests. *p < 0.05; **p < 0.01; ***p < 0.001.
FIGURE 2
FIGURE 2
Endosomal phenotype in noradrenergic cells of LC from patients with AD, DS‐AD, PD, and PD‐D. (A) Representative images of Rab5 and TH immunolabeling of formalin‐fixed paraffin‐embedded sections from CTR n = 7, AD n = 9, DS‐AD n = 6, PD n = 6, PD‐D n = 5 LC samples. Scale bar = 10 µm. (B) Mean area of Rab5+ puncta in a cell surface (ROI) per subject. (C) Mean density of Rab5+ puncta in cells of each subject (number of puncta per ROI). (D) Total area of Rab5+ puncta in a cell (ROI) for each subject. (E) Cell distribution according to their categorical median Rab5 puncta area. The proportion of cells with a median Rab5 puncta area volume ≤50th centile of the control group (small) is represented in light gray, the proportion of cells between the 50th and the 90th centiles of the control group (medium) is represented in gray, and the proportion of cells ≥90th centile (large) is represented in dark gray. Data were analyzed using one‐way ANOVA (p < 0.05) and post hoc Kruskal‐Wallis tests. AD, Alzheimer's disease; CTR, control; DS, Down syndrome; DS‐AD, Down syndrome with Alzheimer's disease; HE, hematoxylin and eosin; LC, locus coeruleus; PD, Parkinson's disease; PD‐D, Parkinson's disease with dementia; ROI, region of interest. *p < 0.05; (D) and (H): chi‐squared with p value indicated.
FIGURE 3
FIGURE 3
Lysosomal phenotype in noradrenergic cells of LC from patients with AD, DS‐AD, PD, and PD‐D. (A) Representative images of cystatin B (CTB) and TH immunolabeling of formalin‐fixed paraffin embedded sections from CTR n = 7, AD n = 9, DS‐AD n = 6, PD n = 6, PD‐D n = 5 LC samples. Scale bar = 100 µm. (B) Mean area of CTB+ puncta in a cell surface (ROI) per subject. (C) Mean density of CTB+ puncta in cells of each subject (number of vesicles per ROI). (D) Total area of CTB+ puncta in a cell (ROI) per each subject. (E) Cell distribution according to their categorical median CTB puncta area. The proportion of cells with a median CTB puncta area volume ≤50th centile of the control group (small) is represented in light gray, the proportion of cells between the 50th and the 90th centile of the control group (medium) is represented in gray, and the proportion of cells ≥90th centile (large) is represented in dark gray. Data were analyzed using one‐way ANOVA (p < 0.05) and post hoc Kruskal‐Wallis tests. AD, Alzheimer's disease; CTB, cathepsin B; DS‐AD, Down syndrome with Alzheimer's disease; LC, locus coeruleus; PD, Parkinson's disease; PD‐D, Parkinson's disease with dementia; ROI, region of interest. *p < 0.05; (D) and (H): chi‐squared with p value indicated.
FIGURE 4
FIGURE 4
Biochemical determinations of brain bioamines and DYRK1A levels in post mortem frozen LC from patients with AD, DS‐AD, PD, and PD‐D. (A) Levels of noradrenaline (NA), (B) 3,4‐dihydroxyphenylacetic acid, and (C) DYRK1A in LC from CTR n = 19, AD n = 17, DS‐AD n = 11, PD n = 10, PD‐D n = 10 cases. In (A–C), the determination was made using reversed‐phase ultra‐high‐performance liquid chromatography and in (D) using Meso Scale Discovery assay. Each point represents one individual. Data were analyzed using one‐way ANOVA (p < 0.05) and post hoc Kruskal‐Wallis tests. *p < 0.05; **p < 0.01; ***p < 0.001. AD, Alzheimer's disease; DS‐AD, Down syndrome with Alzheimer's disease; PD, Parkinson's disease; PD‐D, Parkinson's disease with dementia.
FIGURE 5
FIGURE 5
Quantification of β2‐adrenergic receptors in post mortem frozen tissues of LC target areas from patients with AD, DS, PD, and PD‐D. Levels of β2‐AR in (A) hippocampus and (B) prefrontal cortex. The total number of hippocampal/cortical samples analyzed were CTR = 7/8, AD = 7/7, DS‐AD = 9/8, PD = 8/8, and PD‐D = 8/8 (N = 3/4 technical replicates per individual sample). Data were analyzed using one‐way ANOVA (p < 0.05) followed by the Tukey's multiple‐comparisons post hoc test * p < 0.05. *p ≤.05. AD, Alzheimer's disease; CTR, control; DS, Down syndrome; DS‐AD, Down syndrome with Alzheimer's disease; PD, Parkinson's disease; PD‐D, Parkinson's disease with dementia.
FIGURE 6
FIGURE 6
Pearson's correlation matrix with data from LC (Aβ, pTau, α‐synuclein, endo‐lysosomal phenotypes, bioamines, Lcn2, and DYRK1A levels) in noradrenergic cells. Positive (+) and negative (−) correlations between features studied in LC of (A) CTR = 6, (B) AD = 9, (C) DS‐AD = 5, (D) PD and PD‐D = 7. AD, Alzheimer's disease; CTR, control; DS‐AD, Down syndrome with Alzheimer's disease; LC, locus coeruleus; PD, Parkinson's disease; PD‐D, Parkinson's disease with dementia.

Similar articles

References

    1. Waterhouse BD, Predale HK, Plummer NW, Jensen P, Chandler DJ. Probing the structure and function of locus coeruleus projections to CNS motor centers. Front Neural Circuits. 2022;16:895481. doi: 10.3389/fncir.2022.895481 - DOI - PMC - PubMed
    1. Tsukahara JS, Engle RW. Fluid intelligence and the locus coeruleus‐norepinephrine system. Proc Natl Acad Sci U S A. 2021;118(46):e2110630118. doi: 10.1073/pnas.2110630118 - DOI - PMC - PubMed
    1. Mann DM. The locus coeruleus and its possible role in ageing and degenerative disease of the human central nervous system. Mech Ageing Dev. 1983;23(1):73‐94. doi: 10.1016/0047-6374(83)90100-8 - DOI - PubMed
    1. Mercan D, Heneka MT. The Contribution of the Locus coeruleus‐Noradrenaline System Degeneration during the Progression of Alzheimer's Disease. Biology (Basel). 2022;11(12):1822. doi: 10.3390/biology11121822 - DOI - PMC - PubMed
    1. Saternos H, Hamlett ED, Guzman S, Head E, Granholm AC, Ledreux A. Unique Pathology in the Locus coeruleus of Individuals with Down Syndrome. J Alzheimers Dis. 2024;101(2):541‐561. doi: 10.3233/JAD-240043 - DOI - PMC - PubMed