. 2025 Jun 17;14(12):e038505.
doi: 10.1161/JAHA.124.038505. Epub 2025 Jun 12.

Omaveloxolone, But Not Dimethyl Fumarate, Improves Cardiac Function in Friedreich's Ataxia Mice With Severe Cardiomyopathy

Affiliations

Omaveloxolone, But Not Dimethyl Fumarate, Improves Cardiac Function in Friedreich's Ataxia Mice With Severe Cardiomyopathy

Lili Salinas et al. J Am Heart Assoc. .

Abstract

Background: Friedreich's ataxia (FA) is a genetic disorder caused by a severe decrease in FXN (frataxin) protein expression in mitochondria. The clinical manifestation of this disorder is a cerebellar ataxia; however, the common lethal component in FA is cardiomyopathy.

Methods: A conditional Fxnflox/null::MCK-Cre knockout (FXN-cKO) mouse model was used to mimic the late-stage severe cardiomyopathy in FA. Nrf2 (nuclear factor erythroid 2-related factor 2) inducers, omaveloxolone and dimethyl fumarate (DMF), were independently tested in this mouse model to determine the effects on cardiac health and lifespan.

Results: Omaveloxolone significantly improved cardiac contractile function and markers of heart failure in FA such as Nppb, Aldh1a3, and Gdf15. Despite improvement in cardiac function, omaveloxolone did not prevent premature death in FXN-cKO animals and notably accelerated death in FXN-cKO females. Omaveloxolone decreased oxidative stress and inflammatory marker IL1β (interleukin-1 beta), and stimulated Nqo1 gene expression above control level. DMF restored elevated HO-1 (Hmox) expression and significantly increased Sirt1 expression. Although both omaveloxolone and DMF restored decreased SERCA2 (Atp2a) and MCU (Mcu) expression and ameliorated elevated phosphorylation of CaMKIIδ at Thr286 site in FA hearts, DMF did not improve cardiac contractile function and survival. Furthermore, neither omaveloxolone or DMF decreased hypertrophy and fibrosis (Masson trichrome staining and Lgals3 expression) or rescued impaired mitochondrial function and integrative stress response in FXN-cKO hearts.

Conclusions: These data demonstrate that omaveloxolone significantly improved contractile function but not survival in FA hearts because cardiac fibrosis and wall stress persisted even with omaveloxolone treatment. More studies are warranted to determine the cause of premature death in omaveloxolone-treated FXN-cKO female mice.

Keywords: Friedreich's ataxia; animal models of human disease; calcium signaling; cardiomyopathy; dimethyl fumarate; omaveloxolone.


Conflict of interest statement

None.

Figures
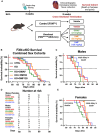
Figure 1
Figure 1. Experimental study design and survival outcomes.
A, Animal study design. Two sets of experimental animals were created. One set was created to monitor survival where animals were monitored daily until found dead in the cage or euthanizedat humane end point. The second cohort was a cross‐sectional study where all animals were evaluated and euthanized at 8 weeks of age. B, Kaplan–Meier survival curve in the combined sex cohorts of FXN‐cKO mice untreated (n=20) or treated with drugs (24 mg/kg OMAV [n=14], 82 mg/kg DMF [n=8], or 120 mg/kg DMF [n=22]). No death was observed on control mice (n=12) during the observation period. C, Kaplan–Meier curve in untreated control (n=10), FXN‐cKO (n=10), and FXN‐cKO males treated with 24 mg/kg OMAV (n=5), 82 mg/kg DMF (n=4), or 120 mg/kg DMF (n=12). D, Summary table indicates “n” number of animals involved in the survival study. E, Kaplan–Meier curve in untreated control (n=10), FXN‐cKO (n=10), and FXN‐cKO females treated with 24 mg/kg OMAV (n=9), 82 mg/kg DMF (n=4), or 120 mg/kg DMF (n=10). These n values represent the number of individual mice (biological replicates) included in the survival study for the combined sex cohorts and separately for male and female cohorts. A total of 76 animals was included in the survival experiment. DMF indicates dimethyl fumarate; FXN‐cKO, Fxnflox/null::MCK‐Cre knockout; KO, knockout; and OMAV, omaveloxolone.
Figure 2
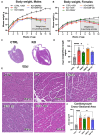
Figure 2. Morphological and histological characteristics of the heart in vehicle and drug treated FXN‐cKO mice.
A and B, Body weight changes over the time in vehicle and drug‐treated FXN‐cKO males and females. Data presented as mean values±SEM for the individual mice (biological replicates) allocated to each group. In male cohorts, n=4 in control group, n=6 in untreated FXN‐cKO group, n=5 for FXN‐cKO mice treated with 24 mg/kg OMAV n=4 for 82 mg/kg DMF‐treated group, and n=7 for 120 mg/kg DMF‐treated group. In female cohorts, n=4 in control group, n=5 in untreated FXN‐cKO group, n=4 in FXN‐cKO group treated with 24 mg/kg OMAV, n=4 in 82 mg/kg DMF‐treated group, and n=5 in 120 mg/kg DMF‐treated group. C, Control and FXN‐cKO hearts stained with hematoxylin and eosin to examine morphology of the hearts in FA. D, Heart weights normalized to tibia length at 8 weeks of age. The n value represents the number of individual hearts included in this analysis. One‐way ANOVA with Tukey's multiple comparisons test. ****P<0.0001, *P<0.05. E, Representative images of hematoxylin and eosin‐stained cardiac tissue reveal an increase in cardiomyocyte cross‐sectional area as quantified in summary graph. F, Cardiomyocyte cross‐sectional area measurements. The n value represents the number of individual heart histology slides analyzed (1 heart sample per slide, therefore representing a biological variance). One‐way ANOVA with Tukey's multiple comparisons test. ****P<0.0001. CTRL indicates control; DMF, dimethyl fumarate; FA, Friedreich's ataxia; FXN‐cKO, Fxnflox/null::MCK‐Cre knockout; KO, knockout; ns, non‐significant; OMAV, omaveloxolone; and VEH, vehicle.
Figure 3
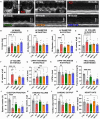
Figure 3. Effects of OMAV and DMF on cardiac function in the combined sex cohorts of FXN‐cKO mice.
A, Short‐axis B‐mode images of control and FXN‐cKO hearts were taken first as shown in images on the left, then guide was positioned across the heart avoiding papillary muscles, and M‐mode 2‐dimensional echocardiography images were recorded in CTRL and FXN‐cKO mice treated with vehicle, 24 mg/kg OMAV, 82 mg/kg DMF, and 120 mg/kg DMF for 5 weeks. B through M, Summary graphs reflecting effects of OMAV and DMF on LV mass (B), LV diameter at diastole (C) and systole (D) LV volume at diastole (E) and systole (F), LV posterior wall thickness at diastole (G), and systole (H), fractional shortening (I), ejection fraction (J), stroke volume (K), cardiac output (L), and heart rate (M). The symbols in each panel represent the number of individual mice (defined as biological replicates) involved in this study. In all panels, n=16 in control group, n=15 in untreated FXN‐cKO group, n=12 for FXN‐cKO mice treated with 24 mg/kg OMAV, n=6 for 82 mg/kg DMF‐treated group, and n=9 for 120 mg/kg DMF‐treated group. One outlier was removed from CTRL in (F) and (J). All data sets were analyzed with 1‐way ANOVA with Tukey's multiple comparisons test. ****P<0.0001, ***P<0.0005, **P<0.01, *P<0.05. CTRL indicates control; DMF, dimethyl fumarate; FXN‐cKO, Fxnflox/null::MCK‐Cre knockout; KO, knockout; LV, left ventricular; LVPW, left ventricular posterior wall; and OMAV, omaveloxolone.
Figure 4
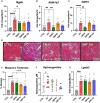
Figure 4. Efficacy of OMAV and DMF in protection against elevated heart failure markers and fibrosis.
A through C, Several heart failure markers were examined by gene expression including Nppb, Aldh1a3, and Gdf15. In these experiments, symbols represent heart samples collected from the individual mice in each group (biological replicates). D, 20× images of short‐axis cross‐sections of the heart stained with Masson's trichrome. E, Quantification of fibrotic area as a percentage of Masson trichrome blue staining from the total area. Symbols represent data from the individual hearts (biological replicates) that were stained with Masson's trichrome. F, Hydroxyproline levels in heart tissue (μmol/L). G, Gene expression of Lgals3 fibrotic marker. For (G) and (H), the n values represent the number of individual heart samples (defined as biological replicates), which were used in these experiments. n=8 to 13 in control groups, n=9 to 14 in untreated FXN‐cKO groups, n=9 to 12 in OMAV‐treated FXN‐cKO groups, n=5 to 6 in DMF82‐treated FXN‐cKO groups, and n=7to 9 in DMF120‐treated FXN‐cKO groups. One outlier was removed from OMAV in (A), DMF120 in (B), OMAV in (G), and DMF120 in (G). All data sets were analyzed with 1‐way ANOVA with Tukey's multiple comparisons test. ****P<0.0001, ***P<0.0005, **P<0.005, *P<0.05. ALDH1A3 indicates aldehyde dehydrogenase family 1 member A3 enzyme; CTRL, control; DMF, dimethyl fumarate; FXN‐cKO, Fxnflox/null::MCK‐Cre knockout; GDF‐15, growth differentiation factor 15; KO, knockout; Lgals3, galectin‐3; NPPB, natriuretic peptide precursor B; OMAV, omaveloxolone; and RPS18, ribosomal protein 18S.
Figure 5
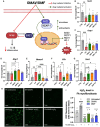
Figure 5. Mechanisms of target engagement by OMAV and DMF in FXN‐cKO hearts and FA myofibroblasts.
A, Schematic representation of the drugs mechanism of action. Created in https://BioRender.com. B, Gene expression of SOD2 (Sod2) in heart tissue. C, Gene expression of GSTP1 (Gstp1) in heart tissue. D, Gene expression of NQO1 (Nqo1) in heart tissue. E, Gene expression of HO‐1 (Hmox1) in heart tissue. F, Gene expression of IL1β (Il1b) in heart tissue. G, Gene expression of Sirt1 (Sirt1) in heart tissue. The gene expression was normalized to housekeeping gene Rsp18 and presented as fold change from control. The n values in (B) through (G) panels represent the number of individual heart samples (defined as biological replicates) which were used in these experiments. n=7 to 11 in control groups, n=9 to 11 in untreated FXN‐cKO groups, n=8 to 12 in OMAV‐treated FXN‐cKO groups, n=6 in DMF82‐treated FXN‐cKO groups, and n=8 to 9 in DMF120‐treated FXN‐cKO groups. (H) DCF fluorescence images of FA myofibroblasts untreated, treated with 50 nmol/L OMAV or with 10 μmol/L DMF, before and after hydrogen peroxide (H2O2, 10 μmol/L) addition to imitate oxidative stress. I, Summary graph reflects relative fluorescence of treated and untreated cells, unstimulated and stimulated with 10 μmol/L H2O2. n=8 different experiments per experimental condition. All data were analyzed with 1‐way ANOVA with Tukey's multiple comparisons test. For (I) panel, * denotes significance compared with untreated, unstimulated cells, + denotes significance compared with H2O2‐treated cells, and #### indicates the difference between untreated cells and H2O2‐treated cells without drugs. ****P<0.0001, ***P<0.0005, **P<0.005, *P<0.05. CTRL indicates control; DMF, dimethyl fumarate; FA, Friedreich's ataxia; FXN‐cKO, Fxnflox/null::MCK‐Cre knockout; GSTP, glutathione S‐transferase pi; HO‐1, heme‐oxygenase 1; IL1β, interleukin‐1 beta; KO, knockout; NQO1, NAPDH quinone dehydrogenase 1; OMAV, omaveloxolone; ROS, reactive oxygen species; RPS18, ribosomal protein 18S; Sirt1, sirtuin 1; and SOD2, superoxide dismutase 2.
Figure 6
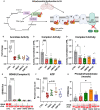
Figure 6. Effects of OMAV and DMF on mitochondrial function in FXN‐cKO hearts.
A, Schematic cartoon showing targets affected by the loss of Fe‐S clusters in the mitochondria. B, Aconitase activity was severe decreased in FXN‐cKO hearts and significantly improved by OMAV. C, Mitochondrial complex I activity in control and FXN‐cKO hearts. D, Mitochondrial complex II activity in control and FXN‐cKO hearts. E, Mitochondrial complex II expression (SDHB) in control and FXN‐cKO hearts measured by capillary Jesstern blot. F, ATP levels in cardiac tissue collected from control and FXN‐cKO hearts treated with either vehicle or drugs. G, PFKM expression in control and FXN‐cKO hearts measured by capillary Western blot. The symbols in each panel represent the number of individual heart samples (defined as biological replicates) which were used in these experiments. n=4 to 13 in control groups, n=5 to 12 in untreated FXN‐cKO groups, n=4 to 8 in OMAV‐treated FXN‐cKO groups, n=4 to 6 in DMF82‐treated FXN‐cKO groups, and n=4 to 9 in DMF120‐treated FXN‐cKO groups. One outlier was removed from DMF120 in (C), KO in (D), and CTRL in (G). All data were analyzed with 1‐way ANOVA with Tukey's multiple comparisons test. ****P<0.0001, ***P<0.001, *P<0.05. aTub indicates alpha tubulin; CTRL, control; DMF, dimethyl fumarate; FA, Friedreich's ataxia; FXN‐cKO, Fxnflox/null::MCK‐Cre knockout; KO, knockout; OMAV, omaveloxolone; PFKM, phosphofructokinase; SDHB, succinate dehydrogenase; and TCA, tricarboxylic acid.
Figure 7
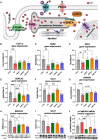
Figure 7. Effects of OMAV and DMF on calcium signaling in FXN‐cKO hearts.
A, Schematic cartoon representing potential targets of cardiac excitation‐contraction machinery affected by FA. Created in https://BioRender.com. B, CaV1.2 (Cacna1c) gene expression in control and FXN‐cKO hearts. C, Gene expression of cardiac RyR2 (Ryr2). D, Mcu gene expression of MCU. E, Atp2a2 gene expression of SERCA2 in control and FXN‐cKO hearts. F, Slc8a1 gene expression of NCX1 in control and FXN‐cKO hearts. G, Camk2d gene expression of CaMKIIδ in control and FXN‐cKO hearts. H, SERCA2 protein expression in the heart. I, NCX protein expression in control and FXN‐cKO heart. J, Protein expression of phosphorylated CaMKIIδ at Thr286 site normalized to total CaMKIIδ protein (p‐CAMKIIδ/CAMKIIδ) in control and FXN‐cKO heart. The symbols in each panel represent the number of individual heart samples (defined as biological replicates) that were used in these experiments. n=6 to 8 in control groups, n=8 to 9 in untreated FXN‐cKO groups, n=4 to 10 in OMAV‐treated FXN‐cKO groups, n=4 to 6 in DMF82‐treated FXN‐cKO groups, and n=4 to 8 in DMF120‐treated FXN‐cKO groups. One outlier was removed from DMF82 in (J). Data sets are analyzed with 1‐way ANOVA with Tukey's multiple comparisons test. ****P<0.0001, ***P<0.0005, **P<0.005, *P<0.05. aTub indicates alpha tubulin; CaMKIIδ, Ca2+‐calmodulin‐dependent protein kinase II delta; CaV1.2, L‐type Ca2+ channel subunit alpha1 C; CTRL, control; DMF, dimethyl fumarate; FXN‐cKO, Fxnflox/null::MCK‐Cre knockout; KO, knockout; MCU, mitochondrial Ca2+ uniporter; NCX1, sarcolemma Na+/Ca2+ exchanger 1; OMAV, omaveloxolone; PLB, phospholamban; PMCA, plasma membrane Ca2+ ATPase; RPS18, ribosomal protein 18S; Ryr2, ryanodine receptor 2; SERCA, sarcoendoplasmic reticulum calcium ATPase; and TnC, troponin C.
Figure 8
Figure 8. The integrative stress response in FXN‐cKO hearts was not affected by either OMAV or DMF.
A, Schematic cartoon representing the integrative stress response players in the heart. B, Protein expression of phosphorylated eIF2α at Ser residue normalized to total eIF2α (p‐eIF2α/eIF2α). C, Protein expression of BiP normalized to α‐tubulin in vehicle control and FXN‐cKO hearts, and FXN‐cKO hearts treated with either 24 mg/kg OMAV, 82 mg/kg DMF, or 120 mg/kg DMF daily. D, Protein expression of p‐PERK normalized to α‐tubulin. The symbols in each panel represent the number of individual heart samples (defined as biological replicates) which were used in these experiments. n=6 in control groups, n=8 in untreated FXN‐cKO groups, n=4 in OMAV‐treated FXN‐cKO groups, n=4 in DMF82‐treated FXN‐cKO groups, and n=4 in DMF120‐treated FXN‐cKO groups. All analyzed with 1‐way ANOVA with Tukey's multiple comparisons test. ****P<0.0001, **P<0.005, *P<0.05. ATF4 indicates activating transcription factor 4; aTub, alpha tubulin; BiP, binding immunoglobulin protein; CHOP, C/EBP homologous protein; CTRL, control; DMF, dimethyl fumarate; eIF2α, eukaryotic initiation factor‐2α; ER, endoplasmic reticulum; FXN‐cKO, Fxnflox/null::MCK‐Cre knockout; KO, knockout; OMAV, omaveloxolone; p‐PERK, phospho‐protein kinase‐like endoplasmic reticulum kinase; ROS, reactive oxygen species; and SR, sarcoplasmic reticulum.

References

    1. Campuzano V, Montermini L, Molto MD, Pianese L, Cossee M, Cavalcanti F, Monros E, Rodius F, Duclos F, Monticelli A, et al. Friedreich's ataxia: autosomal recessive disease caused by an intronic GAA triplet repeat expansion. Science. 1996;271:1423–1427. doi: 10.1126/science.271.5254.1423 - DOI - PubMed
    1. Campuzano V, Montermini L, Lutz Y, Cova L, Hindelang C, Jiralerspong S, Trottier Y, Kish SJ, Faucheux B, Trouillas P, et al. Frataxin is reduced in Friedreich ataxia patients and is associated with mitochondrial membranes. Hum Mol Genet. 1997;6:1771–1780. doi: 10.1093/hmg/6.11.1771 - DOI - PubMed
    1. Lu C, Cortopassi G. Frataxin knockdown causes loss of cytoplasmic iron‐sulfur cluster functions, redox alterations and induction of heme transcripts. Arch Biochem Biophys. 2007;457:111–122. doi: 10.1016/j.abb.2006.09.010 - DOI - PMC - PubMed
    1. Lushchak OV, Piroddi M, Galli F, Lushchak VI. Aconitase post‐translational modification as a key in linkage between Krebs cycle, iron homeostasis, redox signaling, and metabolism of reactive oxygen species. Redox Rep. 2014;19:8–15. doi: 10.1179/1351000213Y.0000000073 - DOI - PMC - PubMed
    1. Tsou AY, Paulsen EK, Lagedrost SJ, Perlman SL, Mathews KD, Wilmot GR, Ravina B, Koeppen AH, Lynch DR. Mortality in Friedreich ataxia. J Neurol Sci. 2011;307:46–49. doi: 10.1016/j.jns.2011.05.023 - DOI - PubMed

MeSH terms

LinkOut - more resources