. 2025 Jul 1;152(13):dev204564.
doi: 10.1242/dev.204564. Epub 2025 Jun 27.

In vivo transition in chromatin accessibility during differentiation of deep-layer excitatory neurons in the neocortex

Affiliations

In vivo transition in chromatin accessibility during differentiation of deep-layer excitatory neurons in the neocortex

Seishin Sakai et al. Development. .

Abstract

During neuronal differentiation, gene transcription patterns change in response to both intrinsic and extrinsic cues. Chromatin regulation at regulatory elements plays a key role in this process. However, how chromatin accessibility evolves in vivo in cortical neurons remains unclear. Here, we established a method for labeling differentiating neurons with specific birthdates. Using this method, we traced the 4-day differentiation process of in vivo deep-layer excitatory neurons in the mouse embryonic cortex and examined changes in the genome-wide transcription pattern and chromatin accessibility using RNA sequencing and DNase sequencing, respectively. We found that genomic regions of genes linked to mature neuronal functions, including deep layer-specific and stimulus-responsive genes, became accessible even at the embryonic stage. Additionally, our results indicated the involvement of bivalent marks in neural precursor/stem cells and Dmrt3 and Dmrta2 in the regulation of chromatin accessibility during neuronal differentiation. These findings highlight the importance of chromatin regulation in embryonic neurons, enabling the timely activation of neuronal genes during maturation.

Keywords: Bivalent genes; Chromatin accessibility; Cortical neurons; Differentiation; Dmrt; Mouse; Transcriptome.


Conflict of interest statement

Competing interests The authors declare no competing or financial interests.

Figures
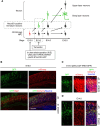
Fig. 1.
Fig. 1.
Genetic labeling of deep-layer neurons using in utero electroporation. (A) Experimental scheme used to label deep-layer neurons and trace their differentiation process. (B-D) pNeuroD1-ERT2CreERT2, pAAV-Ef1a-DIO-GFP and pCAG-mCherry plasmids (B,D) or pNeuroD1-IRES-GFP and pCAG-mCherry plasmids (C) were injected into the lateral ventricle of E12.0 embryos and electroporated. Pregnant mice were injected with tamoxifen at E13.0 (B,D). The brains were dissected out from the uterus at indicated stages and subjected to immunohistochemistry with anti-GFP, anti-RFP (mCherry) and anti-Ctip2 (B) antibodies. Nuclei were counterstained with Hoechst 33342. Images are representative of three samples. Scale bars: 400 µm (B); 200 µm (C,D). CP, cortical plate; IZ, intermediate zone; VZ/SVZ, ventricular/subventricular zone.
Fig. 2.
Fig. 2.
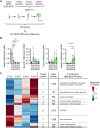
Transcriptomic changes during 4-day differentiation of deep-layer neurons. (A) Experimental scheme to isolate E12.0 NPCs and GFP-labeled neurons at E13.0, E14.0 and E16. (B) RT-qPCR analysis of isolated NPCs and neurons. Relative abundance of the indicated mRNA (normalized to the amount of Actb mRNA) is shown. Data are shown as mean+s.d. from three (E15.0) or four (E12.0, E13.0, E14.0 and E16.0) independent experiments. P-values between five groups were determined by one-way ANOVA followed by Tukey's multiple comparison test. *P<0.05, ****P<0.0001. (C) RNA-seq analysis of isolated E12.0 NPCs and E13.0, E14.0 and E16.0 neurons. Expression levels of DEGs between four cell types are shown in the heatmap as Z-score values. The DEGs were categorized into nine clusters, and the gene numbers and the top GO term in the Biological Process for each gene cluster are shown. Data are from two independent experiments.
Fig. 3.
Fig. 3.
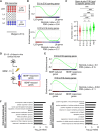
Changes in chromatin accessibility during 4-day differentiation of deep-layer neurons. (A) Experimental scheme of DNase-seq analysis. Data are from two independent experiments. (B) The numbers (left) and total width (right) of DHSs were identified at each time point. (C) Fractions of genomic features in the whole mouse genome (left) and DHSs at each time point (right). (D) Expression levels of genes with or without DHSs at each time point. Horizontal black lines mark the median. (E) Fractions of genomic features in DHSs of opening or closing genes from E12.0 NPCs to E16.0 neurons.
Fig. 4.
Fig. 4.
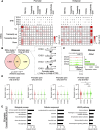
Chromatin opening at promoter regions of neuronal genes during 4-day differentiation of deep-layer neurons. (A) Significance of the overlap between DEG clusters (as shown in Fig. 2) and genes with (+) or without (−) DHSs at their promoter (left) or enhancer (right) regions was determined using Fisher's exact test. (B) Venn diagram showing an example of the overlap between DEG cluster 1 and the genes with DHSs at their promoter regions only at E16.0. (C) DNase-seq signals and expression levels of Rbfox1 genes in DEG cluster 1 with DHSs at its promoter region only at E16.0. (D) Expression levels of genes with DHSs at their promoter regions at each stage are shown. P-values were determined using the Friedman test, followed by Dunn's multiple comparison test. *P<0.05, **P<0.01, ****P<0.0001. Horizontal black lines mark the median. Data are from two independent experiments. (E) The top ten GO terms and the P-values of genes with DHSs at their promoter regions at only E16.0.
Fig. 5.
Fig. 5.
Association of genes opening from E12.0 NPCs to E16.0 neurons and deep layer-specific or BDNF-responsive genes. (A) RNA-seq analysis of layer 2/3 (upper layer) and layer 6 (deep layer) neurons at P56 (Belgard et al., 2011). (B) GSEA of opening (upper panel) or closing (lower panel) genes from E12.0 NPCs to E16.0 neurons in RNA-seq of layers 2/3 and 6. (C) Expression levels of opening and layer 6-specific genes from E12.0 NPCs to E16.0 neurons during differentiation from E12.0 NPCs to P56 neurons. P-values were determined using the Friedman test, followed by Dunn's multiple comparison test. *P<0.05, ****P<0.0001. Horizontal black lines mark the median. n=1. (D) Microarray analysis of in vitro primary culture neurons with or without BDNF stimulation for 1 h. Data are from three independent experiments. (E) GSEA of opening (upper panel) or closing (lower panel) genes from E12.0 NPCs to E16.0 in vitro primary culture neurons with or without BDNF stimulation. (F) GO analysis of opening (left) or closing (right) genes and BDNF-responsive genes from E12.0 NPCs to E16.0 neurons.
Fig. 6.
Fig. 6.
Association between chromatin opening during neuronal differentiation and bivalent state in NPCs. (A) PcG or TrxG-related factors enriched in E16.0-specific DHSs and their fold enrichment were determined using ChIP-Atlas analysis. (B) E12.0 NPCs were subjected to ChIP-seq analysis with H3K4me3 and H3K27me3 antibodies. Genes with both H3K4me3 and H3K27me3 peaks at their promoter regions were identified. Data are from two independent experiments. (C) The significance of the overlap between bivalent genes and genes with (+) or without (−) DHSs at their promoter regions was determined using Fisher's exact test. (D) The expression levels of H3K4me3 H3K27me3, H3K4me3+ H3K27me3, H3K4me3 H3K27me3+ and H3K4me3+ H3K27me3+ bivalent genes in E12.0 NPCs during 4-day differentiation are shown. P-values were determined using the Friedman test, followed by Dunn's multiple comparison test. **P<0.01, ***P<0.001, ****P<0.0001. Horizontal black lines mark the median. Data are from two independent experiments. (E) GO analysis of opening and bivalent genes from E12.0 NPCs to E16.0 neurons.
Fig. 7.
Fig. 7.
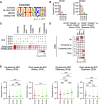
Association between Dmrt family proteins and gene activation during neuronal differentiation. (A) Motif analysis for E16.0 DHSs using HOMER software. The enriched motif (top) and Dmrt3-binding motif (bottom) are shown. (B) Expression levels of Dmrt3 and Dmrta2 were determined using RNA-seq as described for Fig. 2. (C) Significance of the overlap between genes with Dmrt3 or Dmrta2 peaks at their promoter regions and genes with (+) or without (−) DHSs at their promoter regions was determined using Fisher's exact test. (D) Significance of the overlap between DEG clusters determined in Fig. 2 and the up- or downregulated genes obtained by knocking out both Dmrt3 and Dmrta2 in the E12.5 telencephalon was determined using the Fisher's exact test. (E) Expression levels of up- or downregulated genes in Dmrt3 and Dmrta2 double knockout E12.5 telencephalon are shown. P-values were determined using the Friedman test, followed by Dunn's multiple comparison test. ***P<0.001, ****P<0.0001. Horizontal black lines mark the median. Data are from two independent experiments.

Similar articles

References

    1. Amemiya, H. M., Kundaje, A. and Boyle, A. P. (2019). The ENCODE Blacklist: identification of problematic regions of the genome. Sci. Rep. 9, 9354-9355. 10.1038/s41598-019-45839-z - DOI - PMC - PubMed
    1. Arlotta, P., Molyneaux, B. J., Chen, J., Inoue, J., Kominami, R. and Macklis, J. D. (2005). Neuronal subtype-specific genes that control corticospinal motor neuron development in vivo. Neuron 45, 207-221. 10.1016/j.neuron.2004.12.036 - DOI - PubMed
    1. Arnold, S. J., Huang, G.-J., Cheung, A. F. P., Era, T., Nishikawa, S.-I., Bikoff, E. K., Molnár, Z., Robertson, E. J. and Groszer, M. (2008). The T-box transcription factor Eomes/Tbr2 regulates neurogenesis in the cortical subventricular zone. Genes Dev. 22, 2479-2484. 10.1101/gad.475408 - DOI - PMC - PubMed
    1. Azuara, V., Perry, P., Sauer, S., Spivakov, M., Jørgensen, H. F., John, R. M., Gouti, M., Casanova, M., Warnes, G., Merkenschlager, M.et al. (2006). Chromatin signatures of pluripotent cell lines. Nat. Cell Biol. 8, 532-538. 10.1038/ncb1403 - DOI - PubMed
    1. Belgard, T. G., Marques, A. C., Oliver, P. L., Abaan, H. O., Sirey, T. M., Hoerder-Suabedissen, A., García-Moreno, F., Molnár, Z., Margulies, E. H. and Ponting, C. P. (2011). A transcriptomic atlas of mouse neocortical layers. Neuron 71, 605-616. 10.1016/j.neuron.2011.06.039 - DOI - PMC - PubMed

LinkOut - more resources