. 2025 Jun;14(3):158-163.
doi: 10.14740/jh2021. Epub 2025 Apr 22.

Differential MicroRNA Profiles Associated With the Hydroxyurea-Inducible SAR1A Gene

Affiliations

Differential MicroRNA Profiles Associated With the Hydroxyurea-Inducible SAR1A Gene

Chutima Kumkhaek et al. J Hematol. 2025 Jun.
No abstract available


Conflict of interest statement

None to declare.

Figures

Figure 1
Figure 1
Plots of differentially expressed miRNAs from three sample groups each of wild-type and SAR1A-knockout (SAR1-KO) K562 cells without or with hydroxyurea (HU) treatment. (a) Principle component analysis (PCA) clustering of miRNA expression by sample group is denoted by different color (wild type - blue; SAR1A-knockout - red) and reveals complete separation of miRNA expression after the knockout of SAR1A expression. (b) A heatmap illustrating miRNA expression patterns. The dendrograms show hierarchical clusters representing the similarities and dissimilarities in expression profiles among samples and miRNAs. (c) Volcano plots of miRNAs expressed differentially in wild type or SAR1A-knockout K562 cells compared with those with HU treatment and SAR1A-knockout K562 cells without or with HU treatment relative to the wild type. The red dots represent the significantly upregulated miRNAs by P < 0.05 and fold change > 2, blue dots represent the significantly downregulated miRNAs by P < 0.05 and fold change < 2, gray dots represent miRNAs that were upregulated or downregulated at least two-fold but were not significant by P < 0.05, and black dots represent miRNAs that were not differentially expressed. Named miRNAs are those with the three largest fold-changes among the down- or upregulated miRNAs in wild type and SAR1A-knockout K562 cells without or with hydroxyurea treatment.
Figure 2
Figure 2
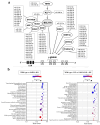
Target genes and Kyoto Encyclopedia of Genes and Genomes (KEGG) pathway analysis of miRNAs differentially expressed in response to SAR1A knockout. (a) The differentially expressed miRNAs link to 11 genes (DNMT1, DNMT3A, GATAD2B, HDAC1, IKZF1, KLF1, MYB, PPARGC1A, RUNX1, SOX6, and ZBTB7A) that were previously reported to influence HbF expression. The dotted lines indicate predicted links of differentially expressed miRNAs to target genes. (b) Significantly enriched KEGG pathways involving 132 and 99 differentially expressed miRNAs in SAR1A-knockout K562 cells without and with hydroxyurea (HU) treatment, respectively. Those KEGG pathways with P < 0.01 were selected.

Similar articles

References

    1. Sundd P, Gladwin MT, Novelli EM. Pathophysiology of sickle cell disease. Annu Rev Pathol. 2019;14:263–292. doi: 10.1146/annurev-pathmechdis-012418-012838. - DOI - PMC - PubMed
    1. McGann PT, Ware RE. Hydroxyurea therapy for sickle cell anemia. Expert Opin Drug Saf. 2015;14(11):1749–1758. doi: 10.1517/14740338.2015.1088827. - DOI - PMC - PubMed
    1. Sato K, Nakano A. Mechanisms of COPII vesicle formation and protein sorting. FEBS Lett. 2007;581(11):2076–2082. doi: 10.1016/j.febslet.2007.01.091. - DOI - PubMed
    1. Van der Verren SE, Zanetti G. The small GTPase Sar1, control centre of COPII trafficking. FEBS Lett. 2023;597(6):865–882. doi: 10.1002/1873-3468.14595. - DOI - PubMed
    1. Tang DC, Zhu J, Liu W, Chin K, Sun J, Chen L, Hanover JA. et al. The hydroxyurea-induced small GTP-binding protein SAR modulates gamma-globin gene expression in human erythroid cells. Blood. 2005;106(9):3256–3263. doi: 10.1182/blood-2003-10-3458. - DOI - PMC - PubMed

LinkOut - more resources