[Preprint]. 2025 Jun 1:2025.05.29.656153.
doi: 10.1101/2025.05.29.656153.

Ketogenesis is dispensable for the metabolic adaptations to caloric restriction

Affiliations

Ketogenesis is dispensable for the metabolic adaptations to caloric restriction

Chung-Yang Yeh et al. bioRxiv. .

Abstract

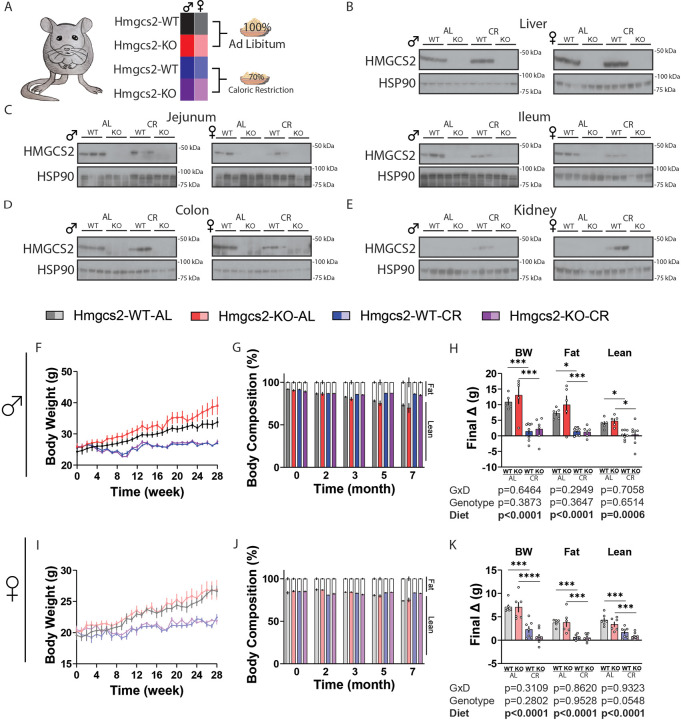
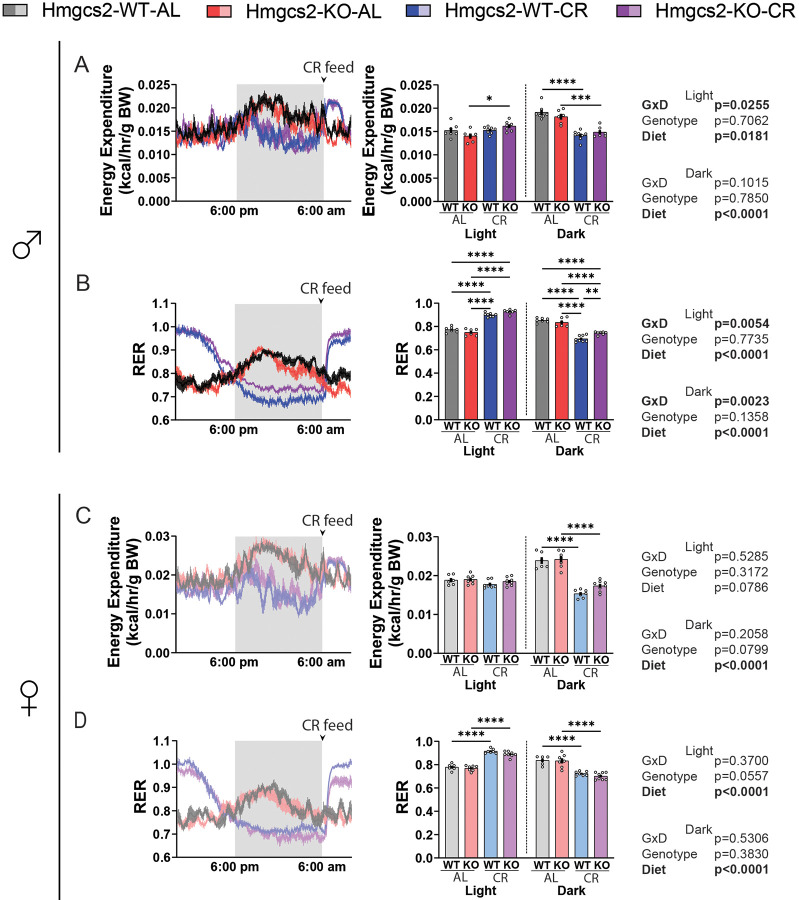
Caloric restriction (CR) robustly extends the health and lifespan of diverse species. When fed once daily, CR-treated mice rapidly consume their food and endure a prolonged fast between meals. As fasting is associated with a rise in circulating ketones, we decided to investigate the role of ketogenesis in CR using mice with whole-body ablation of Hmgcs2, the rate-limiting enzyme producing the main ketone body β-hydroxybutyrate (βHB). Here, we report that Hmgcs2 is largely dispensable for many metabolic benefits of CR, including CR-driven changes in adiposity, glycemic control, liver autophagy, and energy balance. Although we observed sex-specific effects of Hmgcs2 on insulin sensitivity, fuel selection, and adipocyte gene expression, the overall physiological response to CR remains robust in mice lacking Hmgcs2. To gain insight into why deletion of Hmgcs2 does not disrupt CR, we measured fasting βHB levels as mice began a CR diet. Surprisingly, as CR-fed mice adapt to CR, they no longer engage high levels of ketogenesis during the daily fast. Our work suggests that the benefits of long-term CR in mice are not mediated by ketogenesis.

Keywords: BHB; caloric restriction; dietary restriction; ketogenesis; ketones; metabolic health; metabolism.


Conflict of interest statement

DWL has received funding from, and is a scientific advisory board member of, Aeovian Pharmaceuticals, which seeks to develop novel, selective mTOR inhibitors for the treatment of various diseases.

Figures

Figure 1.
Figure 1.. The ablation of ketogenesis does not alter the effect of caloric restriction on body weight and body composition.
(A) Main experimental setup of the caloric restriction study. (B-E) Western blot confirmation of the ablation of Hmgcs2 in the KO animals of both AL and CR groups in the liver (B), the small intestine jejunum and ileum (C), the large intestine colon (D), and the kidney (E). (F-H) Male mice body weight (F), body composition % (G), and final changes in body composition (H) over 7 months. For (F) and (G), at the beginning of the experiment, WT-AL, KO-AL, WT-CR, KO-CR, n=7,6,8,7 respectively; for (H) n=5,5,8,6. (I-K) Female mice body weight (I), body composition % (J), and final changes in body composition (K) over 7 months. For (I) and (J), at the beginning of the experiment, WT-AL, KO-AL, WT-CR, KO-CR, n=6,7,7,9 respectively; for (K) n=6,6,7,8. (H & K) *p<0.05, ***p<0.001, ****p<0.0001, Sidak’s test post 2-way ANOVA. Data presented as mean ± SEM.
Figure 2.
Figure 2.. The ablation of ketogenesis selectively improves insulin sensitivity in females.
(A-D) After 21 hrs fasting in male mice, the results of glucose tolerance test (A; 1 g/kg; I. P.), insulin tolerance test (B; 0.5 U/kg; I. P.), pyruvate tolerance test (C; 2 g/kg; I. P.), and HOMA-IR measurements (D). For WT-AL, KO-AL, WT-CR, and KO-CR in each experiment, GTT n=7,6,8,7; ITT n=7,6,8,6; PTT n=7,6,8,6; HOMA-IR n=7,5,8,7. (E-H) After 21 hrs fasting in female mice, the results of glucose tolerance test (E; 1 g/kg; I. P.), insulin tolerance test (F; 0.5 U/kg; I. P.), pyruvate tolerance test (G; 2 g/kg; I. P.), and HOMA-IR measurements (H). For WT-AL, KO-AL, WT-CR, and KO-CR in each experiment, GTT n=6,7,7,8; ITT n=6,7,6,8; PTT n=6,7,7,8; HOMA-IR n=9,7,8,7. (A-H) *p<0.05, **p<0.01, ***p<0.001, ****p<0.0001, Sidak’s test post 2-way ANOVA. Data presented as mean ± SEM.
Figure 3.
Figure 3.. The ablation of ketogenesis induce sex-specific changes in RER.
(A-B) Male mice energy expenditure (A) and respiratory exchange ratio (B) expressed over a 24 hrs period and binned by light/dark cycle. For WT-AL, KO-AL, WT-CR, and KO-CR, n=7,6,8,7. (C-D) Female mice energy expenditure (C) and respiratory exchange ratio (D) expressed over a 24 hrs period and binned by light/dark cycle. For WT-AL, KO-AL, WT-CR, and KO-CR, n=6,7,7,8. (A-D) *p<0.05, **p<0.01, ***p<0.001, ****p<0.0001, Sidak’s test post 2-way ANOVA, completed separately for each cycle. Data presented as mean ± SEM.
Figure 4.
Figure 4.. Loss of ketogenesis does not alter the effects of CR on iWAT physiology.
(A-C) In male mice, representative H&E staining of the iWAT (A), iWAT weight (B) and the average size of adipocytes (C). For WT-AL, KO-AL, WT-CR, and KO-CR, iWAT weight n=5,3,5,4; adipocyte size n=4,3,4,4. (D-E) Male iWAT gene expression of Ucp1 (D), n=6 each group; iWAT gene expression level of lipid processing genes (E) Dgat1, Elovl3, Cidea, Fasn, and Acc1. n=6 each group for Dgat1, Fasn, and Acc1; for WT-AL, KO-AL, WT-CR, and KO-CR, Elovl3 n=5,6,6,5; Cidea n=6,5,6,5. (F-H) In female mice, representative H&E staining of the iWAT (F), iWAT weight (G) and the average size of adipocytes (H). For WT-AL, KO-AL, WT-CR, and KO-CR, iWAT weight n=5,4,5,3; adipocyte size n=4 each group. (I-J) Female iWAT gene expression of Ucp1 (I). For WT-AL, KO-AL, WT-CR, and KO-CR, n=6,5,6,6. Female iWAT gene expression level of lipid processing genes (J) Dgat1, Elovl3, Cidea, Fasn, and Acc1. n=6 each group for Dgat1 and Acc1; Elovl3 n=4,6,4,6; Cidea n=6,6,5,6; Fasn n=6,6,4,6. (B-E & G-J) *p<0.05, **p<0.01, ***p<0.001, ****p<0.0001, Sidak’s test post 2-way ANOVA (E & J) conducted separately for each gene. Data presented as mean ± SEM.
Figure 5.
Figure 5.. Caloric restriction upregulates autophagy-related proteins in the liver regardless of ketogenesis.
(A-B) Liver western blots in male (A) and female (B) mice for p62 and LC3. n=9 each group. *p<0.05, Sidak’s test post 2-way ANOVA conducted separately for each protein. Data presented as mean ± SEM.
Figure 6.
Figure 6.. Acclimation to a recurrent fasting caloric restriction protocol suppresses ketogenesis.
(A) Circulating βHB level of male + female mice measured every 4 hrs under typical experimental conditions (food present for AL groups/CR groups fed at 6 am). For WT-AL, KO-AL, WT-CR, and KO-CR, n=8,8,14,8. (B) Circulating βHB level of typically ad libitum-fed male + female mice fasting starting at 6 am. n=8 each group. (C) Diagram of the CR acclimation experiment using a separate cohort of mice. (D-E) Fasting βHB level of male (D) and female (E) mice during the acclimation phase of the CR protocol. For WT-AL, KO-AL, WT-CR, and KO-CR, male n=6,7,4,5; female n=5,4,5,5. (A & D-E) *p<0.05, **p<0.01, ***p<0.001, ****p<0.0001, Sidak’s test post 2-way ANOVA. (B) *p<0.05, t-test. Data presented as mean ± SEM.
Figure 7.
Figure 7.. Caloric restriction enhances ketogenesis and ketolysis capacity.
(A-B) Lipid tolerance test using MCT oil (5 ml/kg; P. O.) in male (A) and female (B) mice. Circulating βHB is unchanged in the KO mice of both sexes while CR significantly enhances ketogenic ability in the lipid tolerance test. For WT-AL, KO-AL, WT-CR, and KO-CR, male n=5,3,5,5; female n=5 each group. (C-D) Ketone tolerance test using sodium 3-β-hydroxybutyrate in saline (2 g/kg; I. P.) 4 hrs after CR-feeding and AL fasting. Ketone consumption is improved in male (C) and female (D) mice treated with CR. Male n=5 each group; for WT-AL, KO-AL, WT-CR, and KO-CR, female n=5,5,4,5. (E-F) Heatmap representation of the discrete dataset in this study for male (E) and female (F), expressed as Z-score comparisons within individual variables, sorted by the difference of WT-CR vs KO-CR. (A-D) *p<0.05, **p<0.01, ***p<0.001, ****p<0.0001, Sidak’s test post 2-way ANOVA. Data presented as mean ± SEM.

Similar articles

References

    1. Green C.L., Lamming D.W., and Fontana L. (2022). Molecular mechanisms of dietary restriction promoting health and longevity. Nat Rev Mol Cell Biol 23, 56–73. 10.1038/s41580-021-00411-4. - DOI - PMC - PubMed
    1. Duregon E., Pomatto-Watson L., Bernier M., Price N.L., and de Cabo R. (2021). Intermittent fasting: from calories to time restriction. Geroscience 43, 1083–1092. 10.1007/s11357-021-00335-z. - DOI - PMC - PubMed
    1. Acosta-Rodríguez V.A., de Groot M.H.M., Rijo-Ferreira F., Green C.B., and Takahashi J.S. (2017). Mice under Caloric Restriction Self-Impose a Temporal Restriction of Food Intake as Revealed by an Automated Feeder System. Cell Metab 26, 267–277.e262. 10.1016/j.cmet.2017.06.007. - DOI - PMC - PubMed
    1. Bruss M.D., Khambatta C.F., Ruby M.A., Aggarwal I., and Hellerstein M.K. (2010). Calorie restriction increases fatty acid synthesis and whole body fat oxidation rates. Am J Physiol Endocrinol Metab 298, E108–116. 10.1152/ajpendo.00524.2009. - DOI - PMC - PubMed
    1. Pak H.H., Haws S.A., Green C.L., Koller M., Lavarias M.T., Richardson N.E., Yang S.E., Dumas S.N., Sonsalla M., Bray L., et al. (2021). Fasting drives the metabolic, molecular and geroprotective effects of a calorie-restricted diet in mice. Nat Metab 3, 1327–1341. 10.1038/s42255-021-00466-9. - DOI - PMC - PubMed

Publication types