[Preprint]. 2025 May 28:2025.05.24.655962.
doi: 10.1101/2025.05.24.655962.

Spatiotemporal Single-Cell Analysis Reveals T Cell Clonal Dynamics and Phenotypic Plasticity in Human Graft-versus-Host Disease

Affiliations

Spatiotemporal Single-Cell Analysis Reveals T Cell Clonal Dynamics and Phenotypic Plasticity in Human Graft-versus-Host Disease

Lingting Shi et al. bioRxiv. .

Abstract

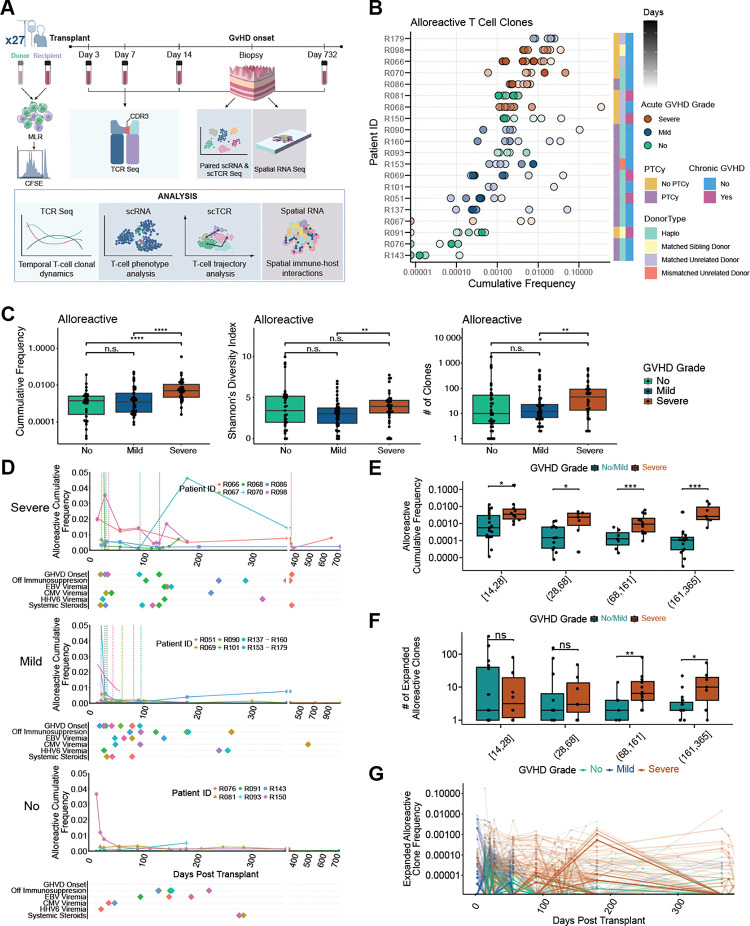
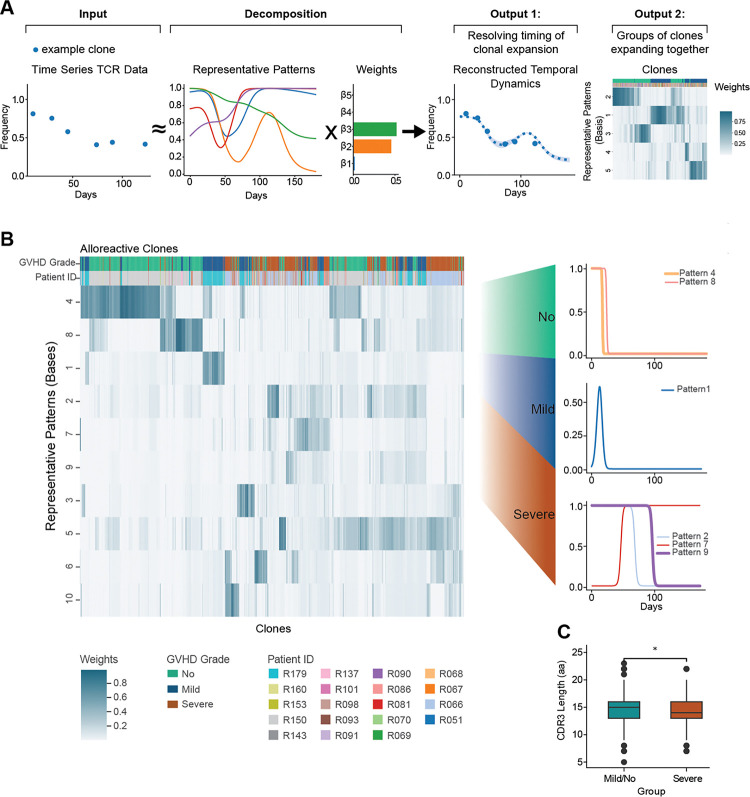
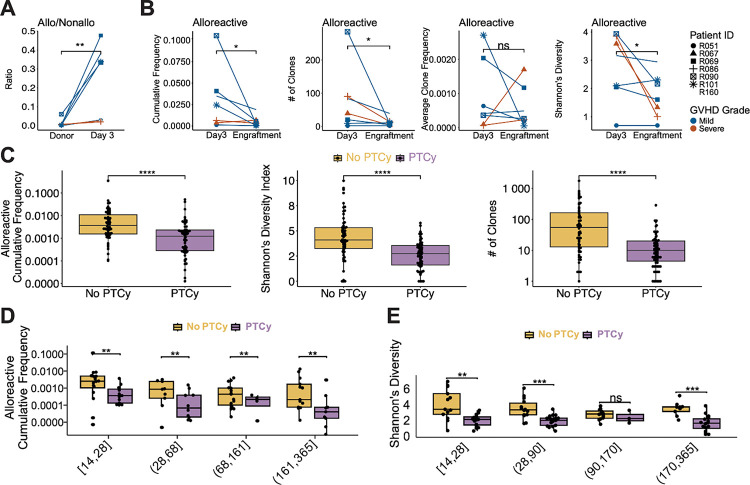
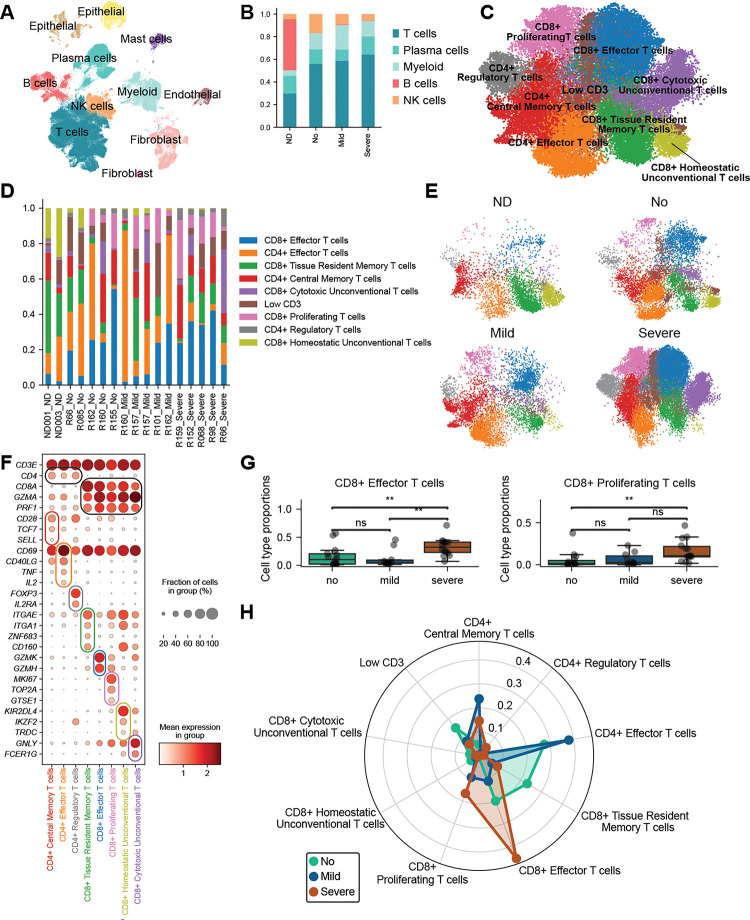
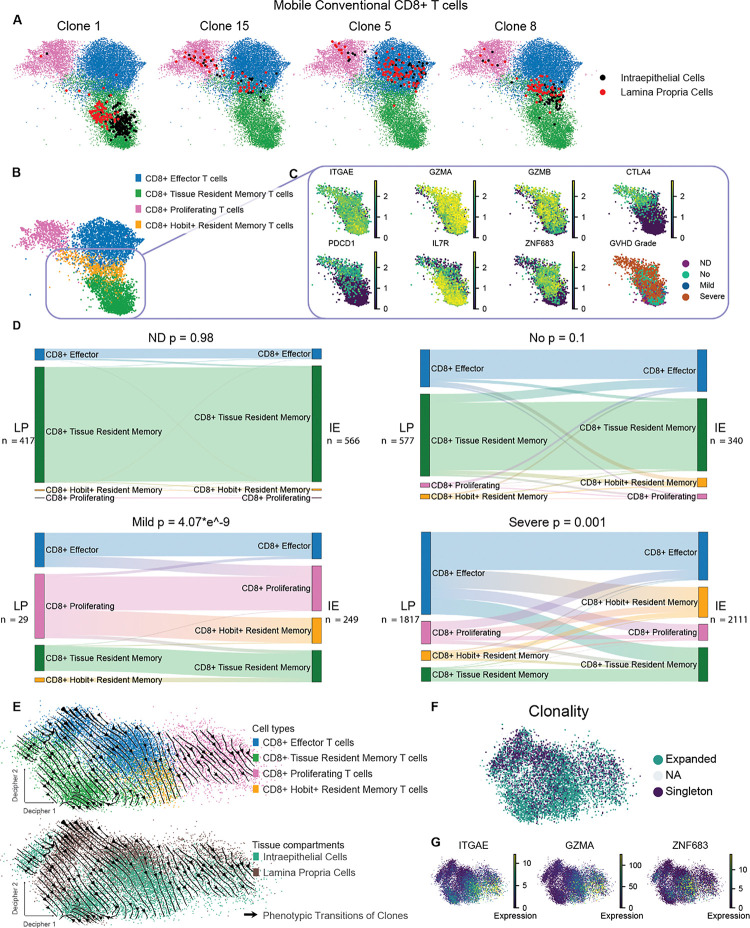
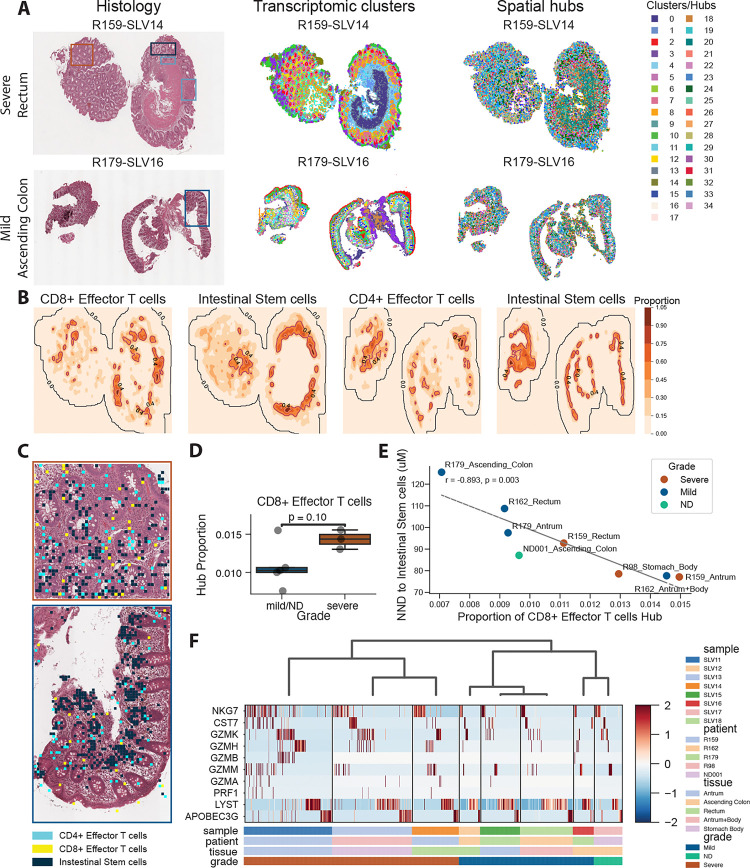
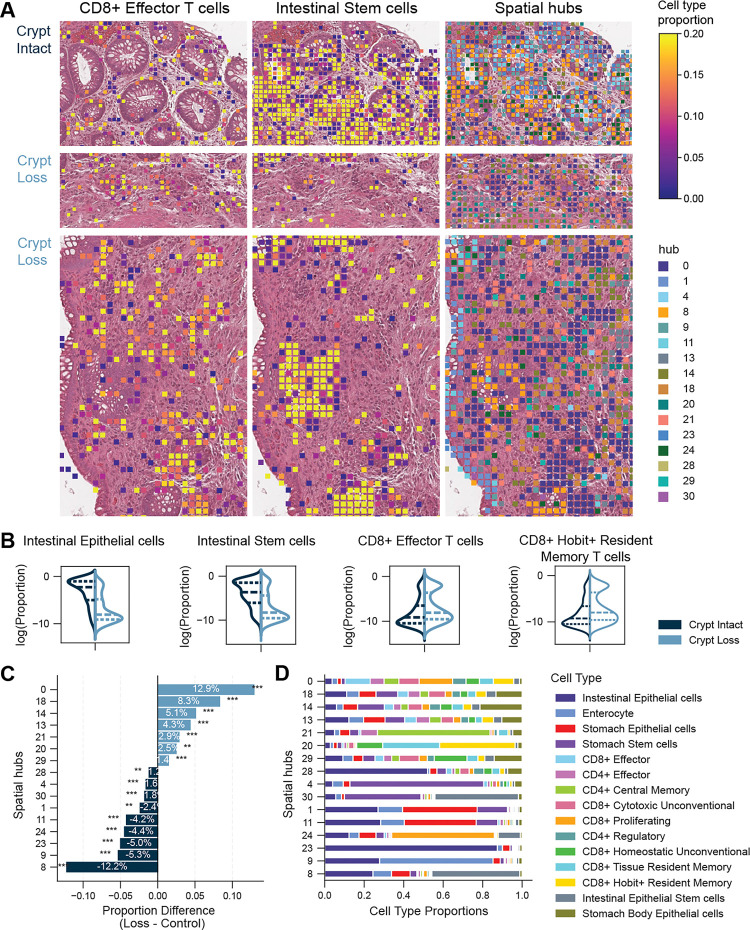
Allogeneic hematopoietic cell transplantation (alloHCT) is curative for various hematologic diseases but often leads to acute graft-versus-host disease (GVHD), a potentially life-threatening complication. We leverage GVHD as a uniquely tractable disease model to dissect complex T-cell-mediated pathology in 27 alloHCT recipients. We integrate pre-transplant identification of alloreactive T-cells with longitudinal tracking across blood and gut, using mixed lymphocyte reaction-based clonal "fingerprinting", TCR clonotyping, single-cell RNA/TCR sequencing, and spatial transcriptomics. Using DecompTCR, a novel computational tool for longitudinal TCR analysis, we uncover clonal expansion programs linked to GVHD severity and TCR features. Multi-omics profiling of gut biopsies reveals enrichment and clonal expansion of CD8+ effector and ZNF683(Hobit)+ resident memory T-cells, cytolytic remodeling of regulatory and unconventional T-cells, and localization of CD8+ effector T-cells near intestinal stem cells in crypt loss regions. This framework defines dynamic immune circuit rewiring and phenotypic plasticity with implications for biomarkers and therapies.

Keywords: Graft-versus-host disease; allogeneic hematopoietic cell transplantation; alloreactive T cells; phenotypic plasticity; probabilistic model; single-cell genomics; spatial transcriptomics; temporal dynamics.


Conflict of interest statement

Declaration of interests R.R. reports consulting or advisory role with Allogene, Bayer, Gilead Sciences, Incyte, TScan, Orca Bio, Pierre Fabre Pharmaceuticals, CareDx, Sana Biotechnology, Sail Biomedicines and Autolus, and research funding from Atara Biotherapeutics, Incyte, Sanofi, Immatics, Abbvie, Takeda, Gilead Sciences, CareDx, TScan, Cabaletta, Synthekine, BMS, J&J, Allogene, Genentech, Vittoria Therapeutics, AstraZeneca, Kinomica and Imugene.

Figures

Figure 1.
Figure 1.. Severe GVHD is Associated with Expansion and Increased Diversity of Alloreactive Clones in the Blood.
A) Schematic representation of the dataset and the analytical workflow. The diagram provides an overview of the data acquisition and downstream analyses conducted. B) Overview of the time-series TCR repertoire dataset. Patients were ordered vertically based on median cumulative alloreactive T cell frequency. Each dot represents a PBMC sample, color-coded by the patient’s acute GVHD grade, with darker shades denoting samples collected at later time points. C) Alloreactive T cell frequencies, diversity, and unique clone counts in patients grouped by GVHD grade (Benjamini-Hochberg adjusted Wilcoxon rank-sum test). D) Cumulative alloreactive frequency over time in patients with severe (top), mild (middle), and no (bottom) GVHD. The vertical color-coded dotted lines indicate GVHD onset. Other key clinical events such as cessation of immunosuppression, steroid use, and viral reactivations (EBV, CMV, HHV6) are shown below the respective plots. E, F) Cumulative frequency and number of expanded alloreactive clones over time (Benjamini-Hochberg adjusted Wilcoxon rank-sum test, * P < 0.05, ** P < 0.01, *** P < 0.001, **** P < 0.0001). G) Frequency over time of expanded alloreactive clones in patients with severe, mild, and no GVHD (color-coded).
Figure 2.
Figure 2.. Time-Resolved Dynamic Modeling of T Cell Clones Demonstrates Associations between Alloreactive Clones and GVHD Severity.
(A) Simulated data illustrating basis decomposition of individual T cell clones using DecompTCR. (B) Basis functions and corresponding weights derived from DecompTCR applied to alloreactive clones. The heatmap displays the weights of different bases (rows) with patient IDs and GVHD grades annotated across the columns. (C) Basis decomposition reveals shorter CDR3 amino acid length in T cell clones associated with severe GVHD-specific patterns (Wilcoxon rank-sum test with Holm adjustment, * P < 0.05, ** P < 0.01, *** P < 0.001, **** P < 0.0001).
Figure 3.
Figure 3.. PTCy Selectively Depletes Expanding Alloreactive T Cell Clones.
(A) Cumulative frequency of alloreactive clones normalized to non-alloreactive clones on donor sample and Day 3 (paired t-test, one-sided, R090 was excluded due to an abnormally high ratio, indicating it was an outlier.). (B) Analysis of cumulative frequency, number of clones, average clone frequency, and Shannon’s diversity for alloreactive clones comparing D3 and the engraftment time point in PTCy-treated patients. (C) Comparison of cumulative frequency, Shannon’s diversity index, and number of unique clones between PTCy-treated and untreated patients. (D) Temporal comparison of cumulative alloreactive frequency across multiple time points (Benjamini-Hochberg adjusted Wilcoxon rank-sum test). (E) Temporal dynamics of Shannon’s diversity were analyzed for all clones, comparing PTCy-treated patients with untreated patients (Benjamini-Hochberg adjusted Wilcoxon rank-sum test,* P < 0.05, ** P < 0.01, *** P < 0.001, **** P < 0.0001).
Figure 4.
Figure 4.. Enrichment of T Cell States in Severe GVHD.
(A) UMAP visualization of scRNA-seq data from gut tissue biopsies with cell type annotation. (B) Proportions of immune cell populations across different GVHD grades. (C) UMAP visualization highlighting T cell states. (D) Proportions of cell states for each patient. (E) UMAP representation of cells stratified by GVHD grades versus normal donor (ND). (F) Representative gene list utilized for cell type annotation. (G) Cell type proportions for CD8+ effector T cells and CD8+ proliferating T cells within all T cells grouped by GVHD grade; each dot represents an individual sample (no GVHD and ND were combined as no). (H) Radar plot showing proportions of various T cell states by GVHD grade (no GVHD and ND were combined as no).
Figure 5.
Figure 5.. Phenotypic Plasticity of T Cells Across Tissue Compartments in GVHD Patients.
(A) UMAP projections of CD8+ T cell populations, color-coded by cluster annotation. Key expanding clones are marked (Black: IE, Red: LP). (B) UMAP plot displaying CD8+ T cell subpopulations, including effector T cells, tissue resident memory T cells, proliferating T cells, and Hobit+ resident memory T cells. (C) Expression profiles of key genes (ITGAE, GZMA, GZMB, CTLA4, PDCD1, IL7R) across GVHD severity grades, shown with corresponding color intensity scales. (D) Sankey diagrams illustrating cell state transitions across GVHD severity groups (ND, no, mild, severe, Fisher’s exact test, n is the number of cells). (E) Decipher analysis projecting CD8+ T cell populations based on Decipher 1 and 2 axes. Arrows represent the transition of shared clones from LP to IE. (F) T cell clonality in Decipher space showing expanded clones and singletons. (G) Gene expression of ITGAE, ZNF683, and GZMA is plotted on the decipher space.
Figure 6.
Figure 6.. CD8+ Effector T Cells Cluster in Proximity to Intestinal Stem Cells in Severe GVHD.
(A) Histology, transcriptomic clusters, and spatial hubs in representative colon samples from severe (SLV14) and mild (SLV16) GVHD patients. (B) Contour plots showing CD8+/CD4+ Effector T cell and ISC proportions from Starfysh deconvolution. (C) Zoomed-in views of SLV14 and SLV16 highlight hubs enriched for CD8+/CD4+ Effector T cells and ISCs. (D) Box plot comparing CD8+ Effector T cell proportions between severe and mild/no GVHD (t-test). (E) Scatter plot of mean nearest neighbor distance (NND) from CD8+ Effector T cells to ISCs versus CD8+ Effector T cell proportion. (F) Heatmap displaying CD8+ Effector T cell signature expression across all samples.
Figure 7.
Figure 7.. Collaborative T Cell Response in Crypt Loss Regions.
(A) CD8+ Effector T cell (left) and ISC (middle) proportions inferred from StarfyshHD, along with spatial hubs that are enriched in either crypt intact and crypt loss region (right, see C) in crypt loss and intact regions of SLV14 (crypt loss contains area of crypt loss and increase crypt apoptosis). Histology images are shown in the background. (B) Violin plots comparing cell type proportions between crypt loss and intact regions (Mann-Whitney U-test, p<0.0001). (C) Hubs enriched or depleted in crypt loss regions (Fisher’s exact test). (D) A stacked bar plot shows cell type composition in the differentially abundant hubs.

Similar articles

References

    1. Bolaños-Meade J., Hamadani M., Wu J., Al Malki M.M., Martens M.J., Runaas L., Elmariah H., Rezvani A.R., Gooptu M., Larkin K.T., et al. (2023). Post-Transplantation Cyclophosphamide-Based Graft-versus-Host Disease Prophylaxis. N. Engl. J. Med. 388, 2338–2348. - PMC - PubMed
    1. Watkins B., Qayed M., McCracken C., Bratrude B., Betz K., Suessmuth Y., Yu A., Sinclair S., Furlan S., Bosinger S., et al. (2021). Phase II trial of costimulation blockade with abatacept for prevention of acute GVHD. J. Clin. Oncol. 39, 1865–1877. - PMC - PubMed
    1. Reshef R., Saber W., Bolaños-Meade J., Chen G., Chen Y.-B., Ho V.T., Ponce D.M., Nakamura R., Martens M.J., Hansen J.A., et al. (2021). Acute GVHD diagnosis and adjudication in a multicenter trial: A report from the BMT CTN 1202 biorepository study. J. Clin. Oncol. 39, 1878–1887. - PMC - PubMed
    1. Holtan S.G., Yu J., Choe H.K., Paranagama D., Tang J., Naim A., Galvin J., and Joachim Deeg H. (2022). Disease progression, treatments, hospitalization, and clinical outcomes in acute GVHD: a multicenter chart review. Bone Marrow Transplant. 57, 1581–1585. - PMC - PubMed
    1. Zeiser R., and Blazar B.R. (2018). Acute Graft-versus-Host Disease. N. Engl. J. Med. 378, 586. - PubMed

Publication types