[Preprint]. 2025 Jun 7:2025.06.06.658382.
doi: 10.1101/2025.06.06.658382.

Categorizing prediction modes within low-pLDDT regions of AlphaFold2 structures

Affiliations

Categorizing prediction modes within low-pLDDT regions of AlphaFold2 structures

Christopher J Williams et al. bioRxiv. .

Update in

Abstract

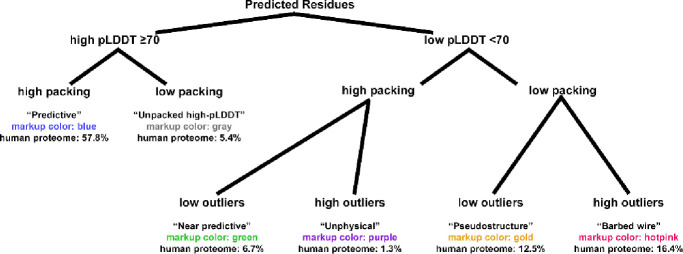
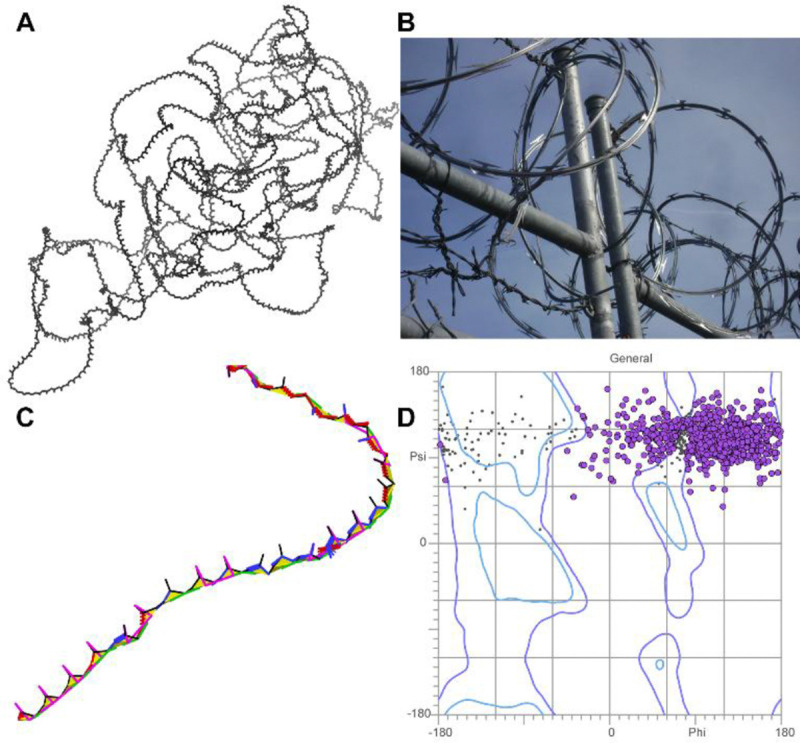
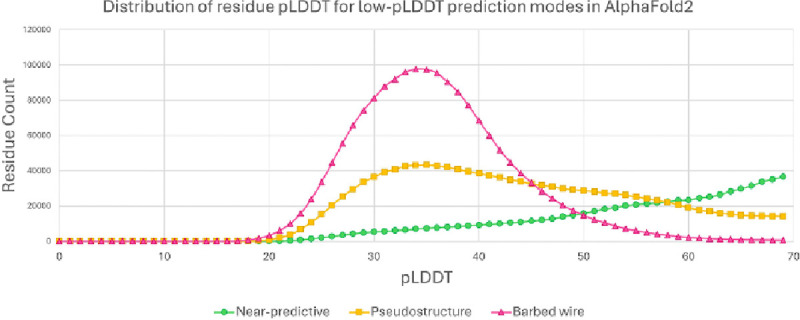
AlphaFold2 protein structure predictions are widely available for structural biology uses. These predictions, especially for eukaryotic proteins, frequently contain extensive regions predicted below the pLDDT 70 level, the rule-of-thumb cutoff for high confidence. This work identifies major modes of behavior within low-pLDDT regions through a survey of human proteome predictions provided by the AlphaFold Protein Structure Database. The near-predictive mode resembles folded protein and can be a nearly accurate prediction. Barbed wire is extremely unproteinlike, being recognized by wide looping coils, an absence of packing contacts, and numerous signature validation outliers, and it likely represents a nonpredicted region. Pseudostructure presents an intermediate behavior with a misleading appearance of isolated and badly formed secondary structure-like elements. These prediction modes are compared with annotations of disorder from MobiDB, showing general correlation between barbed wire/pseudostructure and many measures of disorder, an association between pseudostructure and signal peptides, and an association between near-predictive and regions of conditional folding. To enable users to identify these regions within a prediction, a new Phenix tool is developed encompassing the results of this work, including prediction annotation, visual markup, and residue selection based on these prediction modes. This tool will help users develop expertise in interpreting difficult AlphaFold predictions and identify the near-predictive regions that can aid in molecular replacement when a prediction does not contain enough high-pLDDT regions.

Keywords: AlphaFold; barbed wire; conditional folding; low pLDDT; near-predictive; signal peptides; structure prediction; structure validation.


Conflict of interest statement

Conflicts of interest The authors declare no conflicts of interest.

Figures

Figure 1
Figure 1
Prediction modes of AlphaFold2 and their relationships. This tree diagram shows how AlphaFold2 residues are divided into our modes, first by pLDDT, then by contact packing, then by validation outliers if necessary. Validation outliers are rare in high-pLDDT regions and are not used to define additional modes. For each mode, the name is listed, followed by the color used in our tool’s kinemage markup, followed by the frequency of that mode within the human proteome predictions. In the kinemage, markup for each mode can be toggled individually to aid readability. Example markup is shown in Figure 4.
Figure 2
Figure 2
Barbed wire residues in Alphafold2 predictions. A: Nearly all-barbed wire prediction of fragment 6 of UniProt Q86YZ3 (very long sequences are predicted as multiple overlapping fragments). Wide, looping, or tangled coils are typical of the barbed wire prediction mode. B: Real barbed wire, whose spikes and coils give the prediction mode its name. (Image credit: Smithers7 by way of Wikimedia Commons, Creative Commons Attribution 3.0 Unported) C: Zoomed-in view of the Q86YZ3 fragment 6 prediction, residues 962–1005, with MolProbity validation markup, showing extremely high density of validation outliers. Markup is green for Ramachandran outliers, red and blue for covalent geometry outliers, magenta for CaBLAM, lime green and yellow for cis and twisted peptide bonds. CA geometry outliers from CaBLAM are omitted for clarity but are pervasive. Carbonyl oxygen bonds are frequently pointed in the same direction, rather than alternating as in beta strands. D: Ramachandran distribution for general-case residues in the Q86YZ3 fragment 6 prediction. Outliers are marked in purple. The distribution is highly unusual and clustered in the upper right of the plot, corresponding to an extended but unproteinlike conformation.
Figure 3
Figure 3
Histogram distributions of backbone covalent bond angles from AlphaFold2 prediction residues with low pLDDT, low packing, and high outlier density (these residues are barbed wire-like, but without explicit selection for angle outliers). The x axis is σ from target angle value, with bins of 0.1σ. The y axis is count of residues falling in the bin. Target (0σ) is marked with light blue bar; outlier threshold (−4σ) is marked with red bar. Underflow bin is ≤−10σ; overflow bin is >+4σ (the other outlier threshold). All three N/CA/C bond angles show frequent geometric distortions, with the C-N-CA angle’s distortion being systematic, and its distribution recentered almost exactly on the −4σ outlier threshold (A). This angle partially spans the peptide bond, and its systematic distortion suggests errors in peptide bond assembly.
Figure 4
Figure 4
Near-predictive residues from AlphaFold2 predictions of eukaryotic translation initiation factor 3 and their experimentally-solved counterparts. A: Prediction of UniProt P60228 with standard pLDDT coloring, from the Mol* viewer at the AlphaFold Database. B: Prediction of UniProt P60228 with markup from our barbed_wire_analysis tool. The structure is primarily predictive (blue) and near-predictive (green), with the top left helix an example of unpacked high pLDDT (gray). C: Superposition of the prediction (black) with 6zon chain E (pink), solved by CryoEM at 3.0Å. D: Prediction of UniProt Q7L2H7 with standard pLDDT coloring. This prediction is lower confidence than A. E: Prediction of UniProt Q7L2H7 with markup from our barbed_wire_analysis tool. The structure is primarily near-predictive (green), with some unphysical (purple) regions. F: Superposition of the prediction (black) with 6zon chain M (pink). Even at low confidence, these predictions are close enough to the experimental structures to have structural meaning. The regions marked as unphysical – indicating severe validation outliers – correlate with loops omitted from the experimental structures.
Figure 5
Figure 5
Examples of low-pLDDT pseudostructure predictions from UniProt O15353, human Forkhead box protein N1. A: Overall prediction colored by pLDDT, from the Mol* viewer at the AlphaFold Database. A well-packed and well-predicted core is surrounded by barbed wire and pseudostructure. Several pseudostructure elements are sufficiently similar to secondary structure to be depicted as ribbons by Mol*. B: A pseudostructure helix, residues 544–554. Hydrogen bonding (light green pillows) is inconsistent or weak, and the helix is not well-formed. A gamma-turn-like segment, a rare pseudostructure feature, is visible before/below the helix. C: A pseudostructure beta strand, residues 161–169. This strand is unpaired, so has no hydrogen bonding. Barbed wire regions before and after the strand show the sharp difference in validation outlier density, even though all of this strand is predicted at very low confidence (mostly pLDDT < 40). D: A poly-proline II region, residues 464–470. This conformation is correctly associated with regions of high proline content in AlphaFold predictions, but often occurs with low pLDDT.
Figure 6
Figure 6
pLDDT distibutions for the major low-pLDDT prediction modes, pLDDT bins of 1, for sequences from the human proteome. Barbed wire (red, triangles) correlates with lower pLDDT scores. Near-predictive (green, circles) correlates with higher pLDDT scores. The crossing point for barbed wire and near-predicitve is close to 50, the yellow/orange boundary in conventional pLDDT coloring. If not for pseudostructure (gold, squares), which correlates only weakly with low pLDDT, a pLDDT 50 cutoff would be sufficient to select for most near-predictive.
Figure 7
Figure 7
Relationships of AlphaFold2 prediction modes with MobiDB disorder annotations. From left to right: prediction-disorder-iupl shows a typical distribution for many predictions of disorder (see Supplement), where high pLDDT residues are least associated with disorder and barbed wire residues are most associated, but no mode stands out as exceptional. The distributions to the right are exceptions to this general pattern. Low complexity sequences are about equally associated with both pseudostructure and barbed wire. Proline-rich sequences are preferentially associated with pseudostructure, where we observe the poly-proline II conformation. Disorder-to-disorder binding somewhat favors pseudostructure. Disorder-to-order binding somewhat favors near-predictive. Predicted signal peptides strongly favor pseudostructure over any other mode.
Figure 8
Figure 8
Multiple sequence alignment occupancy histogram distributions for AlphaFold2 human proteome predictions, as annotated in MobiDB. The three non-predictive modes (barbed wire, pseudostructure, and unphysical) show similar distributions to each other. Near-predictive has a distribution more similar to the high-pLDDT modes, supporting our association of near-predictive regions with predictive. Similarity between near-predictive and unpacked high-pLDDT suggests that near-predictive also contains conditionally binding regions.

References

    1. Abramson J., Adler J., Dunger J., Evans R., Green T., Pritzel A., Ronneberger O., Willmore L., Ballard A. J., Bambrick J., Bodenstein S. W., Evans D. A., Hung C. C., O’Neill M., Reiman D., Tunyasuvunakool K., Wu Z., Zemgulyte A., Arvaniti E., Beattie C., Bertolli O., Bridgland A., Cherepanov A., Congreve M., Cowen-Rivers A. I., Cowie A., Figurnov M., Fuchs F. B., Gladman H., Jain R., Khan Y. A., Low C. M. R., Perlin K., Potapenko A., Savy P., Singh S., Stecula A., Thillaisundaram A., Tong C., Yakneen S., Zhong E. D., Zielinski M., Zidek A., Bapst V., Kohli P., Jaderberg M., Hassabis D. & Jumper J. M. (2024). Nature 630, 493–500. - PMC - PubMed
    1. Adzhubei A. A., Sternberg M. J. & Makarov A. A. (2013). J Mol Biol 425, 2100–2132. - PubMed
    1. Alderson T. R., Pritisanac I., Kolaric D., Moses A. M. & Forman-Kay J. D. (2023). Proc Natl Acad Sci U S A 120, e2304302120. - PMC - PubMed
    1. Baek M., DiMaio F., Anishchenko I., Dauparas J., Ovchinnikov S., Lee G. R., Wang J., Cong Q., Kinch L. N., Schaeffer R. D., Millan C., Park H., Adams C., Glassman C. R., DeGiovanni A., Pereira J. H., Rodrigues A. V., van Dijk A. A., Ebrecht A. C., Opperman D. J., Sagmeister T., Buhlheller C., Pavkov-Keller T., Rathinaswamy M. K., Dalwadi U., Yip C. K., Burke J. E., Garcia K. C., Grishin N. V., Adams P. D., Read R. J. & Baker D. (2021). Science 373, 871–876. - PMC - PubMed
    1. Chen V. B., Davis I. W. & Richardson D. C. (2009). Protein Sci 18, 2403–2409. - PMC - PubMed

Publication types

LinkOut - more resources