[Preprint]. 2025 May 29:2025.05.29.656739.
doi: 10.1101/2025.05.29.656739.

eIF3d and eIF3e mediate selective translational control of hypoxia that can be inhibited by novel small molecules

Affiliations

eIF3d and eIF3e mediate selective translational control of hypoxia that can be inhibited by novel small molecules

Stephen C Purdy et al. bioRxiv. .

Abstract

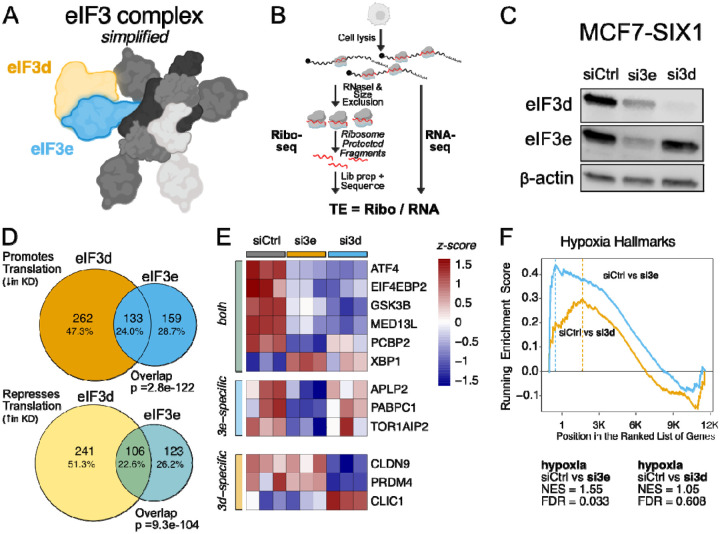
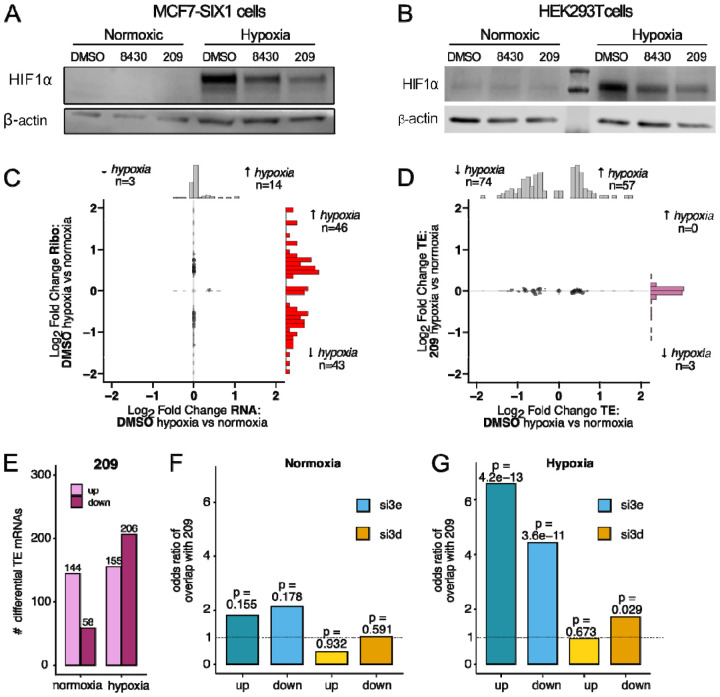
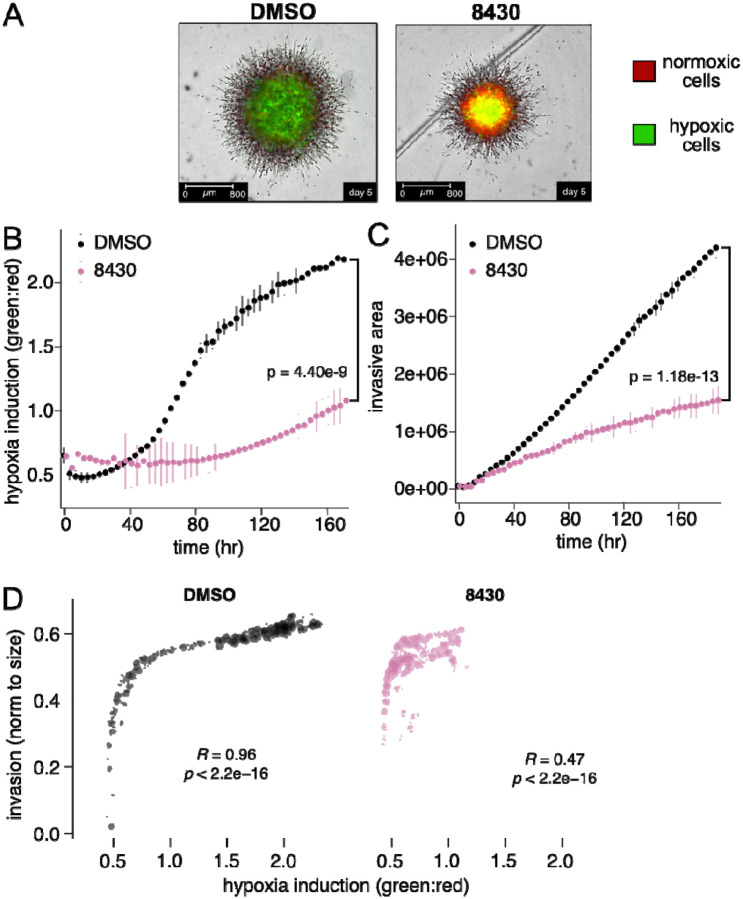
Exposure to hypoxia is linked to increased cellular plasticity and enhanced metastasis; effects which are primarily attributed to the transcriptional activation of large gene programs downstream of hypoxia inducible factors (HIFs). However, translational effects in hypoxia, that likely precede transcriptional effects, have remained largely unexplored. Using ribosome-profiling, we uncovered a selective translational response in acute hypoxia that is eIF3d/eIF3e-dependent and controls downstream hypoxic responses including HIF1a accumulation and cellular invasion. We further demonstrated that eIF3e copy number and an eIF3e-expression signature are associated with worsened outcomes for breast cancer patients. Finally, we identified a class of novel small molecules that target eIF3e specifically, reducing the translational response to hypoxia and to ER stress, another stressor that is dependent on eIF3d/eIF3e-mediated translation. Our data uncover critical functions for eIF3d/eIF3e in the hypoxic response and identify a potential means to inhibit stress-induced translation, and potentially plasticity and metastasis, mediated by eIF3e.


Conflict of interest statement

Disclosure and competing interests statement: A patent application has been filed (XW, WO, RZ, HLF) on “Small molecules targeting eIF3e to inhibit tumor growth progression, and metastasis”. Application #:18/839,131. All other authors declare they have no competing interests.

Figures

Figure 1:
Figure 1:. Overlapping and distinct functions of elF3d and eiF3e.
A. Diagram of a simplified elF3 complex with only elF3d and 3e labeled for clarity B. Outline of the experimental design of Ribo-seq and RNA-seq. C. siRNA knockdown of elF3d and elF3e in MCF7-SIX1 cells followed by western blot analysis. D. Venn diagram of the overlapping and distinct differentially translated mRNAs after elF3d and elF3e KD. P value calculated using Fisher’s Exact Test. E. Heatmap of specific mRNAs that are shared or specific to elF3d vs elF3e. Values are z-scores of TE. F. Gene set enrichment analysis for the hypoxia hallmark dataset when elF3e and elF3d are knockdown.
Figure 2:
Figure 2:. elF3e and elF3d are required for the acute translational hypoxic response. A-C.
Western blot analysis showing HIF1α after elF3d and elF3e knockdown in normoxic and hypoxic (4 hours at 1% O2) conditions. D. Schematic outlining the experimental design of Ribo-seq/RNA-seq in both normoxic and hypoxic conditions. E. Log, fold changes of RPFs (y-axis) and RNA levels (x-axis) comparing siCtrl cells in normoxia vs hypoxia. Only mRNAs with a statistically significant difference (adj p val < 0.05) are shown. F. Comparison of TE changes from normoxia to hypoxia in siCtrl cells (x-axis) vs si3e cells (y-axis) G. or si3d cells (y-axis). Only mRNAs with a statistically significant TE difference (adj p val < 0.05) are shown. H. Barplot of the number of differentially translated mRNAs after elF3e and elF3d KD in normoxia and hypoxia.
Figure 3:
Figure 3:. Loss of elF3d and elF3d decreases HIF1α-mediate effects and tumorsphere invasion.
A. Representative images of 231HFM cells grown in tumorspheres embedded in matrigel and collagen I +/− elF3d and elF3e KD. B. Fluorescence ratio of GFP:dsRed over time +/− elF3d and elF3e KD. C. Invasive area of the 231 tumorspheres over time +/− elF3d and elF3e KD. For B and C, statistical significance was calculated using a longitudinal mixed effects model in which si3e and si3d were both compared to sictrl. D. Scatterplot of the normalized Invasive area (x-axIs) and the GFP:dsRED ratio (y-axls) for sictrl (left), sl3d (middle), and si3e (right). Spearman correlation coefficient and p-value denoted for each.
Figure 4:
Figure 4:. elF3e-associated RNA signature predicts poor prognosis A&B.
Overall survival rates of METABRIC patients (n=1980) with breast tumor (A) elF3e gains/amplifications or (B) elF3d gains/amplifications compared to no copy number alterations (CNA) in the METABRIC dataset. C. Overall survival of patients in the METABRIC dataset stratified by our elF3e RNA-seq signature. For clarity only the first and fourth quartile are shown. D. Overall survival of patients from the METABRIC dataset stratified by a 42-gene hypoxic signature. E. Categorizing patients based on elF3e RNA-seq signature z-score and their hypoxia z-score. F. Overall survival rates of patients in the METABRIC dataset stratified by the combination of elF3e and hypoxia signature enrichment/depletion. The p-values and hazard ratios were calculated using a Cox proportional hazards regression where each group was compared to the control group (e.g. no CNA for elF3e, het CNA loss for elF3d, bottom 25% for signatures).
Figure 5:
Figure 5:. Compounds 8430 and 209 specifically stabilize elF3e protein in thermal shift assays.
A. Volcano plot of the Isothermal shift assay (ITSA) log2 fold change (x-axis) and −log 10 p value (y-axis) B. Cellular thermal shift assay (CETSA) followed by western blot showing protein levels of elF3e and multiple other efF3 subunits in addition to a loading control of GAPDH. C&D. Dose response of 8430 for an Isothermal dose-response fingerprint (ITDRF) assay. E&F. Dose response of 209 for an Isothermal dose-response fingerprint (ITDRF) assay.
Figure 6:
Figure 6:. Small molecule compounds, B430 and 209, inhibit the acute translational hypoxic response.
A&B. Western blot analysis showing HIF1a after 8430 and 209 treatment (24 hour pre-treatment) in normoxic and hypoxic {4 hours at 1%O2) conditions. C. Log2 fold change of RPFs (y-axis) and RNA levels (x-axis) comparing DMSO treatment in normoxia vs hypoxia. Each dot represents a mRNA transcript. D. Comparison of significant TE changes from normoxia to hypoxia in DMSO treated cells (x-axis) to TE changes from normoxia to hypoxia after treatment with a209 (y-axis). E. Barplot of the number of differentially translated mRNAs with 209 treatment in normoxia and hypoxia. Barplot of the odds ratio of the overlap of mRNA with TE changes from a209 treatment compared to those with TE changes from elF3e or elF3d KD In F. normoxia and G. hypoxia. P value calculated using Fisher’s Exact Test.
Figure 7:
Figure 7:. 8430 inhibits HIF1α-mediate effects and tumorsphere Invasion.
A. Representative images of 231HFM cells grown in tumorspheres embedded in matrigel and collagen I +/− 8430 treatment. B. Fluorescence ratio of GFP:dsRed over time +/− 8430 treatment. C. Invasive area of the 231 tumorspheres over time +/− 8430 treatment. For B and C, statistical significance was calculated using a longitudinal mixed effects model comparing 209 to DMSO. D. Scatter plot comparing the normalized invasive area (y-axis) and the GFP: dsRED ratio (x-axi6) in DMSO (left) and 8430 (right) treatment. Spearman correlation coefficient and p-value denoted for each.

References

    1. Gross S., et al. , Targeting cancer with kinase inhibitors. J Clin Invest, 2015. 125(5): p. 1780–9. - PMC - PubMed
    1. Society A.C., Cancer Facts and Figures 2024. 2024, Atlanta: American Cancer Society.
    1. Valastyan S. and Weinberg R.A., Tumor metastasis: molecular insights and evolving paradigms. Cell, 2011. 147(2): p. 275–92. - PMC - PubMed
    1. Rankin E.B. and Giaccia A.J., Hypoxic control of metastasis. Science, 2016. 352(6282): p. 175–80. - PMC - PubMed
    1. Fabbri L., et al. , The plasticity of mRNA translation during cancer progression and therapy resistance. Nat Rev Cancer, 2021. 21(9): p. 558–577. - PubMed

Publication types

LinkOut - more resources