[Preprint]. 2025 May 28:2025.05.23.652709.
doi: 10.1101/2025.05.23.652709.

High burden of premature ventricular contractions upregulates transcriptional markers of inflammation and promotes adverse cardiac remodeling linked to cardiomyopathy

Affiliations

High burden of premature ventricular contractions upregulates transcriptional markers of inflammation and promotes adverse cardiac remodeling linked to cardiomyopathy

J M L Medina-Contreras et al. bioRxiv. .

Abstract

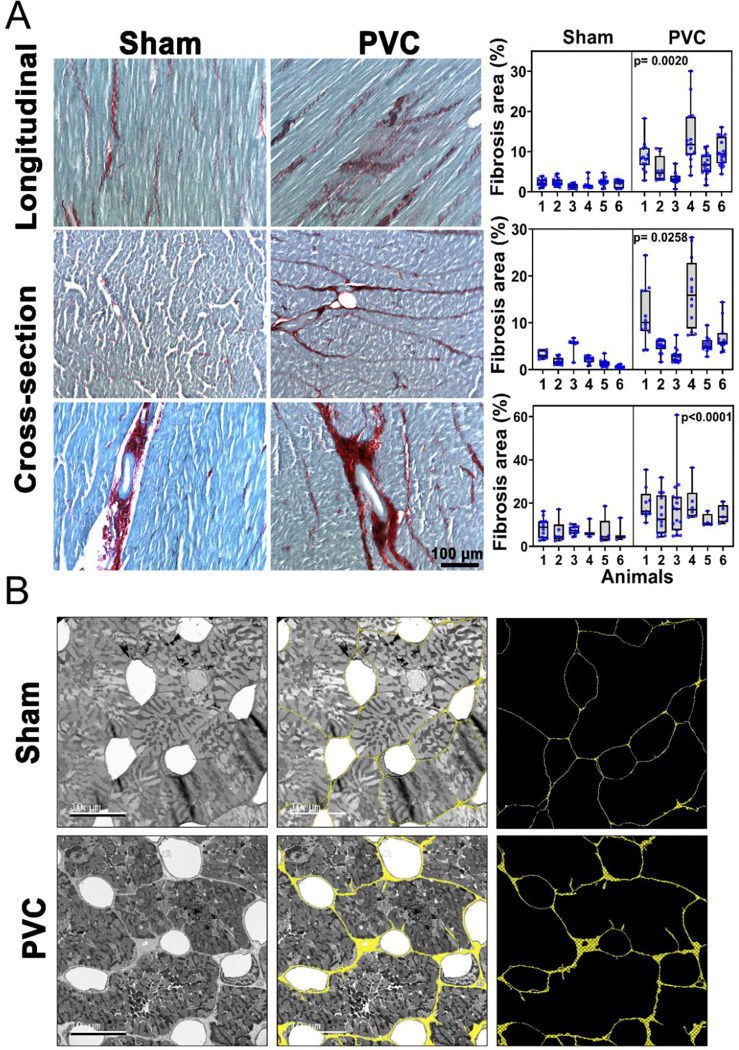
Premature ventricular contractions (PVCs) are the most prevalent ventricular arrhythmia in adults. High PVC burden can lead to left ventricular (LV) systolic dysfunction, eccentric hypertrophy, and an increased risk of heart failure (HF) and sudden cardiac death (SCD). Inadequate angiogenesis is a key determinant in the transition from adaptive to maladaptive cardiac hypertrophy and fibrosis is a risk factor for arrhythmia and SCD. To quantitatively assess structural remodeling and transcriptional alterations in PVC-induced cardiomyopathy (PVC-CM), animals were implanted with modified pacemakers to deliver bigeminal PVCs (200-220 ms coupling interval) for 12 weeks. Collagen deposition and interstitial ultrastructure of LV samples were analyzed using light and transmission electron microscopy, respectively. Pericytes, fibroblasts, myocytes, smooth muscle, and endothelial cells were imaged using confocal microscopy, quantified with an artificial intelligence-based segmentation analysis, and compared using hierarchical statistics. Transcriptional changes were assessed via RNAseq. Although cardiomyocytes hypertrophied in PVC-CM, capillary rarefaction was overcome by an increase in capillary-to-myocyte ratio. Additionally, thicker blood vessels were more abundant in PVC-CM. Fibroblast-to-myocyte ratio more than doubled, interstitial collagen fibers increased, and interstitial space thickened in PVC-CM. Transcripts involved in interstitial remodeling, inflammatory response, and alarmins were strongly elevated in PVC-CM. Overall, while the angiogenic response meets the metabolic demands of cardiac hypertrophy, upregulated markers of inflammation and cardiomyopathy linked to reactive fibrosis collectively represent an adverse LV remodeling that heightens the risk of HF and SCD in PVC-CM.

Keywords: Cardiac arrhythmia; angiogenesis; compensatory hypertrophy; diastolic dysfunction; fibroblasts.


Conflict of interest statement

The authors have no conflicts of interest to declare.

Figures

Figure 1.
Figure 1.. Fibrosis is elevated in PVC-CM.
(A) Representative images of left ventricular (LV) free wall samples stained with Sirius Red / Fast Green to detect fibrotic depositions. Images were obtained from longitudinal (upper panels) and cross-sections (middle and lower panels) from sham and PVC-CM animals. The red staining reveals interstitial fibrosis (upper and middle panels) and fibrosis in perivascular regions (lower panels). Percentual area covered by collagen deposits was quantified; data from each animal are represented using box and whisker plots and data from each image are represented by blue dots (right graphs and Table 1). Both groups are compared using hierarchical statistics (nested t-test) and p values are shown in each graph. (B) Ultrastructural analysis using transmission electron microscopy (TEM). Representative TEM micrographs of LV thin cross-sections from sham and PVC-CM groups (left panels). The AIVIA software was used to highlight the interstitial space shown in yellow (merged in the middle panels); for comparison purposes the interstitial space is shown alone (right panels).
Figure 2.
Figure 2.. Identification of cells and structures in cardiac tissue using different cellular type markers.
(A) Representative images showing formalin-fixed LV free wall tissue samples co-stained using anti-αSMA (red), anti-vimentin (VIM, white), isolectin B4 (IB4, green), and DAPI as counterstain (blue). In our experimental conditions, each marker recognized distinctive cell types and structures that were then quantified using the AIVIA software. In the longitudinal image (upper panels) αSMA+ cells show structure compatible with pericytes, IB4+ cells are structurally compatible with capillary endothelial cells, and VIM+ cells look like fibroblasts. Cross-section (lower panels) shows that anti-αSMA antibody stains the tunica media of blood vessels; IB4 stains capillaries and the tunica intima of blood vessels, and the anti-vimentin antibody stains the tunica intima of blood vessels and fibroblasts. (B) Representative images showing formalin-fixed LV free wall tissue samples of the two experimental groups co-stained with anti-αSMA, isolectin B4 (IB4), anti-vimentin (VIM) and DAPI as counterstain.
Figure 3.
Figure 3.. Low level of colocalization between αSMA and vimentin imply low presence of myofibroblasts.
Fibroblasts, identified by vimentin-positive staining, gain αSMA expression during their differentiation to myofibroblasts. Representative images showing cross-sections of LV free wall tissue samples co-stained using anti-αSMA (red) and anti-vimentin (green). Overlaid pixels are represented in white. Co-localization parameters were further calculated using Colocalization Finder plug-in of the Image J software. As blood vessels react to both stains, colocalization parameters with and without including structures compatible with blood vessels were computed (see Table 2).
Figure 4.
Figure 4.. Protein expression and morphometric analysis of αSMA revealed pericytes and blood vessels in LV cardiac tissue.
(A) Western blot analysis shows increase in αSMA expression in PVC-CM vs. sham (p<0.0001 t-test, n=6 animal per group). (B) Representative LV cross-sections co-stained with anti-αSMA antibody (green) and WGA-AF633 (red) (left panels). Artificial intelligence-based (AIVIA) recognition and segmentation of αSMA+ cells (pericytes) and blood vessels, and WGA-stained cardiomyocytes overlayed with the original image (middle panels). AIVIA generated regions of interest (ROIs) corresponding to pericytes, blood vessels, and cardiomyocytes (right panels). (C) Representative formalin-fixed LV cross-sections co-stained using anti-αSMA (green), WGA-AF633 (red), and DAPI (blue) in sham and PVC-CM LV free wall samples. The identified ROIs were used to calculate the number of pericytes, number and area of blood vessels, and number of myocyte (WGA) on each image. AIVIA results are plotted and analyzed using hierarchical statistics (nested-t test). The density (number of pericytes per mm2) and number of pericytes per cardiomyocyte were quantified for several images per animal. In total 13,529 vs. 17,641 pericytes were analyzed for sham vs. PVC, respectively. The unitary area of blood vessels (μm2), density (number of blood vessels per mm2) and the percentage of area covered by blood vessels were also quantified using the artificial intelligence-based software. The total number of blood vessels analyzed was 36 vs. 54 in the sham vs. PVC-CM group, respectively. Several micrographs were quantified per animal (see Table 1). Each point in the graphs represents the mean value per micrograph, and the data are displayed as a box and whisker plot.
Figure 5.
Figure 5.. Frequent PVCs increase fibroblast content.
(A) Western blot study was used to measure vimentin expression in the LV tissue in PVC-CM with respect to sham (p=0.085 t-test, n= 6 animals per condition) and IL-1β (p=0.007 t-test, n= 6 animals per condition). (B) Original representative LV cross-sections co-stained with anti-vimentin antibody (green) and WGA-AF633 (red) (left panels). AI-powered image segmentation merged with the representative image (middle panels). The segmentation result showed fibroblasts and cardiomyocytes, while blood vessel structures were rejected (right panels). (C) Representative LV cross-sections co-stained using anti-vimentin (green), WGA-AF633 (red), and DAPI (blue) in sham and PVC-CM samples. The ROIs identified were used to calculate the number of fibroblasts and the number of myocytes on each image. Results from the AIVIA software were plotted and analyzed using hierarchical statistics (nested t-test). Density (number of fibroblasts per mm2) and number of fibroblasts per cardiomyocyte were quantified for several images. The number of fibroblasts analyzed was 7,305 and 7,407 for sham and PVC-CM group, respectively. Each point in the graphs represents the mean value per micrograph, and the data is displayed as a box and whisker plot.
Figure 6.
Figure 6.. Frequent PVCs promote an angiogenic response.
(A) Western blot analysis indicates increase expression of eNOS (p<0.036 t-test, n= 6 animals per condition) and VEGF-B (p<0.003 t-test, n= 6 animals per condition). (B) Original representative LV cross-sections co-stained with IB4-AF488 (green) and WGA-AF633 (red; left panels). AI-based detection of capillaries and cardiomyocytes using the AI-powered AIVIA classifier merged with the original images (middle panels). Capillaries and cardiomyocytes were recognized by the AI segmentation, while blood vessel structures were rejected (right panels). (C) Representative LV cross-sections co-stained with IB4 (green), WGA-AF633 (red), and DAPI (blue) in sham and PVC-CM. The recognized ROIs were used to calculate the number of capillaries, area of capillaries, and number of myocytes on each image. Results from AIVIA software were plotted and analyzed using hierarchical statistics (nested t-test) (Table 1). The unitary capillary area (μm2), density (number of capillaries per mm2), number of capillaries per cardiomyocyte, and the percentual area covered by capillaries were quantified for several images per animal. The number of capillaries analyzed was 18,318 vs. 24,012 in the sham vs. PVC-CM group, respectively. Several micrographs were analyzed per animal (data shown in Table 1) and the comparison between groups was performed using hierarchical statistical analysis (nested t-test). Each point in the graphs represents the mean value per micrograph, and the data are displayed as a box and whisker plot.
Figure 7.
Figure 7.. TEM and confocal microscopy reveal PVC-CM- induced alterations in capillary and pericyte organization.
(A) Representative TEM micrograph of a PVC-CM sample showing contiguous capillaries with different caliber (arrangement rarely seen in the sham condition; see Fig. 1B for comparison). The blue arrows indicate the presence of pericytes. (B) Representative LV cross-section of a PVC-CM sample co-stained with IB4 (green; endothelial cells in capillaries and intima layer blood vessels), anti-αSMA (red; pericytes and tunica media of blood vessels), anti-vimentin (white, fibroblasts), and DAPI (blue, nuclei); image taken from Fig. 2B (merge). The enlarged quadrants show adjacent capillaries with some of them inter-connected by pericytes similar to these in the TEM image.
Figure 8.
Figure 8.. PVC-CM results in a distinct transcription profile.
RNAseq was used to identify differentially transcribed genes. (A) Heatmap displaying the top 50 upregulated genes. (B) Gene set enrichment analysis of the top 50 upregulated genes. (C) Enrichment for transcriptional regulatory networks identified from the transcriptional signature. (D) Violin plots showing transcripts of interest differentially expressed between groups. Non-parametric Mann Whitney test with two-tailed was used for comparison between groups; p-values are shown in asterisks * <0.05, **<0.01, *** <0.001.

References

    1. Kennedy HL, Whitlock JA, Sprague MK, Kennedy LJ, Buckingham TA and Goldberg RJ. Long-term follow-up of asymptomatic healthy subjects with frequent and complex ventricular ectopy. N Engl J Med. 1985;312:193–7. - PubMed
    1. Huizar JF, Tan AY, Kaszala K and Ellenbogen KA. Clinical and translational insights on premature ventricular contractions and PVC-induced cardiomyopathy. Prog Cardiovasc Dis. 2021;66:17–27. - PMC - PubMed
    1. Baman TS, Lange DC, Ilg KJ, Gupta SK, Liu TY, Alguire C, Armstrong W, Good E, Chugh A, Jongnarangsin K, Pelosi F Jr., Crawford T, Ebinger M, Oral H, Morady F and Bogun F. Relationship between burden of premature ventricular complexes and left ventricular function. Heart Rhythm. 2010;7:865–9. - PubMed
    1. Huizar JF and Ellenbogen KA. Is PVC-Induced Cardiomyopathy Truly Reversible?: A Deep Dive Into Questions That Remain Unanswered. JACC Clin Electrophysiol. 2020;6:1377–1380. - PMC - PubMed
    1. Shoureshi P, Tan AY, Koneru J, Ellenbogen KA, Kaszala K and Huizar JF. Arrhythmia-Induced Cardiomyopathy: JACC State-of-the-Art Review. J Am Coll Cardiol. 2024;83:2214–2232. - PubMed

Publication types