[Preprint]. 2025 May 28:2025.05.28.654549.
doi: 10.1101/2025.05.28.654549.

Rapid adaptation and extinction across climates in synchronized outdoor evolution experiments of Arabidopsis thaliana

Xing Wu  1   2   3 Tatiana Bellagio  1   2   3   4 Yunru Peng  3 Lucas Czech  3 Meixi Lin  1   2   3 Patricia Lang  4 Ruth Epstein  1   2 Mohamed Abdelaziz  1   2   3   4   5   6   7 Jake Alexander  1   2   3   4   5   6   7 Mireille Caton-Darby  1   2   3   4   5   6   7 Carlos Alonso-Blanco  1   2   3   4   5   6   7 Heidi Lie Andersen  1   2   3   4   5   6   7 Modesto Berbel  1   2   3   4   5   6   7 Joy Bergelson  1   2   3   4   5   6   7 Liana Burghardt  1   2   3   4   5   6   7 Carolin Delker  1   2   3   4   5   6   7 Panayiotis G Dimitrakopoulos  1   2   3   4   5   6   7 Kathleen Donohue  1   2   3   4   5   6   7 Walter Durka  1   2   3   4   5   6   7 Gema Escribano-Avila  1   2   3   4   5   6   7 Steven J Franks  1   2   3   4   5   6   7 Felix B Fritschi  1   2   3   4   5   6   7 Alexandros Galanidis  1   2   3   4   5   6   7 Alfredo Garcia-Fernández  1   2   3   4   5   6   7 Ana García-Muñoz  1   2   3   4   5   6   7 Elena Hamann  1   2   3   4   5   6   7 Martijn Herber  1   2   3   4   5   6   7 Allison Hutt  1   2   3   4   5   6   7 José M Iriondo  1   2   3   4   5   6   7 Thomas E Juenger  1   2   3   4   5   6   7 Stephen Keller  1   2   3   4   5   6   7 Karin Koehl  1   2   3   4   5   6   7 Arthur Korte  1   2   3   4   5   6   7 Pamela Korte  1   2   3   4   5   6   7 Alexander Kuschera  1   2   3   4   5   6   7 Carlos Lara-Romero  1   2   3   4   5   6   7 Laura Leventhal  1   2   3   4   5   6   7 Daniel Maag  1   2   3   4   5   6   7 Arnald Marcer  1   2   3   4   5   6   7 Martí March-Salas  1   2   3   4   5   6   7 Juliette de Meaux  1   2   3   4   5   6   7 Belén Méndez-Vigo  1   2   3   4   5   6   7 Javier Morente-López  1   2   3   4   5   6   7 Timothy C Morton  1   2   3   4   5   6   7 Zuzana Münzbergova  1   2   3   4   5   6   7 Anne Muola  1   2   3   4   5   6   7 Meelis Pärtel  1   2   3   4   5   6   7 F Xavier Picó  1   2   3   4   5   6   7 Brandie Quarles-Chidyagwai  1   2   3   4   5   6   7 Marcel Quint  1   2   3   4   5   6   7 Niklas Reichelt  1   2   3   4   5   6   7 Agnieszka Rudak  1   2   3   4   5   6   7 Johanna Schmitt  1   2   3   4   5   6   7 Merav Seifan  1   2   3   4   5   6   7 Basten L Snoek  1   2   3   4   5   6   7 Remco Stam  1   2   3   4   5   6   7 John R Stinchcombe  1   2   3   4   5   6   7 Marc Stift  1   2   3   4   5   6   7 Mark A Taylor  1   2   3   4   5   6   7 Peter Tiffin  1   2   3   4   5   6   7 Irène Till-Bottraud  1   2   3   4   5   6   7 Anna Traveset  1   2   3   4   5   6   7 Jean-Gabriel Valay  1   2   3   4   5   6   7 Martijn van Zanten  1   2   3   4   5   6   7 Vigdis Vandvik  1   2   3   4   5   6   7 Cyrille Violle  1   2   3   4   5   6   7 Maciej Wódkiewicz  1   2   3   4   5   6   7 Detlef Weigel  1   2   3   4   5   6   7 Oliver Bossdorf  1   2   3   4   5   6   7 Robert Colautti  1   2   3   4   5   6   7 François Vasseur  5 J F Scheepens  6 Moises Exposito-Alonso  1   2   3   4   7
Affiliations

Rapid adaptation and extinction across climates in synchronized outdoor evolution experiments of Arabidopsis thaliana

Xing Wu et al. bioRxiv. .

Abstract

Climate change is threatening species with extinction, and rapid evolutionary adaptation may be their only option for population rescue over short ecological timescales. However, direct observations of rapid genetic adaptation and population dynamics across climates are rare across species. To fill this gap, we conducted a replicated, globally synchronized evolution experiment with the plant Arabidopsis thaliana for 5 years in over 30 outdoor experimental gardens with distinct climates across Europe, the Levant, and North America. We performed whole-genome sequencing on ~70,000 surviving reproductive individuals and directly observed rapid and repeatable adaptation across climates. Allele frequency changes over time were parallel in experimental evolution replicates within the same climates, while they diverged across contrasting climates-with some allele frequency shifts best explained by strong selection between -46% to +60%. Screening the genome for signals of rapid climate adaptation identified a polygenic architecture with both known and novel adaptive genetic variants connected to important ecological phenotypes including environmental stress responses, CAM5 and HEAT SHOCK FACTORs, and germination and spring flowering timing, CYTOCHROME P450s and TSF. We found evolutionary adaptation trends were often predictable, but variable across environments. In warm climates, high evolutionary predictability was associated with population survival up to 5 years, while erratic trends were an early warning for population extinction. Together, these results show rapid climate adaptation may be possible, but understanding its limits across species will be key for biodiversity forecasting.


Conflict of interest statement

Disclosure statement D.W. holds equity in Computomics, which advises plant breeders. D.W. also consults for KWS SE, a globally active plant breeder and seed producer. All other authors declare no competing financial interests. The funders had no role in study design, data collection and analysis, decision to publish, or preparation of the manuscript.

Figures

Fig. 1.
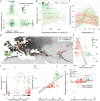
Fig. 1.. GrENE-net’s globally-distributed evolution experiment of A. thaliana.
(A) GrENE-net experimental design with 231 A. thaliana accessions mixed in tubes of ~5,000 seeds. Each experimental tray was sown with three tubes and seeds were spread every two weeks throughout fall 2017 to ensure establishment. Each site started 12 trays as independent experimental replicates. The map shows 43 gardens (sites) where participants started the experiment; colors indicate experiment outcomes, with 30 sites successfully completing at least one generation and producing genomic data. (B) Calendar of time-series collections of flower tissues used for genomic sequencing for the first three years. (C) Density of samples collected along the calendar year, combining data from all three years. (D) Daily temperatures curves and precipitation bars over the first three years of the experiment in two example locations: humid continental (Würzburg, Germany, site #46, green) and arid desert (Sde Boker in Negev desert, Israel, site #26, brown). (E) Example photographs of the experimental populations in Germany and Israel during spring of the first growing season.
Fig. 2.
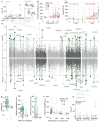
Fig. 2.. Genomic evolution in GrENE-net is rapid and parallel
(A) Principal Component Analysis (PCA) of allele frequencies and samples over three generations with up to 12 replicates per location (n=738). The genome-sequenced founder population, common to all experiments, was projected into the PCA space (black). Insets show the distribution of genome-wide allele frequency changes between generations. (B) Example of three sites with low, intermediate, and high evolutionary repeatability displayed at the allele and accession level. At the allele level, the 100 fastest increasing or decreasing allele frequencies over time are plotted for illustration. At the accession level, all 231 accessions are displayed using a Muller plot with accessions sorted based on the temperature of origin from colder (green-yellow) to warmer (purple-blue). (C-D) Evolutionary repeatability measured at the allele or accession level as an average correlation of change in frequency from the founder frequency to first generation is displayed against the (C) garden annual temperature or (D) as a vertical rank. (E) Manhattan plots of Genome-Wide Likelihood Ratio Tests (LRTs) of alleles changing in frequency across 12 replicates within a site in the first generation (red indicates alleles with significant natural selection under Bonferroni correction). (F) Population trajectories of each location estimated across all years and replicates displaying the fitting of a polynomial regression (for expanded visualization Fig. S8).
Fig. 3.
Fig. 3.. Rapid evolution follows local adaptation.
(A) Accession relative frequency change (p1p0) over climatic distance across all three years (n = 75,075 garden-accession origin transplant combinations) showing that planted accessions at sites with annual temperature and precipitation most similar to their home environment typically increase in frequency more than those transplanted to climatically distant environments. (B) Transformation of data in (A) to display log (p1/p0) and squared temperature distances to fit a model of stabilizing local adaptation. Grey line regression represents the average fitness decline of the GrENE-net accessions with climate distance transplant (i.e. the stabilizing selection parameter Vs211) while accessions i and j are examples of accession-specific Vs1 slopes. (C) Idealized stabilizing selection curves for all 231 accessions based on fitting (B) equation of Vs and Wmax. (D) Per-accession local adaptation parameter Vs1 visualized in a map of the accessions’ geographic collection of origin colored by habitat suitability and (E) across a latitudinal gradient of accession’s location origin. (F) Relationship between the strength of the per-accession local adaptation parameter and habitat suitability of the accessions’ locations of origin and (G) the accessions’ temperatures of origin. (H) Annual temperature averages at accessions’ origins against temperatures of gardens weighted by the accessions’ frequency, as a proxy of temperature optimum. The gray lines represent regression lines, and the shaded areas indicate their confidence intervals.
Fig. 4.
Fig. 4.. Rapid adaptation signals along the A. thaliana genome
Experimental-evolution Genome-Environment Associations (eGEA) of rapid allele frequency trajectories with temperature (A-D) and precipitation in summer (D-G) using three statistical approaches: Latent Factor Mixed Model (LFMM), quasi-binomial Generalized Linear Mixed model (GLM), and Kendall correlation. (A) Zoom into the temperature Manhattan plot with CAM5 SNP associations, reporting P-values obtained from the three models before inflation correction with WZA. The protein structures (AlphaFold computed) of two alternative splicing isoforms of the CAM5 gene are depicted: isoform 1 (AT2G27030.1) and isoform 3 (AT2G27030.3). Grey boxes along the genome (x-axis) indicate two gene models of the TAIR reference genome which are present in published transcriptome data (54). (B) Example of divergent allele frequency trajectories of the CAM5 top allele (chr4:11533937) across experimental locations along a temperature gradient. (C) Frequency trajectories of top CAM5 allele over years separating experimental gardens in high (>10°C) and low (<10°C) mean annual temperature. (D) Manhattan plot of eGEA association of mean annual temperature (up) and summer precipitation (down) combining results from the three applied statistical approaches with haplotype block P-value pooling with WZA. Five A. thaliana chromosomes indicated in grey and black. (E) Relation of the top CYP707A1 SNP allele identified in precipitation eGEA and boxplots of allele distribution relative to accession origin latitude (left) and precipitation (mid), and the expected effect of reduced germination (right). (F) Relation between changes in CYP707A1 alleles and precipitation in summer. (G) CYP707A1 gene model and zoom into top SNP associations, reporting P-values obtained from the three models before inflation correction with WZA, the grey boxes along the genome (x-axis) indicate the gene model of the TAIR reference genome.
Fig. 5.
Fig. 5.. Predictability of genome-wide evolution and population survival across environments
(A) Allele frequency changes with temperature (logistic parameter β = Δp/(1-p)/°C) and its relation to allele’s temperature origin based on the average annual temperature of the A. thaliana accessions carrying such alleles. Logistic regression β was calculated per allele and averaged within each LD block (n = 16,656). Top gene associations (Fig. 4) are highlighted in green. (B) Example of allele frequency trajectory over time fitting a logistic regression (Δp/(1-p)/year), comparing several warm (>10 °C, red) and cold (<10°C, blue) experimental gardens (Fig. S69). (C) Leave-one-out (LOO) predictability of year 1 evolutionary trends (log(p1/p0)) per replicate (n = 325) based on new genomic offset and stabilizing selection across gardens of different temperatures (see other metrics Fig. S69). Grey line indicates the fitted second term polynomial between predictability and temperature. Dotted lines indicate isolines of population survival from fitted logistic regressions in (E). Species niche center represents the average temperature of origin across all founder accessions (9.6°C). (D) Relationships between LOO predictability (year 1) and population size over time (summed total number of individuals sampled year 1–3). (E) Logistic regressions of LOO predictability of evolutionary trends of population replicates and survival in the 1st, 3rd, and 5th years.

References

    1. Franks S. J., Sim S., Weis A. E., Rapid evolution of flowering time by an annual plant in response to a climate fluctuation. Proc. Natl. Acad. Sci. U. S. A. 104, 1278–1282 (2007). - PMC - PubMed
    1. Landis J. B., Guercio A. M., Brown K. E., Fiscus C. J., Morrell P. L., Koenig D., Natural selection drives emergent genetic homogeneity in a century-scale experiment with barley. Science 385, 2023.09.22.557807 (2024). - PubMed
    1. Enbody E. D., Sendell-Price A. T., Sprehn C. G., Rubin C.-J., Visscher P. M., Grant B. R., Grant P. R., Andersson L., Community-wide genome sequencing reveals 30 years of Darwin’s finch evolution. Science 381, eadf6218 (2023). - PubMed
    1. Bergland A. O., Behrman E. L., O’Brien K. R., Schmidt P. S., Petrov D. A., Genomic evidence of rapid and stable adaptive oscillations over seasonal time scales in Drosophila. PLoS Genet. 10, e1004775 (2014). - PMC - PubMed
    1. Nosil P., de Carvalho C. F., Villoutreix R., Zamorano L. S., Sinclair-Waters M., Planidin N. P., Parchman T. L., Feder J., Gompert Z., Evolution repeats itself in replicate long-term studies in the wild. Sci Adv 10, eadl3149 (2024). - PMC - PubMed

Publication types

LinkOut - more resources