[Preprint]. 2025 May 30:2025.05.28.656717.
doi: 10.1101/2025.05.28.656717.

Instant fluorescence lifetime imaging microscopy reveals mechano-metabolic reprogramming of stromal cells in breast cancer peritumoral microenvironments

Affiliations

Instant fluorescence lifetime imaging microscopy reveals mechano-metabolic reprogramming of stromal cells in breast cancer peritumoral microenvironments

Julian Najera et al. bioRxiv. .

Abstract

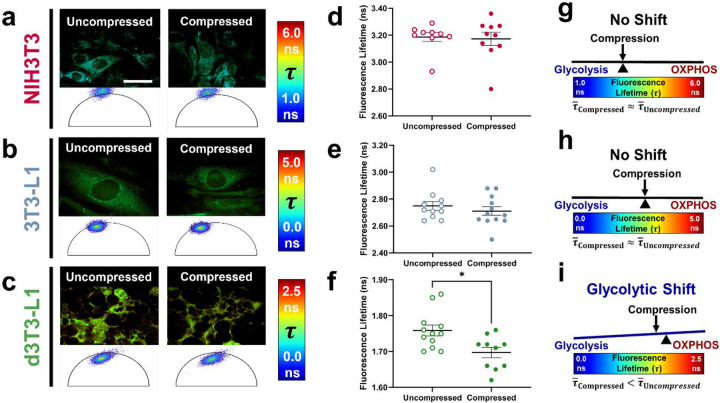
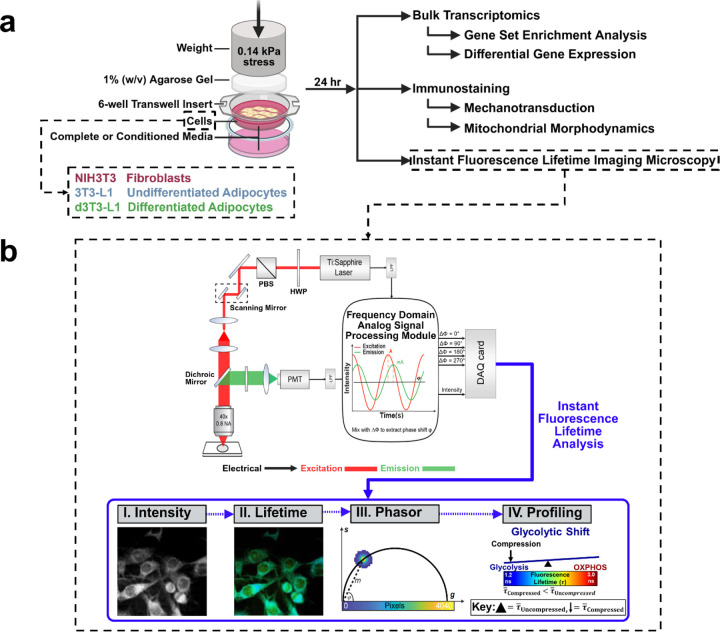
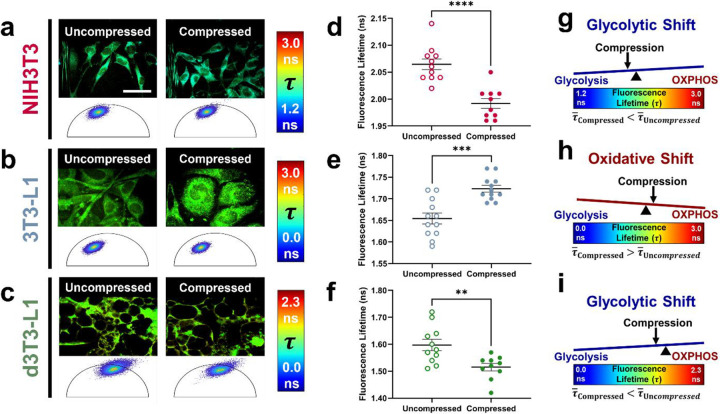
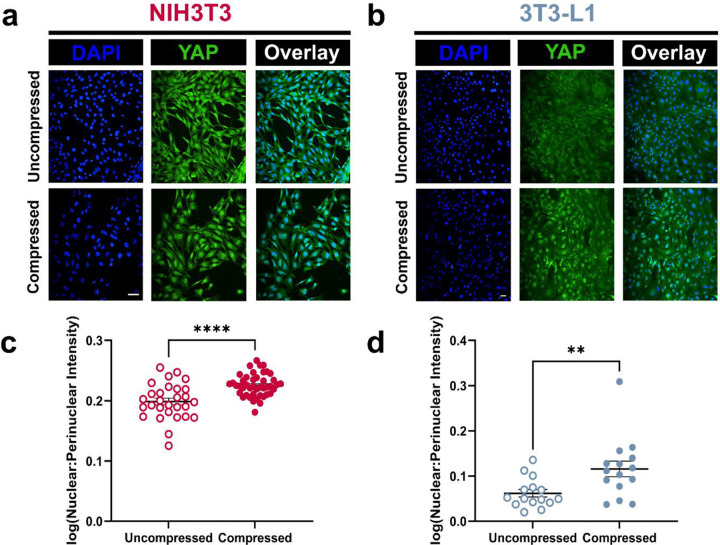
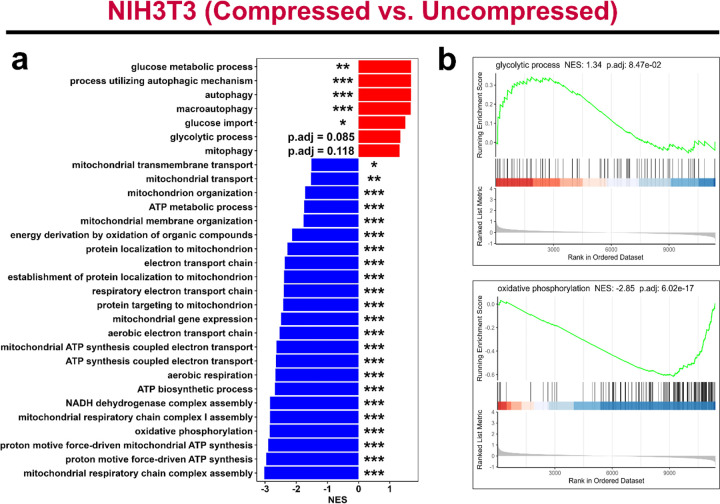
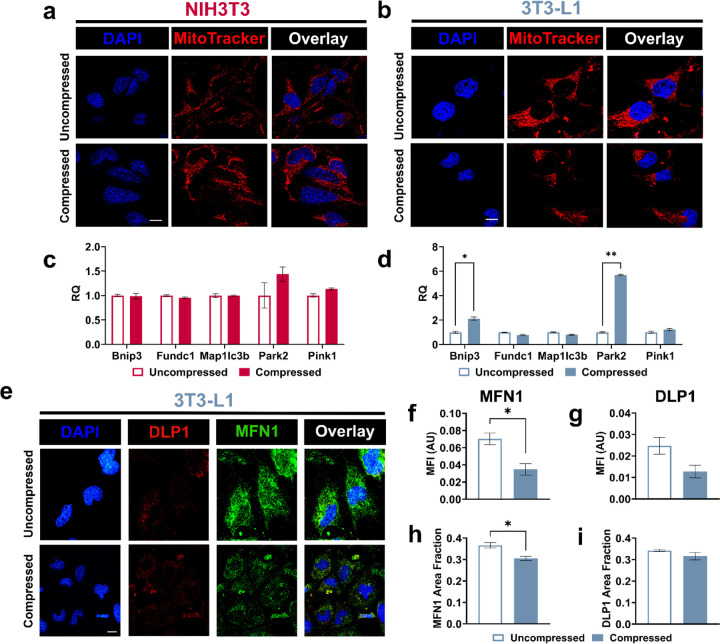
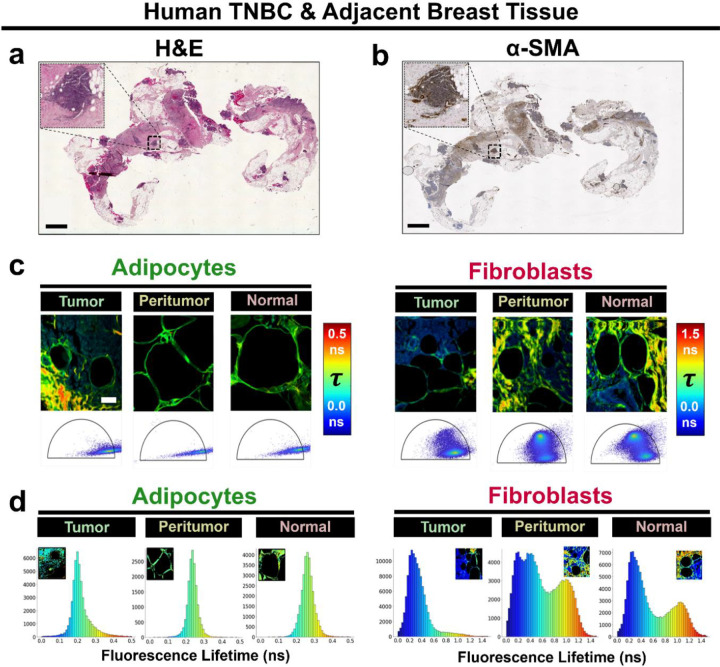
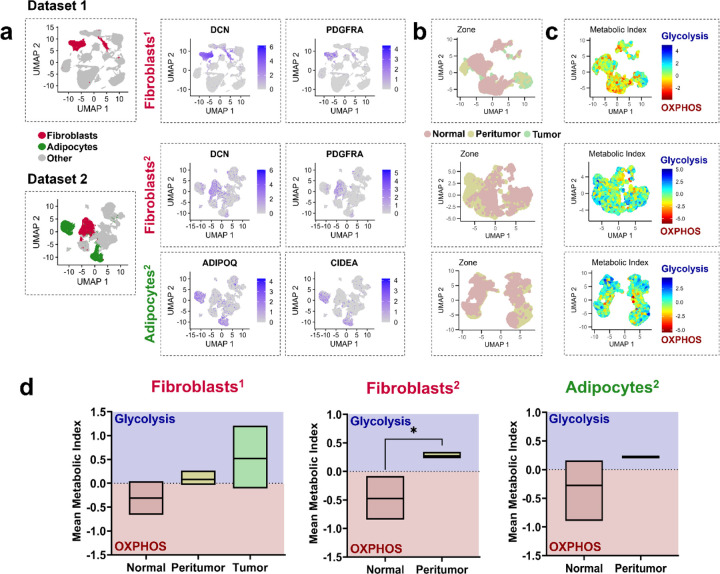
The breast peritumor microenvironment (pTME) is increasingly recognized as a mediator of breast cancer progression and treatment resistance. However, if and how growth-induced tumor compressive forces (i.e., solid stresses) influence the breast pTME remains unclear. Here we show using instant fluorescence lifetime imaging microscopy (FLIM)-a frequency-domain FLIM system capable of simultaneous image acquisition and instantaneous data processing-that breast tumor-mimicking in vitro compression promotes metabolic changes in stromal cells found in the breast pTME. Namely, compression shifts NIH3T3 fibroblasts and differentiated 3T3-L1 (d3T3-L1) adipocytes toward a more glycolytic state, while it promotes increased oxidative phosphorylation in 3T3-L1 undifferentiated adipocytes. The gold-standard Seahorse extracellular flux assay fails to capture these changes, underscoring the superior sensitivity of instant FLIM in detecting metabolic shifts. We validate these phenotypic findings at the transcriptomic level via RNA sequencing, confirming that compressed fibroblasts downregulate oxidative phosphorylation and upregulate glycolysis compared to uncompressed controls. We further demonstrate that compression induces mitochondrial dysregulation in undifferentiated adipocytes, driven in part by upregulated mitophagy and disrupted fusion dynamics. Finally, we confirm that these stromal cell types recapitulate these distinct metabolic states in human breast cancer patient samples, consistent with our in vitro findings. By elucidating mechano-metabolic interactions occurring at the tumor-host interface, these results will inform the development of innovative mechano-metabolic reprogramming treatment strategies to improve breast cancer patient survival.

Keywords: glycolysis; host tissue; mitochondria; oxidative phosphorylation; solid stress.


Conflict of interest statement

Competing Interests The authors declare no competing interests.

Figures

Extended Data Figure 1.
Extended Data Figure 1.. Biochemical effects from breast cancer conditioned media (CM) overcomes compression-induced metabolic reprogramming in fibroblasts and undifferentiated adipocytes, but not differentiated adipocytes.
Representative fluorescence lifetime images (top) and phasor plots (bottom) of a) NIH3T3 fibroblasts (n = 9 uncompressed, 10 compressed), b) 3T3-L1 undifferentiated adipocytes (n = 11 uncompressed, 12 compressed), and c) d3T3-L1 adipocytes (n = 12 uncompressed, 10 compressed) cultured in murine 4T1 triple-negative breast cancer cell CM. Fluorescence lifetime analysis shows that the mean lifetime (τ¯) does not change in d) NIH3T3 fibroblasts and e) 3T3-L1 undifferentiated adipocytes following compression in 100% 4T1 CM. This indicates there is no shift in metabolic state in both cell types as shown in g) and h). Conversely, fluorescence lifetime is significantly lower in f) compressed d3T3-L1 adipocytes suggesting a i) glycolytic shift as in Fig. 2f,i. Thus d3T3-L1 cells may be more metabolically sensitive to mechanical (rather than biochemical) signals. These results raise the possibility that, in some peritumoral stromal cell types, the metabolic response to growth-induced tumor compressive forces may not only be influenced by cell identity, but also spatial proximity to tumor where biochemical cues are more likely to dominate closer to the tumor. Error bars represent SEM and asterisks indicate statistical significance (*p < 0.05, **p < 0.01, ***p < 0.001, ****p < 0.0001) determined using a Student’s t-test. Scale bar is 50 μm.
Figure 1.
Figure 1.. Schematic of experimental approach and instant FD-FLIM system.
Stromal cells found in the breast peritumor experience breast tumor-mimicking compression (~0.14 kPa) for 24 hours using an a) in vitro compression apparatus. The resulting response is assessed using omics, immunofluorescence, and b) instant fluorescence lifetime imaging microscopy (FLIM). In instant FLIM, a femtosecond Ti:Sapphire laser generates an excitation light (red). The excited fluorescence signal (green) enters a photomultiplier tube (PMT), is converted into an electrical signal, then enters an analog signal processing module. Through homodyne detection, the signal is mixed with multiple phase-shifted components from the excitation signal to simultaneously generate intensity and four phase-shifted mixed signals. This data is digitized by a data acquisition (DAQ) card (b-I, blue), then processed and displayed as a lifetime image and phasor plot (b-II and b-III). Phasor plots, defined by g and s components, visualize fluorescence lifetimes (τ), wherein points closer to the g-axis correspond to shorter lifetimes. The distance from the origin (m) reflects the modulation depth, while the angle (φ) represents lifetime dynamics (b-III). The color bar represents lifetime values coded from lowest (blue) to highest (red). Metabolic changes are assessed by comparing the overall mean lifetime (τ¯) of compressed cells (downward arrow) to uncompressed ones (fulcrum; b-IV). Relative to the fulcrum, lower τ¯ indicates a glycolytic shift (shown here) while higher τ¯ reflects an oxidative shift. HWP: half-wave plate, PBS: polarizing beam splitter, LPF: low-pass filter, A: ampere, mA: milliampere. Image in a) created with Biorender.com., https://biorender.com/.
Figure 2.
Figure 2.. Breast tumor-mimicking compression promotes differential metabolic shifts in peritumoral stromal cell types.
Representative fluorescence lifetime images (top) and phasor plots (bottom) of a) NIH3T3 fibroblasts (n = 11 uncompressed, 10 compressed), b) 3T3-L1 undifferentiated adipocytes (n = 12 uncompressed and compressed), and c) differentiated 3T3-L1 (d3T3-L1) adipocytes (n = 11 uncompressed, 10 compressed). Fluorescence lifetime analysis reveals that the applied mechanical stress decreases mean fluorescence lifetime (τ¯) in d) fibroblasts and f) differentiated adipocytes, but produces the opposite effect in e) undifferentiated adipocytes. The decrease in lifetime indicates that compression metabolically rewires g) NIH3T3 and i) d3T3-L1 cells to a more glycolytic state and h) 3T3-L1s towards a more oxidative state. Error bars represent SEM and asterisks indicate statistical significance (*p < 0.05, **p < 0.01, ***p < 0.001, ****p < 0.0001) determined using a Student’s t-test. Scale bar is 50 μm.
Figure 3.
Figure 3.. Compression promotes YAP activation in fibroblasts and undifferentiated adipocytes.
Representative immunofluorescent images of murine a) NIH3T3 (n = 29 uncompressed, 44 compressed) and b) 3T3-L1 cells (n = 15 uncompressed and compressed) stained for the mechanoresponsive yes-associated protein (YAP). Analysis of log-transformed nuclear-to-perinuclear YAP intensity ratios (log[nuclear:perinuclear intensity]) reveals that compression significantly increases YAP nuclear localization in c) fibroblasts and d) undifferentiated adipocytes. Error bars represent SEM and asterisks indicate statistical significance (*p < 0.05, **p < 0.01, ***p < 0.001, ****p < 0.0001) determined using a Student’s t-test. Scale bar is 50 μm.
Figure 4.
Figure 4.. Compression alters the fibroblast transcriptome by upregulating key metabolic pathways that promote glycolysis while downregulating oxidative phosphorylation and related processes.
Following 24 hours of in vitro compression, NIH3T3 fibroblasts were collected for transcriptomic analysis using bulk RNA-sequencing. a) Gene set enrichment analysis (GSEA) based on gene ontology (GO) terms shows that compressed fibroblasts (n = 3) downregulate oxidative phosphorylation and several related mitochondrial processes, as well as upregulate glycolysis and autophagic processes compared to their uncompressed counterparts (n = 3), confirming our FLIM results in Fig. 2. This highlights the sensitivity of instant FLIM as it can detect subtle metabolic changes that are reflected at the transcriptional level. b) GSEA plots from GO terms showing upregulation of glycolysis (top) and downregulation of oxidative phosphorylation (bottom) in compressed fibroblasts. Statistical significance was determined using permutation testing with Benjamini-Hochberg correction for multiple comparisons (*p.adj < 0.05, **p.adj < 0.01, ***p.adj < 0.001). NES: normalized enrichment score.
Figure 5.
Figure 5.. Compressed undifferentiated adipocytes exhibit altered mitochondrial morphodynamics with impaired fusion.
Representative images of a) NIH3T3 fibroblasts and b) 3T3-L1 undifferentiated adipocytes stained with MitoTracker Red CMXRos. Qualitative observations of mitochondrial structure suggest that compression-induced mitochondrial damage occurs in undifferentiated adipocytes, but not fibroblasts, as indicated by greater fragmentation in the former. qPCR analysis of genes encoding proteins involved in mitophagy shows that none are differentially expressed in c) fibroblasts (n = 3), while Bnip3 and Park2 are significantly upregulated in d) compressed undifferentiated adipocytes (n = 3), confirming the qualitative data from a) and b). e) Representative immunofluorescent images of 3T3-L1 cells stained for MFN1 (fusion marker) and DLP1 (fission marker). Immunofluorescent analysis reveals that the f) expression and g) area fraction (proportion of total cell area occupied by protein signal) of MFN1 is significantly lower in undifferentiated adipocytes subjected to compression (n = 3) compared to those that were not compressed (n = 3). On the other hand, there are no significant changes in DLP1 h) expression and i) area fraction between compressed (n = 3) and uncompressed (n = 3) 3T3-L1 cells. This suggests that the increased presence of mitochondrial fragments in compressed undifferentiated adipocytes likely results from impaired fusion dynamics. Error bars represent SEM and asterisks indicate statistical significance (*p < 0.05, **p < 0.01, ***p < 0.001, ****p < 0.0001) determined using a Student’s t-test. Scale bar is 10 μm.
Figure 6.
Figure 6.. Fluorescence lifetime of human breast cancer stromal cells varies based on cell type and location relative to the tumor.
Brightfield images of human TNBC with adjacent breast tissue stained a) with hematoxylin & eosin (H&E) and b) for α-SMA (fibroblast marker). c) Representative fluorescence lifetime images and associated phasor plot for mature adipocytes and fibroblasts in the tumor (left), peritumor (middle), and normal stroma (right). d) Distribution of fluorescence lifetime in tumor-associated (left), peritumoral (middle), and normal stromal (right) adipocytes and fibroblasts. Consistent with trends observed in Fig. 2f, histogram comparisons reveal that adipocytes in the tumor exhibit lower fluorescence lifetime values, indicative of a more glycolytic phenotype, whereas those in the normal stroma display higher values, suggesting greater oxidative metabolism. Adipocyte metabolism in the peritumor, on the other hand, appears intermediate between both regions, with cells likely undergoing a glycolytic transition potentially reflecting changes in maturity states. In fibroblasts, fluorescence lifetime trends in the peritumor and normal stroma are less distinct due to tissue heterogeneity, wherein multiple stromal components in the tissue contribute to a complex, non-unimodal lifetime distribution, but generally feature glycolytic trends. Advanced deconvolution methods are therefore needed to accurately resolve metabolic activity in fibroblasts from other tissue components (e.g., matrix) within the same region. Black scale bar represents 2 mm, white scale bar is 50 μm.
Figure 7.
Figure 7.. Human breast peritumoral fibroblasts and adipocytes are more glycolytic than normal stromal cells.
To metabolically characterize human breast peritumoral adipocytes and/or fibroblasts, we conducted a retrospective analysis of two single-cell RNA sequencing datasets derived from human breast cancer patients. a) UMAP representation of fibroblasts (DCN+ and PDGFRA+) and/or adipocytes (CIDEA+ and ADIPOQ+) from dataset 1 (PRJNA960678; top) and dataset 2 (PRJNA932038; bottom) labeled by cluster. UMAP visualization of subclustered fibroblasts and/or adipocytes labeled according to their b) spatial location within the tissue (normal, peritumor, or tumor tissue zones) and c) metabolic index (MI). d) Mean MI analysis per patient reveals that stromal cells in the peritumor region exhibit higher glycolytic activity than their normal counterparts, with MI increasing as proximity to the tumor increases. The MI is a relative measure of metabolic activity based on the normalization and standardization of raw metabolic scores. Here, MI > 0 indicates cells are more glycolytic while MI < 0 suggests they have higher levels of oxidative phosphorylation activity. Statistical significance for dataset 1 was determined using a Student’s t-test while significance for dataset 2 was determined using one-way ANOVA with Tukey’s HSD correction. Asterisks indicate significance levels (*p < 0.05, **p < 0.01, ***p < 0.001, ****p < 0.0001). 1PRJNA960678; 2PRJNA932038.

Similar articles

References

    1. Arnold M. et al. Current and future burden of breast cancer: Global statistics for 2020 and 2040. Breast 66, 15–23 (2022). 10.1016/j.breast.2022.08.010 - DOI - PMC - PubMed
    1. Bray F. et al. Global cancer statistics 2022: GLOBOCAN estimates of incidence and mortality worldwide for 36 cancers in 185 countries. CA Cancer J Clin 74, 229–263 (2024). 10.3322/caac.21834 - DOI - PubMed
    1. Nia H. T., Munn L. L. & Jain R. K. Probing the physical hallmarks of cancer. Nat Methods (2025). 10.1038/s41592-024-02564-4 - DOI - PubMed
    1. Zhang S. et al. The peritumor microenvironment: physics and immunity. Trends Cancer 9, 609–623 (2023). 10.1016/j.trecan.2023.04.004 - DOI - PMC - PubMed
    1. Koca D., Abedi-Ardekani B., LeMaoult J. & Guyon L. Peritumoral tissue (PTT): increasing need for naming convention. Br J Cancer 131, 1111–1115 (2024). 10.1038/s41416-024-02828-y - DOI - PMC - PubMed

Publication types

LinkOut - more resources