[Preprint]. 2025 Jun 4:2025.06.04.657859.
doi: 10.1101/2025.06.04.657859.

Desiccation-induced DNA damage facilitates drug resistance in Mycobacterium tuberculosis

Affiliations

Desiccation-induced DNA damage facilitates drug resistance in Mycobacterium tuberculosis

C D Brown et al. bioRxiv. .

Abstract

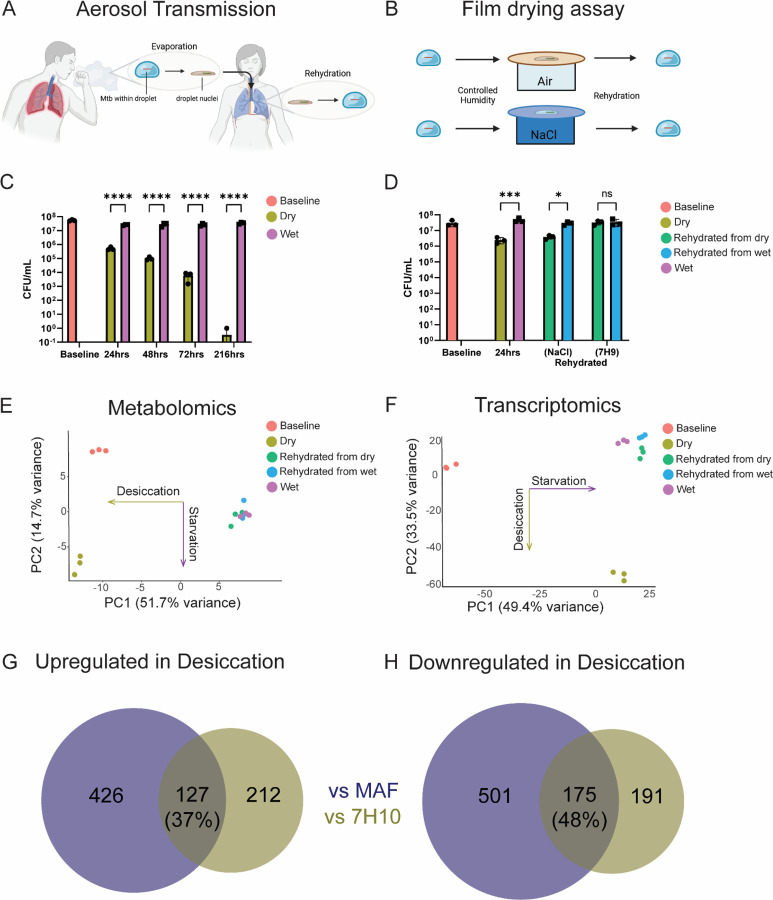
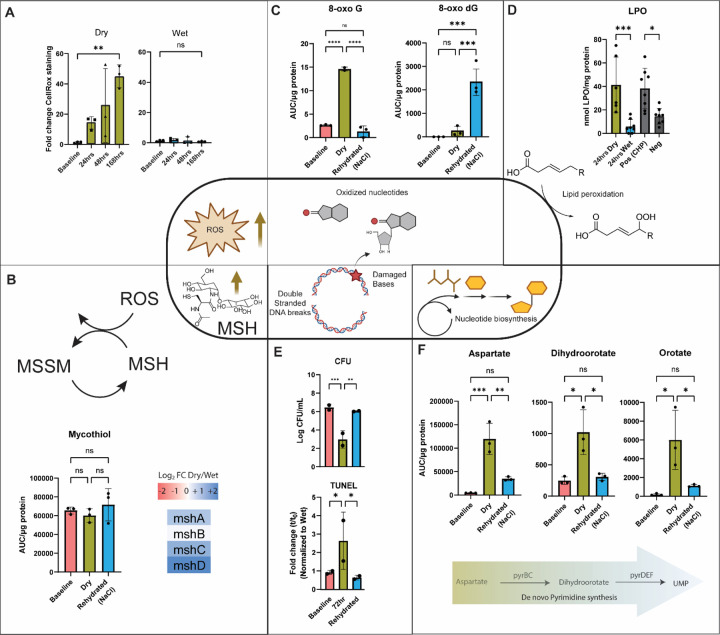
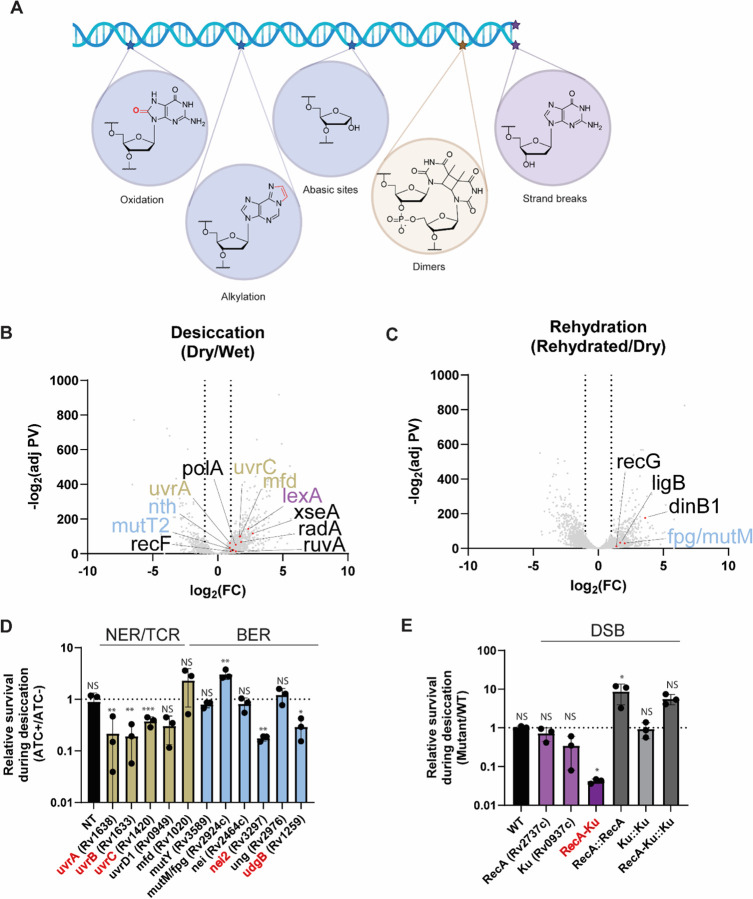
Mycobacterium tuberculosis (Mtb) is an obligate human pathogen that depends on its ability to spread from host-to-host to survive as a species. Yet, knowledge of transmission-specific traits remains lacking. Here, we report the discovery of a specific adaptive response to desiccation, a stress intrinsically linked to the generation of the aerosol droplets within which Mtb transmits. We show that desiccation inflicts oxidative damage and activates Mtb's DNA repair responses but that this repair is imperfect and results in mutations. We further show that activation of these DNA repair responses is accompanied by increased expression of the transcription-coupled repair factor, mfd, but that this expression serves to buffer the fitness cost of specific resistance-conferring mutations in rpoB, the target of the frontline drug rifampin, rather than to facilitate transcription-coupled DNA repair. Silencing mfd during aerosolization impairs survival of strains harboring the rifampin resistance allele S450L. This function is further supported by whole genome sequence data from over 50,000 clinically circulating strains. These studies indicate that Mtb has evolved transmission-specific stress responses that have enabled it to leverage desiccation-induced DNA damage as a potential source of genetic diversification and drug resistance.


Figures

Figure 1:
Figure 1:
Modeling the desiccation component of aerosol transmission in Mycobacterium tuberculosis. A) An infected host expels Mtb-laden droplets which evaporate to form droplet nuclei; subsequently, these particles are inhaled by a susceptible individual. B) Schematic of drying assay to mimic a desiccation-rehydration cycle. Cells deposited on a sterile filter are allowed to dry out in temperature- and humidity-controlled air and compared against control condition left in contact with a 200 mM NaCl reservoir. C) CFU recovery over 1 week of drying compared to wet (saline) controls. D) CFU recovery following 24 hours of desiccation then rehydration into NaCl or 7H9 media. E) Principal components analysis (PCA) plot of 3 biological replicates from one of two independent experiments comparing baseline (red) metabolome to 24 hours of desiccation (gold), saline control (purple), and rehydration into 200 mM sodium chloride (green and blue). F) PCA plot of 3 biological replicates from one of two independent transcriptomics experiments with batch correction comparing baseline (red) transcriptome to 24 hours of desiccation (gold), saline control (purple), and rehydration into 200 mM sodium chloride (green and blue). G) Venn diagrams prepared using DeepVenn (55) of genes with fold change expression >2 (adjusted p-value < 0.05, Benjamini-Hochberg multiple hypothesis correction) or H) Fold change < −2 in Dry vs MAF-adapted (blue) or 7H10-adapted (gold) Mtb. MAF: Model aerosol fluid(16). Statistical significance calculated by two-way ANOVA with Tukey’s multiple hypothesis correction, P <.05 (*), .01 (**), .001 (***) or .0001 (****).
Figure 2:
Figure 2:
Cells sustain oxidative damage and reversibly adapt to a desiccation-rehydration cycle. A) Cellrox green assay of desiccated versus wet control cells over a 1-week incubation quantified on a BD FACSCelesta Flow cytometer with excitation/emission parameters 488 [515/20] nm normalized to unstained controls. B) Targeted metabolomics of mycothiol levels and RNA Seq gene expression of mycothiol biosynthetic genes (Dry vs Wet). C) Targeted metabolomics of oxidized bases and nucleotides. D) Lipid peroxide abundance quantified by LPO assay of chromogen absorbance at 500 nm normalized to sample protein content by Bradford assay. E) CFU and TUNEL assay of dried and rehydrated cells. Double stranded breaks detected by quantification of FITC-labeling on a BD FACSCelesta Flow cytometer with excitation/emission parameters 488 [515/20] nm normalized to unstained controls. F) Targeted metabolomics of de novo pyrimidine biosynthetic intermediates. All metabolite measurements include three biological replicates from 1 of 2 independent experiments, were quantified by total ion count from an LC-MS assay and normalized to protein content using a Bradford assay. Statistical significance calculated by two-way ANOVA with Tukey’s multiple hypothesis correction, P <.05 (*), .01 (**), .001 (***) or .0001 (****), ns = not significant. MSH: Mycothiol, MSSM: Mycothiol disulfide, TUNEL: terminal deoxynucleotidyl transferase dUTP nick-end labeling, UMP: Uridine-5’-monophosphate
Figure 3:
Figure 3:
A multi-pronged DNA damage and repair transcriptional response is critical during desiccation-rehydration. A) Examples of chemically modified DNA bases color coded by repair processes that recognize them. Base excision repair (BER), blue; nucleotide excision repair (NER) or transcription coupled repair (TCR), gold; double stranded breaks (DSB), purple. B) RNA Seq volcano plot of annotated transcripts comparing cells desiccated for 24 hours to wet (saline) controls. Genes involved in NER/TCR, BER and DSB repair in gold, blue and purple, respectively. Additional polymerases, helicases and ligases in black. C) RNA Seq volcano plot of annotated transcripts comparing cells desiccated for 24 hours to cells rehydrated (into saline). D) Screen of CRISPRi knockdown strains after 24 hours of desiccation targeting NER, TCR and BER pathways plotted as a ratio of the relative survival of the knockdown compared to the ATC- control. E) Screen of DSB repair mutant strains after 24 hours of desiccation plotted as a ratio of the relative survival of the strain compared to wild type. See methods for details. Statistical significance calculated by 2-tailed, unpaired student’s t-test between ATC+/ATC- (D) or mutant/WT (E), P <.05 (*), .01 (**), .001 (***) or .0001 (****), ns = not significant. Strains with a significant decrease in viability highlighted in red. NT = non-targeting CRISPRi strain, ATC: anhydrotetracycline, WT: Wild type (Erdman).
Figure 4:
Figure 4:
Desiccation-induced mutagenesis promotes rifampin resistance via the activity of Mfd. Rif-R mutation frequency of desiccated cells of laboratory strain H37Rv (A) or mfd knockdown (B) before desiccation, immediately after 24 hours of desiccation, and following 24 hours rehydration after desiccation into nutrient rich media (7H9). Each panel displays 6 biological replicates from 1 of 2 independent experiments. Mutation frequency was calculated using the online fluctuation analysis calculator FALCOR (genomics.brocku.ca/FALCOR) using the Lea-Coulson method. Statistical significance was determined by two-way ANOVA with Tukey’s multiple comparison’s test. C) Rif-R allele frequency from two independent experiments following 24 hours of desiccation +/− inhibition of mfd. Statistical significance determined by chi squared analysis. D) Representative experiment from 2 independent assays each with 3 biological replicates of relative survival of mfd-silenced Rif-R strains after desiccation. Statistical significance determined by two-tailed unpaired student’s t-test. E) Schematic of TSS system (Nuritdinov 2025, submitted) F) Relative survival of Rif-S (rpoB WT) and Rif-R (rpoB S450L) mfd KD strains after aerosolization in the TSS, ATC: anhydrotetracycline, RIF: rifampin. G) Ratio of H445:S450 Rif-R mutants in MTB-51229 global lineage data set (41), subset analysis, and from Shanmugam et. al (42). Statistical significance determined by Fisher’s exact test. H) Phylogenic tree of Lineage 1 strains and I) clade L4.1.1 within MTB-51229. rpoB H445 SNP (blue) and rpoB S450 SNP (red). P <.05 (*), .01 (**), .001 (***) or .0001 (****), ns = not significant. ATC: Anhydrotetracycline, TSS: Transmission simulation system

Similar articles

References

    1. Goig G. A. et al. , Ecology, global diversity and evolutionary mechanisms in the Mycobacterium tuberculosis complex. Nat Rev Microbiol, (2025). - PubMed
    1. Goig G. A. et al. , Transmission as a Key Driver of Resistance to the New Tuberculosis Drugs. N Engl J Med 392, 97–99 (2025). - PMC - PubMed
    1. Global tuberculosis report 2024. Geneva: World Health Organization. (2024).
    1. Ernst J. D., The immunological life cycle of tuberculosis. Nat Rev Immunol 12, 581–591 (2012). - PubMed
    1. Cambier C. J., Falkow S., Ramakrishnan L., Host evasion and exploitation schemes of Mycobacterium tuberculosis. Cell 159, 1497–1509 (2014). - PubMed

Publication types

LinkOut - more resources